1961—2014年黄土高原气温和降水变化趋势
晏利斌
(中国科学院地球环境研究所 黄土与第四纪地质国家重点实验室,西安 710061)
doi:10.7515/JEE201505003
1961—2014年黄土高原气温和降水变化趋势
晏利斌
(中国科学院地球环境研究所 黄土与第四纪地质国家重点实验室,西安 710061)
利用黄土高原地区52个气象站1961—2014年月气温和月降水资料,采用线性趋势法、累积距平法、Mann-Kendall法和Morlet小波分析等方法,对近54年来黄土高原气候变化和突变现象进行了分析。结果表明:1961—2014年黄土高原年平均气温呈上升趋势,线性趋势为0.31℃·10a-1(P<0.01),在1991年前后发生了由低温到高温的突变。四季均温均呈增加趋势,其中冬季增速最大,达0.44℃·10a-1。气温年代际变化呈现明显的变暖趋势,1991年以后变暖加速,其中冬季均温增速最大。年均气温增速较大的地区位于黄土高原北部地区,黄土高原南部地区气温增速较小,变暖速率的空间分布随纬度升高而变大。1961—2014年黄土高原年降水量变化不明显,整体呈波动式下降,线性趋势为-7.51mm·10a-1(P>0.05);其中1961—1970年属于降水偏多的年代,而1991—2000年属于降水偏少的年代。季节降水量呈现不同变化趋势和强度,其中秋季、夏季和春季降水量呈减少趋势,秋季降水减少速率最大,为-3.56mm·10a-1;而冬季呈弱增加趋势,为0.43mm·10a-1。年降水量减少速率最大的地区位于黄土高原东南部,而黄土高原西北部降水变化不明显。Morlet小波分析结果表明,黄土高原年平均气温存在4a和7~9a变化周期,黄土高原年降水量存在5~7a和12~14a变化周期。通过以上分析,近54年黄土高原气候总体呈现暖干化趋势。
气温;降水;气候变化;黄土高原
全球气候变化及其影响是当今广泛关注的热点。IPCC第五次评估报告(Qin et al,2014)指出,近百年全球变暖毋庸置疑;中国气候变暖与全球趋势一致,最近60年气温上升明显,平均每10年约升高0.23℃,几乎是全球的两倍;近百年中国年降水量变化趋势不明显,20世纪50年代到70年代,我国多雨带位于华北地区,之后南移到长江流域和华南地区,本世纪以来,雨带北移。
黄土高原位于我国半湿润气候区与半干旱干旱气候区的过渡带,既是气候变化的敏感区,又是环境脆弱区。研究表明1952—2002年黄土高原代表性站点经历了暖干化发展趋势(刘晓清等,2006),对生态环境和社会可持续发展有重要影响(宋怡等,2012;郭娇等,2013;李相儒等,2015)。目前,亟需系统分析有人工观测记录以来的黄土高原气温和降水的时空变化特征。
本文选取黄土高原52个气象站1961—2014年的月平均气温和月降水量资料,借助线性趋势法、累计距平法、Mann-Kendall法和小波分析等方法,研究了黄土高原气温和降水的趋势变化、突变变化和周期变化,对认识黄土高原气候变化规律有重要科学意义。
1 资料与方法
本研究选取了黄土高原地区52个代表气象站点(图1),1961—2014年的月平均气温和月降水量数据由中国气象数据网(http://data.cma.cn)提供。各站点的缺测数据采用邻近站点的观测数据用多元回归插值补齐。本研究对黄土高原气温和降水量的季节变化进行了研究,季节划分方法为:春季(3月—5月)、夏季(6月—8月)、秋季(9月—11月)和冬季(12月—次年2月)。
为分析气温和降水的趋势变化,采用了一元线性回归分析;为检测气温和降水的突变年份,采用了Mann-Kendall检验和累积距平分析;为提取气温和降水的周期变化,采用了Morlet小波分析方法。关于上述分析方法的具体介绍,详见魏凤英(2007)。
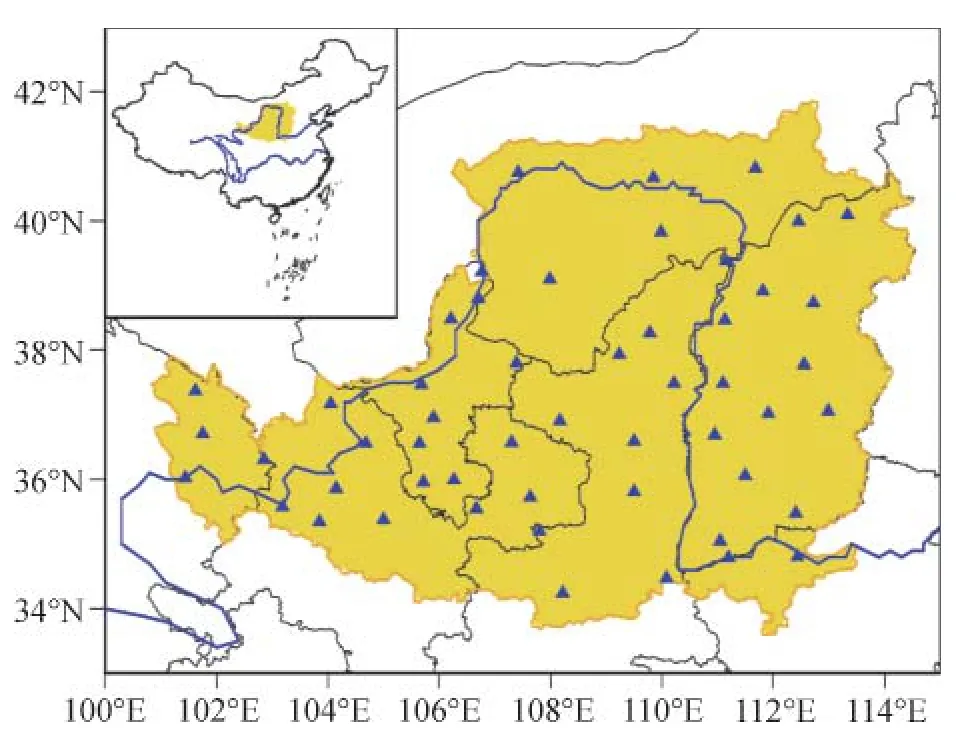
图1 黄土高原52个气象观测站分布图Fig.1 The location of 52 meteorological stations on the Loess Plateau
2 结果与分析
2.1 气温与降水量的年际变化
1961—2014年黄土高原年平均气温为7.20~9.81℃,年平均气温在波动中逐渐上升,线性趋势为0.31℃·10a-1(P<0.01)(图2),明显高于全国平均变暖速率0.22℃·10a-1(Ren et al,2005)。黄土高原四季平均气温均呈增加趋势,其中冬季增幅最大,达0.44℃·10a-1;春季次之,为0.34℃·10a-1;秋季为0.26℃·10a-1;夏季增温幅度最小,为0.19℃·10a-1。
1961—2014年黄土高原年降水量变化为295.17~646.09 mm,年降水量在波动中下降,线性趋势为-7.51 mm·10a-1(P>0.05)(图2),与全国平均年降水量在波动中略有减少的趋势相似(王遵娅等,2004)。1961—2014年黄土高原季节降水量呈现不同变化趋势和强度,其中秋季、夏季和春季降水量呈减少趋势。秋季降水减少速率最大,为-3.56 mm·10a-1;其次是夏季,为-2.72 mm·10a-1;春季为-1.64 mm·10a-1;而冬季呈弱增加趋势,为0.43 mm·10a-1。
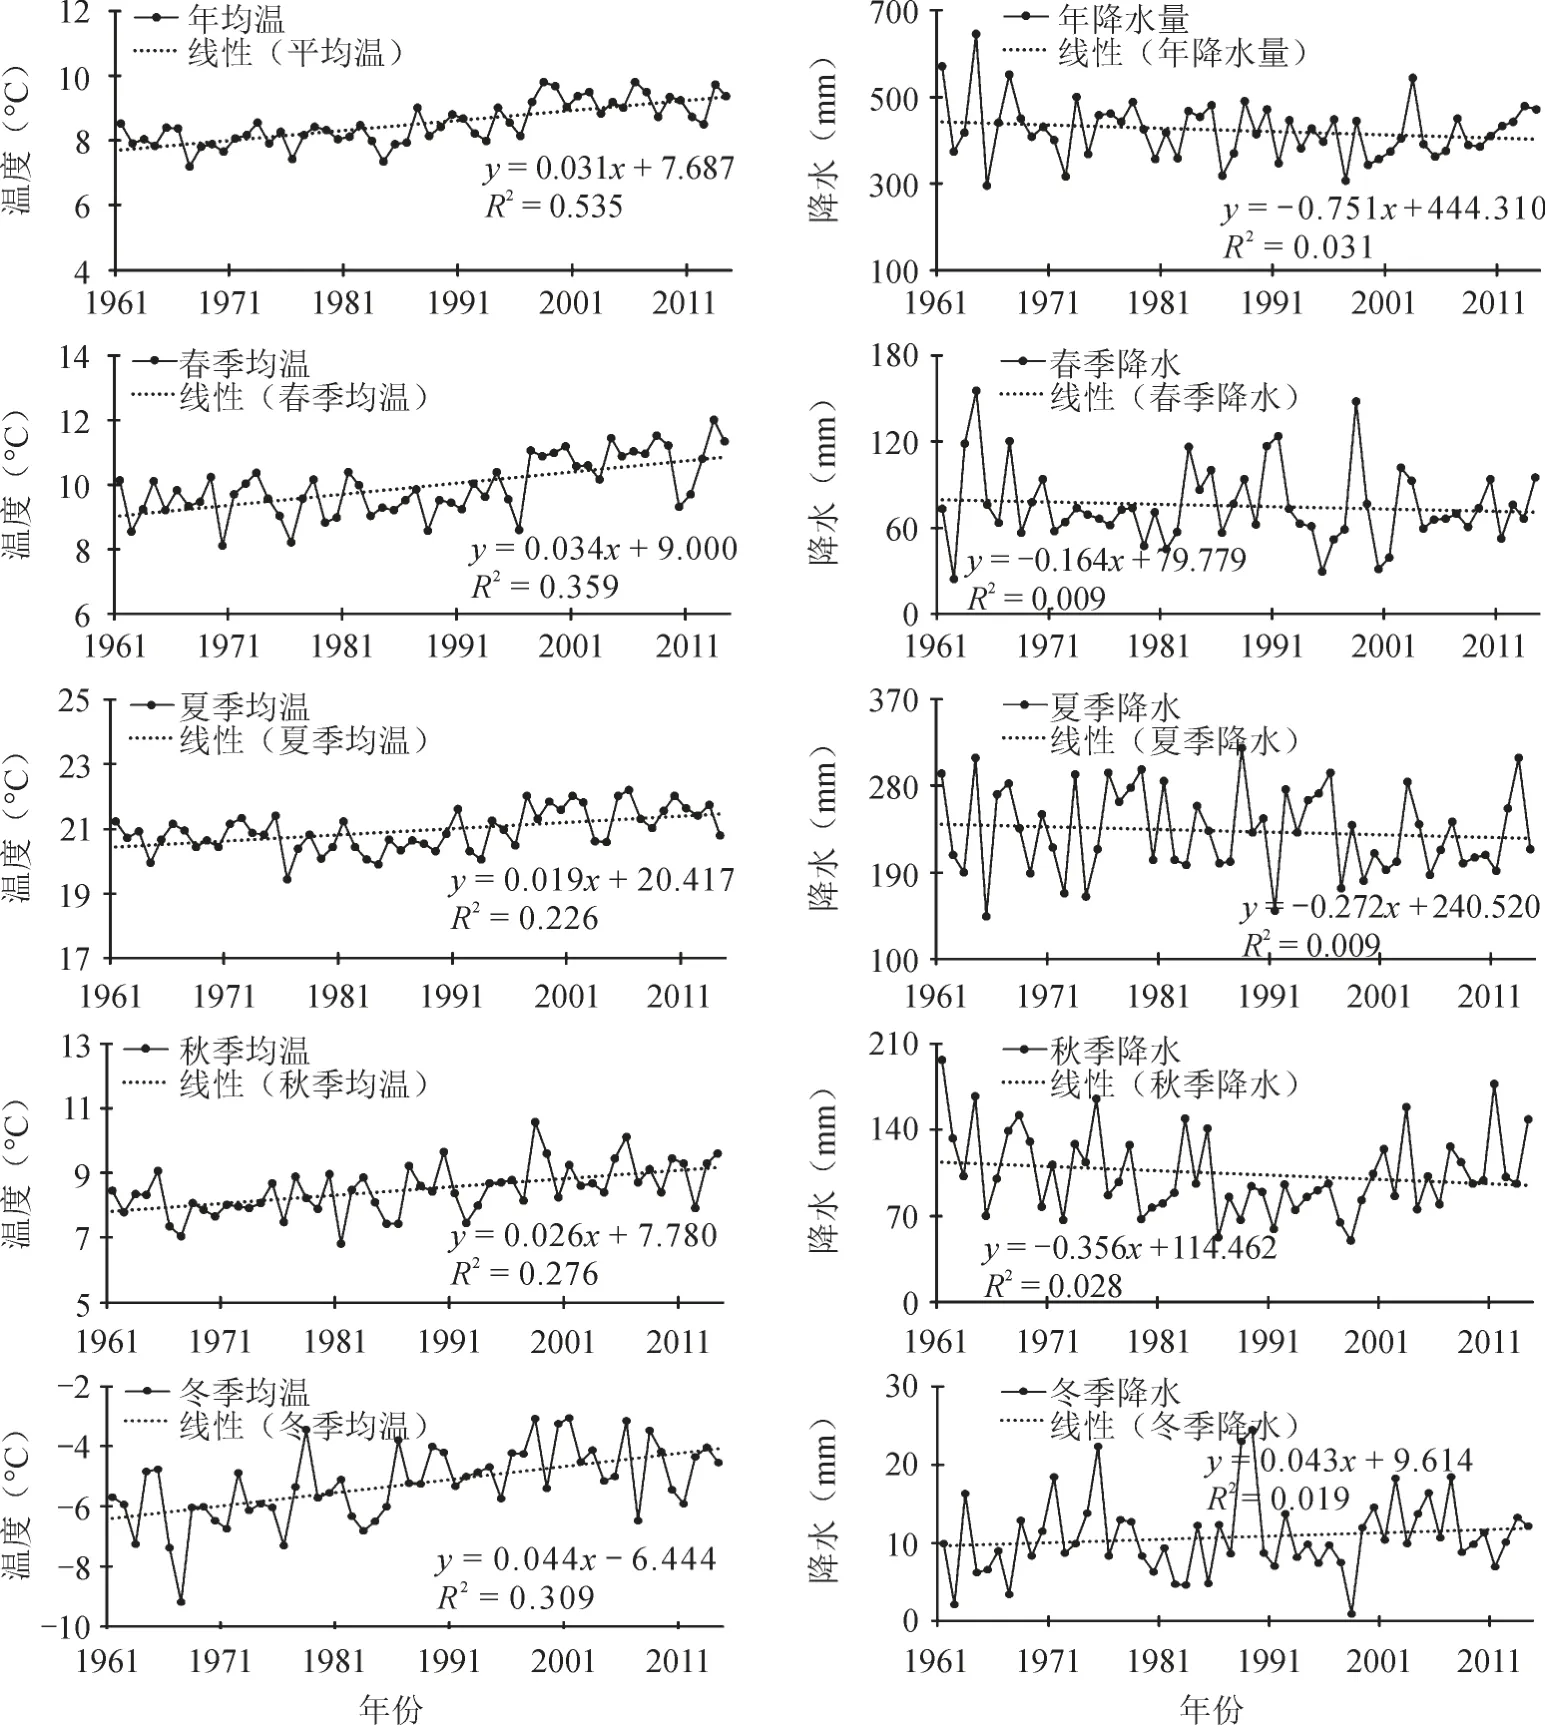
图2 1961—2014年黄土高原气温与降水量的年、季节变化Fig.2 Variation of the annual and seasonal temperature and precipitation during 1961—2014 on the Loess Plateau
2.2 气温与降水量的年代际变化
黄土高原气温年代际变化呈现明显的变暖趋势(表1),1961—1970年、1971—1980年和1981—1990年气温偏冷,但期间气温已呈年代际上升趋势,1991—2000年开始变暖加速,其后气温逐年升高且上升幅度逐年增大。季节温度的年代际变化也呈统一的增暖趋势,四个季节均温均在1991—2000年开始变暖,其中冬季均温增幅最大。
黄土高原降水量年代际变化趋势不明显,整体上呈现出减少趋势(表2),其中1961—1970年属于降水偏多的年代,而1991—2000年属于降水偏少的年代。冬季降水量年代际变化呈现年代际增加趋势,其他三个季节呈减少趋势。
2.3 气温与降水量线性趋势的空间变化
1961—2014年黄土高原年均气温呈增加趋势,52个站点均增温趋势显著(P<0.01),平均增温幅度为0.31℃·10a-1。年均气温增率较大的地区位于黄土高原北部地区 (图3),线性趋势约0.6℃·10a-1;气温增速较小的地区为黄土高原南部地区,线性趋势约0.2℃·10a-1。四个季节增温以冬季最为显著,其次是春季、秋季,夏季增速最小。四个季节变暖速率的空间分布均随纬度升高而变大,即黄土高原北部地区变暖比南部地区变暖快。
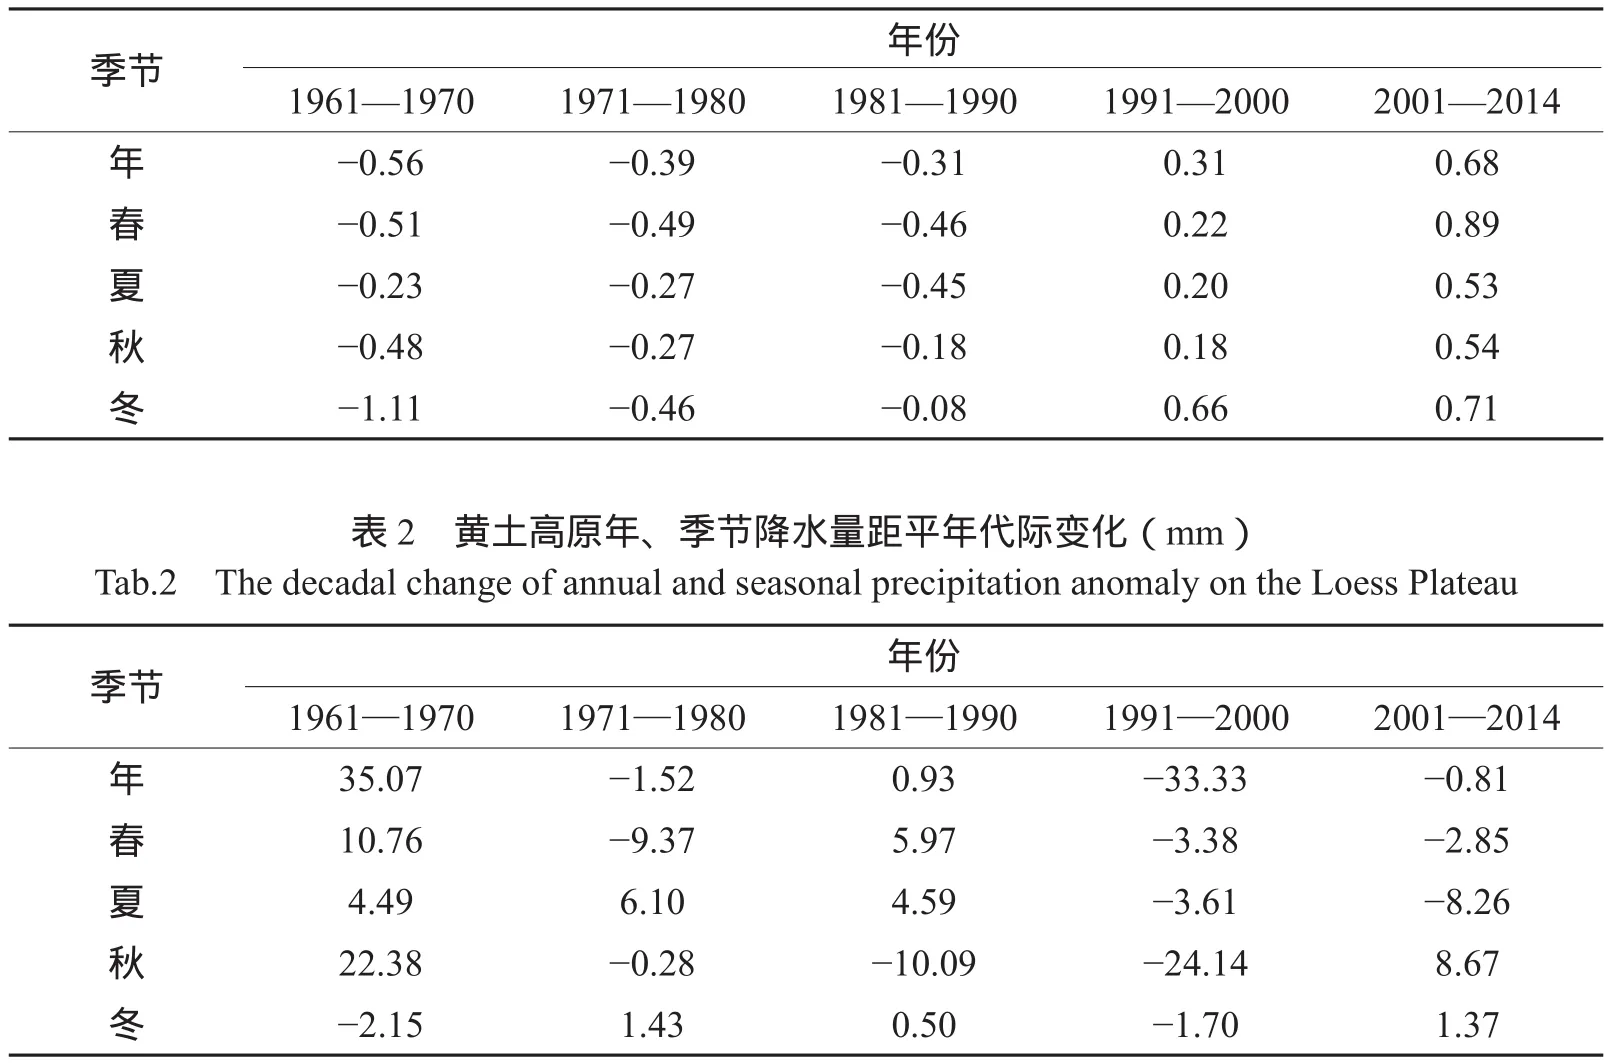
表1 黄土高原年、季节温度距平年代际变化(℃)Tab.1 The decadal change of annual and seasonal temperature anomaly on the Loess Plateau
1961—2014年黄土高原年降水量呈下降趋势,52个站点中45个站点呈减少趋势,52个站点平均线性趋势为-7.51 mm·10a-1(P>0.05)。年降水量减少趋势最大的地区位于黄土高原东南部(图3),而黄土高原西北部降水变化不明显。四个季节以秋季减少幅度最大,其次是夏季和春季,而冬季呈现出弱增加趋势。春、夏、秋季降水量变化趋势的空间分布,呈黄土高原东南部减幅大而西北部变化不大,与年降水量相似。
2.4 年均温和年降水量的突变检测
利用Mann-Kendall法对黄土高原1961—2014年年平均气温进行了突变检验分析(图4)。由图4可知,UF曲线在1971年之前呈波动下降趋势,之后呈波动上升趋势,1995年前后这种上升趋势超过了显著性水平0.05的置信水平。UF曲线和UB曲线有一个交叉点(1991年)。累计距平分析结果显示(图4),1961—2014年黄土高原年平均气温累计距平呈现先下降后上升的趋势,20世纪80年代中期以前呈下降趋势,20世纪90年代中期以后呈上升趋势,说明黄土高原年均气温经历了下降—上升的过程,突变发生在20世纪80年代中期到20世纪90年代中期之间。结合两种方法的分析结果,判断黄土高原年均气温在1991年前后发生了由低温到高温的突变。
年降水量的Mann-Kendall检验结果显示(图5),UF曲线波动下降,但未超过置信水平,UF在置信区间内与UB线仅在1971年前有5个交点,这与20世纪60年代年降水量波动幅度大有关。累积距平分析表明(图5),1961—2014年黄土高原年降水量整体上呈现出减少趋势,其中1961—1970年年降水逐渐增加,而1991—2000年年降水量逐渐减少。结合两种分析结果,判断1961—2014年黄土高原年降水量无明显突变。
2.5 年均温和年降水量变化周期
图6给出了黄土高原年平均气温和年降水量的Morlet小波变换的小波振幅,正值区表示气温偏高/降水偏多,负值区则相反。从图6a可以看出,年平均气温小波系数振幅在4a和7~9a时间尺度上较为密集,且存在小波振幅高、低值中心的变换。其中4a左右的变化周期,与王澄海等(2012)的研究结果一致。从图6b可以看出,年降水量小波系数振幅在5~7a和12~14a时间尺度上较为密集,且存在小波振幅高、低值中心的变换。
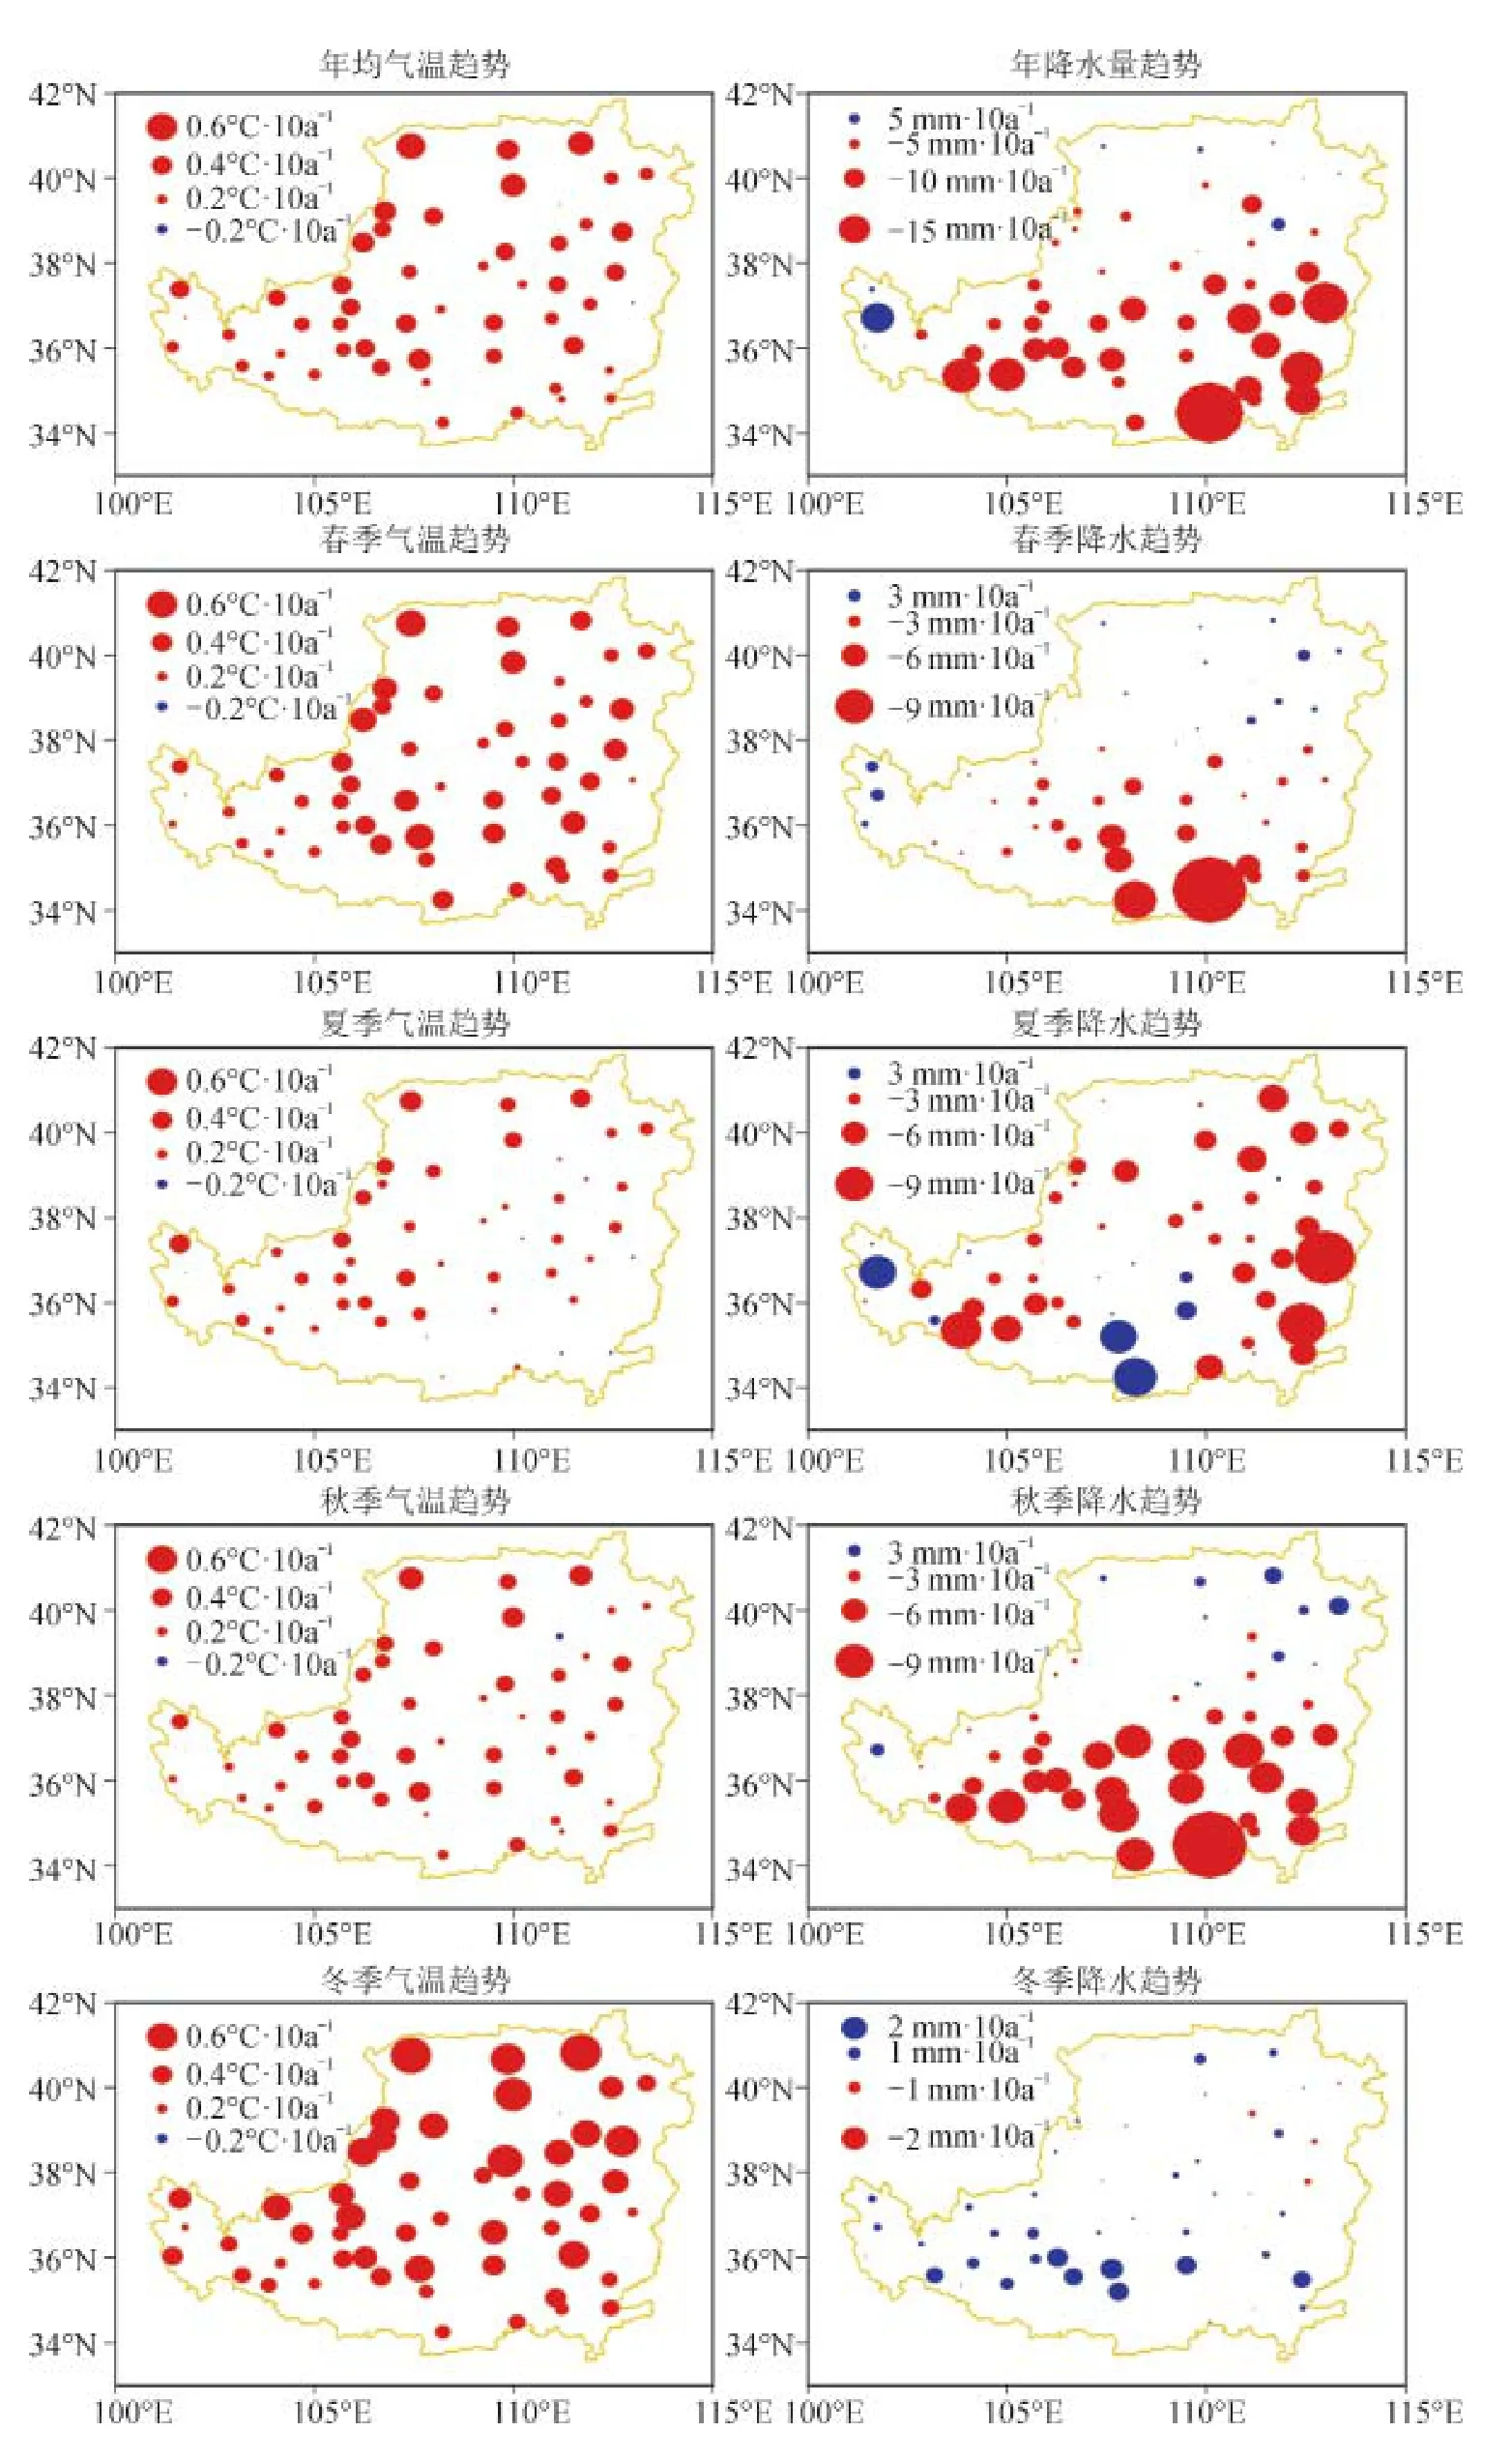
图3 1961—2014年黄土高原气温和降水线性变化趋势空间分布Fig.3 The spatial distribution of linear trends of temperature and precipitation during 1961—2014 on the Loess Plateau

图4 黄土高原年平均气温Mann-Kendall突变判别曲线(左)和年均气温累计距平值(右)Fig.4 Mann-Kendall test of annual mean temperature(left)and accumulated annual mean temperature anomaly(right)on the Loess Plateau

图5 黄土高原年降水量Mann-Kendall突变判别曲线(左)和年降水量累计距平值(右)Fig.5 Mann-Kendall test of annual precipitation(left)and accumulated annual precipitation anomaly(right)on the Loess Plateau

图6 1961—2014年黄土高原年均气温(a)和年降水量(b)的小波振幅Fig.6 Wavelet amplitude of annual mean temperature(a)and annual precipitation(b)on the Loess Plateau during 1961—2014
3 结论
通过对我国黄土高原52个观测站点1961—2014年气温和降水量的变化特征分析,过去54年黄土高原气温呈现显著上升趋势,降水量呈波动式下降趋势,总体气候呈现暖干化趋势,对全球变暖响应显著。
(1)1961—2014年黄土高原年平均气温在波动中逐渐上升,线性趋势为0.31℃·10a-1(P<0.01);四季平均气温均呈增加趋势,其中冬季增速最大,达0.44℃·10a-1。气温年代际变化呈现明显的变暖趋势,1991年以后变暖加速,季节温度的年代际变化也呈统一的增暖趋势,其中冬季均温增速最大。突变检验分析和累计距平分析揭示,1961—2014年黄土高原年平均气温累计距平呈现先下降后上升的趋势,在1991年前后发生了由低温到高温的突变。
(2)1961—2014年黄土高原年降水量变化不明显,整体呈波动中下降趋势,线性趋势为-7.51mm·10a-1(P>0.05);季节降水量呈现不同变化趋势和强度,其中秋季、夏季和春季降水量呈减少趋势;秋季降水减少速率最大,为-3.56mm·10a-1;而冬季呈弱增加趋势,为0.43mm·10a-1。降水量年代际变化趋势不明显,整体上呈现出减少趋势,其中1961—1970年属于降水偏多的年代,而1991—2000年属于降水偏少的年代。
(3)近54年年均气温增率较大的地区位于黄土高原北部地区,气温增率较小的地区为黄土高原南部地区,变暖速率的空间分布随纬度升高而变大。年降水量减少速率最大的地区位于黄土高原东南部,而黄土高原西北部降水变化不明显,降水变化趋势的空间分布呈黄土高原东南部减速大而西北部变化不大。
(4)Morlet小波分析结果表明,黄土高原年平均气温存在4a和7~9a变化周期,黄土高原年降水量存在5~7a和12~14a变化周期。
郭 娇,叶 浩,吴利杰,等.2013.气候变化和人类活动对黄土高原小流域生态环境的影响[J].地球环境学报,4(2): 1261 - 1265.[Guo J,Ye H,Wu L J,et al.2013.Inf uence of climatic change and human activities on ecological environment in small watershed of Loess Plateau [J].Journal of Earth Environment,4(2):1261 - 1265.]
李相儒,金 钊,张信宝,等.2015.黄土高原近60年生态治理分析及未来发展建议[J].地球环境学报,6(4): 248 - 254.[Li X R,Jin Z,Zhang X B,et al.2015.Analysis of ecosystem management of the Loess Plateau during the past 60 years and suggestions for the future development [J].Journal of Earth Environment,6(4):248 - 254.
刘晓清,赵景波,于学峰.2006.黄土高原气候暖干化趋势及适应对策[J].干旱区研究,23(4):627 - 631.[Liu X Q,Zhao J B,Yu X F.2006.Study on the climatic warming-drying trend in the Loess Plateau and the countermeasures [J].Arid Zone Research,23(4):627 - 631.]
宋 怡,马明国,金 钊.2012.黄土高原近30年植被变化特征及其气候驱动[J].地球环境学报,3(6):1174 - 1182.[Song Y,Ma M G,Jin Z.2012.Vegetation cover change and its climate driving force in recent 30 years in Loess Plateau,China [J].Journal of Earth Environment,3(6): 1174 - 1182.
王澄海,李 健,许晓光.2012.中国近50年气温变化准3年周期的普遍性及气温未来的可能变化趋势[J].
高原气象,31(1):126 - 136.[Wang C H,Li J,Xu X G.Universality of quasi-3-year period of temperature in last 50 years and change in next 20 years in China [J].Plateau Meteorology,31(1): 126 - 136.]
王遵娅,丁一汇,何金海,等.2004.近50年来中国气候变化特征的再分析[J].气象学报,62(2): 228 - 236.[Wang Z Y,Ding Y H,He J H,et al.2004.An updating analysis of the climate change in China [J].Acta Meteorologica Sinica,62(2): 228 - 236.]
魏凤英.2007.现代气候统计诊断与预测技术[M].北京:气象出版社.[Wei F Y.2007.Modern climate statistical diagnosis and prediction technology [M].Beijing: China Meteorological Press.]
Qin D,Plattner G K,Tignor M,et al.2014.Climate change 2013: The physical science basis [M].Cambridge,UK,and New York: Cambridge University Press.
Ren G Y,Guo J,Xu M Z,et al.2005.Climate changes of China's mainland over the past half century [J].Acta Meteorologica Sinica,63(6): 942 - 956.
Characteristics of temperature and precipitation on the Loess Plateau from 1961 to 2014
YAN Li-bin
(State Key Laboratory of Loess and Quaternary Geology,Institute of Earth Environment,Chinese Academy of Sciences,Xi'an 710061,China)
The pattern and characteristics of climate changes on the Loess Plateau were analyzed with the methods of the linear regression,cumulative anomaly,Mann-Kendall test and Morlet wavelets analysis based on monthly temperature and monthly precipitation data observed at 52 meteorological stations from 1961 to 2014.The results showed that the climate on the Loess Plateau featured a signif cant warming trend,and the annual mean temperature has increased by 0.31℃·10a-1(P < 0.01)from 1961 to 2014,and an abrupt change from low temperature to high temperature occurred in 1991.The four seasonal temperatures all showed increasing trends,especially in winter with the increasing rate of 0.44℃·10a-1.The decadal change in temperatures also showed increasing trends,and exhibited greater warming rates since 1991,especially for winter temperature.The warming rate was larger on the northern Loess Plateau than that on the southern Loess Plateau,and featured greater warming rate with higher latitude.Theannual precipitation showed a decreasing trend in recent 54 years,and has decreased by -7.51 mm·10a-1(P>0.05)from 1961 to 2014,and the precipitation in 1960s was higher,while in 1990s was less.The seasonal precipitation showed various trends.The autumn,summer and spring precipitation showed decreasing trends,especially for autumn precipitation by -3.56 mm·10a-1,while the winter precipitation showed an increasing trend of 0.43 mm·10a-1.The southeastern Loess Plateau showed greater decreasing trend in precipitation,while the northwestern Loess Plateau showed negligible trend.The climate change interval analysis revealed that the annual mean temperature f uctuated with the intervals of 4 years and 7~9 years,and the annual precipitation f uctuated with intervals of 5~7 years and 12~14 years.Overall,the climate was tended to be warmer and dryer in recent 54 years on the Loess Plateau.
temperature; precipitation; climatic change; the Loess Plateau
P467
A
1674-9901(2015)05-0276-07
2015-09-23
中国科学院重点部署项目(KZZD-EW-04-01);中国科学院西部之光西部博士资助项目
晏利斌,E-mail: yanlibin@ieecas.cn

