Structure Analysis and Classification of Precipitation Cells by Fractal Geometry
Nafissa Azzaz and Boualem Haddad
1. Introduction
The rainfall in general can be characterized by the convective regime and stratiform regime[1]. Convective precipitation is very intense, with a relatively short duration,and is very volatile[2]. In the opposite, stratiform rains are low on average, but can persist for hours, leading to an accumulation of significant rainfall[2].
The classification of precipitations in convective and stratiform regimes is useful in a variety of meteorology’s applications. It can help to improve the accuracy of rainfall retrieval from teledetection data obtained both on the ground and in space[3],[4].
Many studies have approached the problem of discrimination between convective precipitation and stratiform precipitation[5]. Most of the proposed algorithms consider a single criterion to identify convective and stratiform conditions, a threshold of Z, or a gradient of vertical reflectivity, or the difference of Z observed above and below the fusion level (or shiny band). The results obtained with these algorithms are not entirely convincing,because they do not cover all the full diversity of weather conditions[5],[6].
The work presented in this paper focuses on the difference between convective and stratiform cells in radar images, using fractal dimension and fractal lacunarity.
2. Database
In this study, we consider four different weather radar sites: Dakar (Senegal), Bordeaux (France), Melbourne(Florida, USA), and State College PA (Pennsylvania, USA).
2.1 Region of Dakar
Dakar is the capital of the Republic of Senegal. It is located at the western extremity of Africa, on the narrow peninsula of Cape Verde.
Being in a tropical semi-desert, Dakar has a microclimate of coastal type, influenced by the monsoon trade winds and sea. The hot wet season extends from June to October with temperatures of about 27°C and a peak of precipitations in August (250 mm).
The radar of Dakar is installed on a tower of 30 m above the sea level at Yoff Airport, in the east of Dakar. Its geographical coordinates are 14°44' north latitude and 17°29' west longitude. It is operated by both the National Meteorological Office of Senegal and ASECNA(Association for the Safety of Air Navigation). This radar works only during storm periods. The average intensity of rainfalls varies from 300 mm to 1500 mm from Saint Louis to Cap Skirring[7]. The technical characteristics of the weather radar of Dakar are given in Table 1.
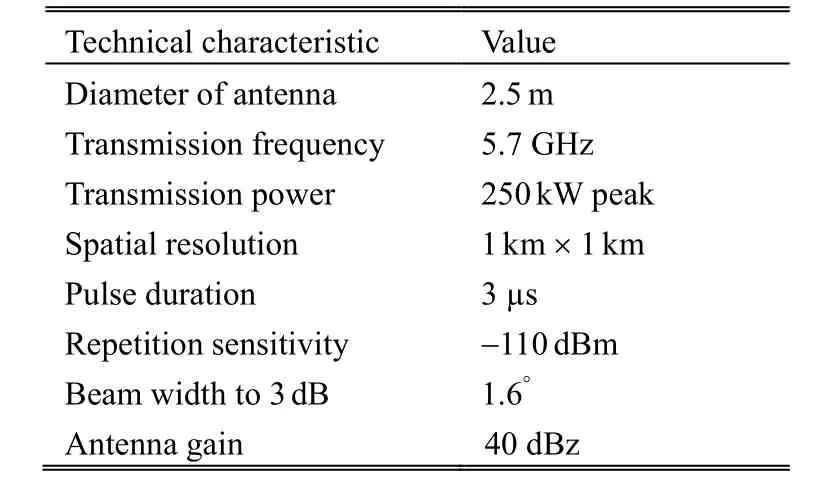
Table 1: Characteristics of the weather radar of Dakar region
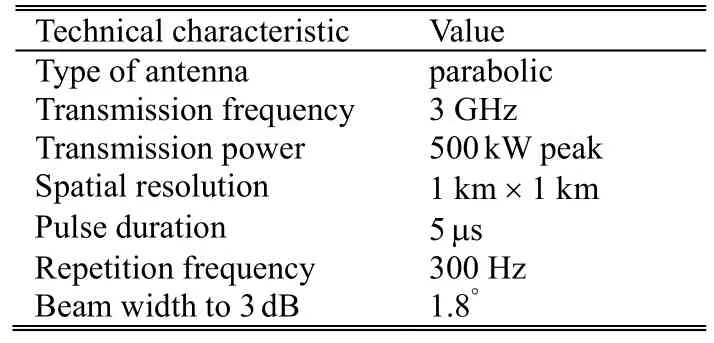
Table 2: Characteristics of the weather radar of Bordeaux region
2.2 Region of Bordeaux
The city of Bordeaux is located in the south western of France. The Bordeaux radar is located in the Bordeaux-Merignac airport, whose geographical coordinates are 44°49'54'' north latitude and 0°41'30'' west longitude. It is one of 24 metropolitan France radars. The digital analysis of the reflectivity of 8 bits (SANAGA) includes data processing and data storage[8]. The radar is a part of the French network (ARAMIS) managed by Météo-France.The area is almost flat. Table 2 gives the technical characteristics of the radar of Bordeaux.
2.3 Region of Melbourne
Melbourne is a city located on the east coast of Florida,United States of America. It is situated to the east of Orlando, and south of Cape Canaveral. It has a humid subtropical climate, the typical of the Gulf and South Atlantic states, although Melbourne is classified as a humid subtropical climate.
The radar used is Nexrad WSR-88D type, which works on the coherent Doppler principle. The geographical position of Melbourne radar is 28.109°N, 80.650°W. It allows to observe the precipitation in the oceanic, littoral,and terrestrial parts[9]. The Melbourne climate is subtropical,with hot and humid summers and cool winters.
The technical characteristics of the weather radar of Melbourne are given in Table 3.
2.4 Region of State College
State College is located in Pennsylvania State, the eastern of the United States of America. State College is situated at an elevation of approximately 1200 feet (370 m)above the sea level. It is surrounded by large tracts of farmland, and an expanse of mountains and forests. State College has a humid continental climate. The average temperature is -3.7°C in January and 21.8°C in July.Annual precipitation is less than 40 inches (1000 mm), and
46 .3 inches (118 cm) of snow a year falls in the city.
The radar used is Nexrad WSR-88D type called KCCX,which works on the coherent Doppler principle. Its technical characteristics are given in Table 4.
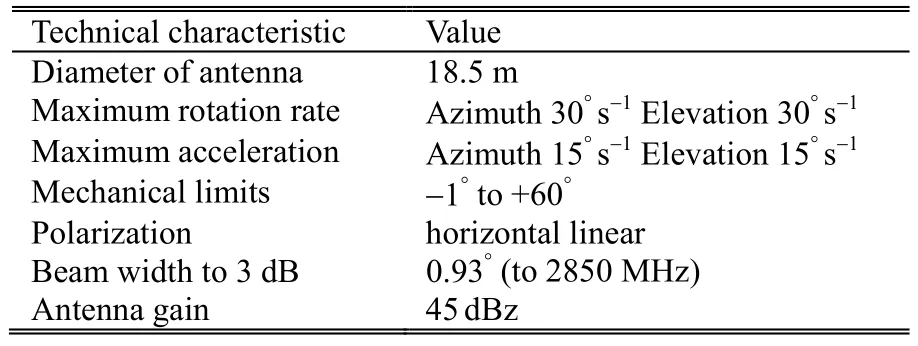
Table 3: Characteristics of the weather radar of Melbourne region
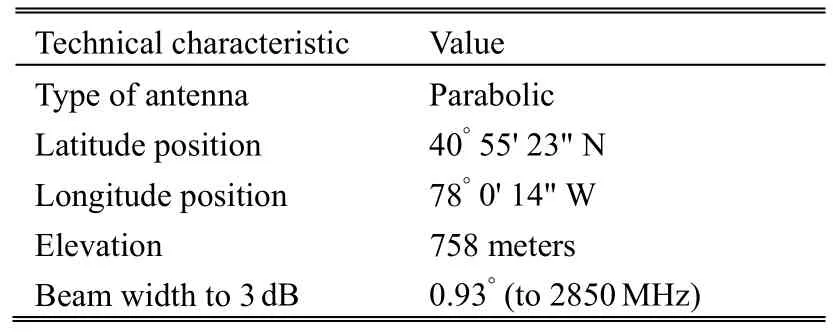
Table 4: Characteristics of the weather radar of State College region
3. Theoretical Concepts
3.1 Fractal Dimension
The concept of fractals was first introduced by Mandelbrot[10],[11], as an indicator of surface roughness. The fractal theory has been widely applied to different scientific areas, particularly image processing. It contains information about geometric structures of fractals and can also be used for non-fractals. It is a measure to quantize the complexity of the geometrical objects. Many approaches were proposed for estimating the fractal dimension of images. In our case,we use the box-counting approach[12]. This method is based on the recovery of the space in which the object is included in order to calculate the fractal dimension by a grid consisting of square (or “boxes”) of side ε. The number N(ε ) represents the number of boxes which are used to pave the object. The size of boxes is then defined by:

3.2 Fractal Lacunarity
Lacunarity is another concept introduced by Mandelbrot[10]to quantize the nature of gaps in texture images. It is inspired from the Latin (lacuna) origin of the English word “lake”, defining a fractal as being “lacunar”when its gaps tend to be large. If a fractal has large gaps or holes, it has high lacunarity[11]. Visually different images sometimes may have similar values for their fractal dimensions. But lacunarity estimation can help us to distinguish such images.
It is a measure for spatial heterogeneity. So higher values of lacunarity implies more heterogeneity, as it means an object is more homogeneous when the lacunarity is low[13].
There are several methods for calculating the fractal lacunarity in the literature. In our case, we use the method of Allain and Cloitre, based on the sliding box algorithm,where the lacunarity Λ(L) is defined as a function of the scale L by[14]:

where s( L)is the average of masses per box, noted as μ; s2is the variance of masses per box, noted asσ2.
4. Results and Discussion
As an illustration, we present the results for the region of Dakar (Senegal). Fig. 1 shows an image of convective and stratiform cells, taken from Dakar radar, on July 12,2011.
4.1 Fractal Dimension
Fig. 2 shows the fractal dimension of convective and stratiform cells in region of Dakar.
We obtained for stratiform cells an average fractal dimension equal to 1.45, while for convective cells an average fractal dimension is equal to 1.02. The goodness of fit is given by a correlation coefficient of 0.93.
Table 5 shows the fractals dimensions Df, the fractal dimension minimum Df,min, and the fractal dimension maximum Df,max, obtained for the four regions studied.
We notice that for all the images studied, the fractal dimension values of stratiform cells are higher than of the convective ones. It shows that the stratiform cells are more deformed than the convective cells. As the fractal dimension varies with the nature of the cells and the prevailing climate in the region considered, we conclude that the precipitations have a multifractal structure; this result is in good agreement with the literature[15].
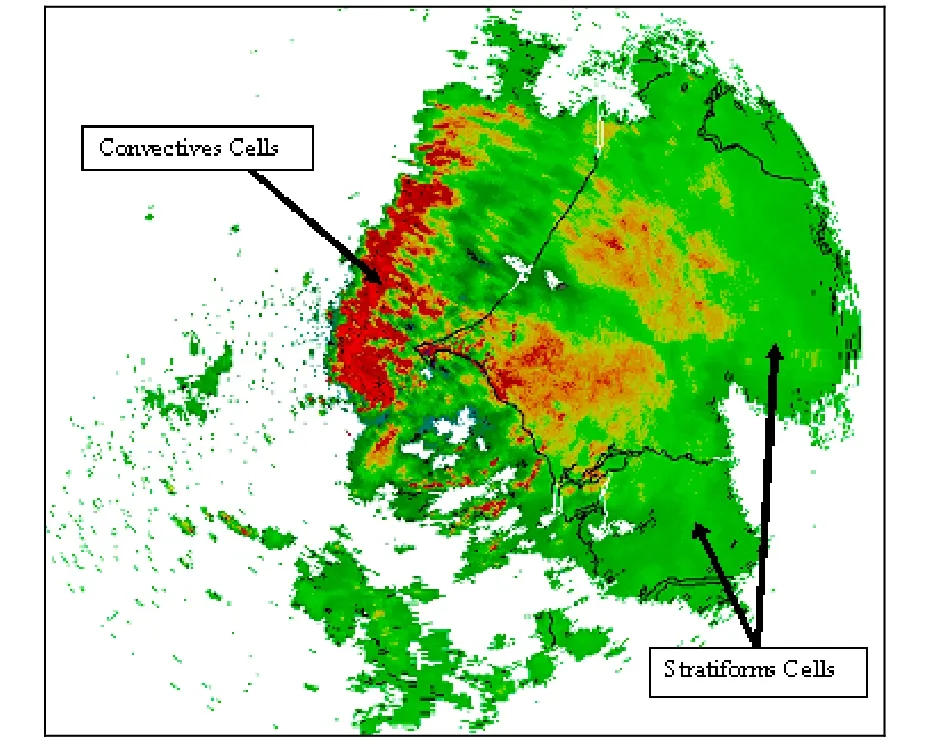
Fig. 1. Convective and stratiform cells obtained from radar images in Dakar.
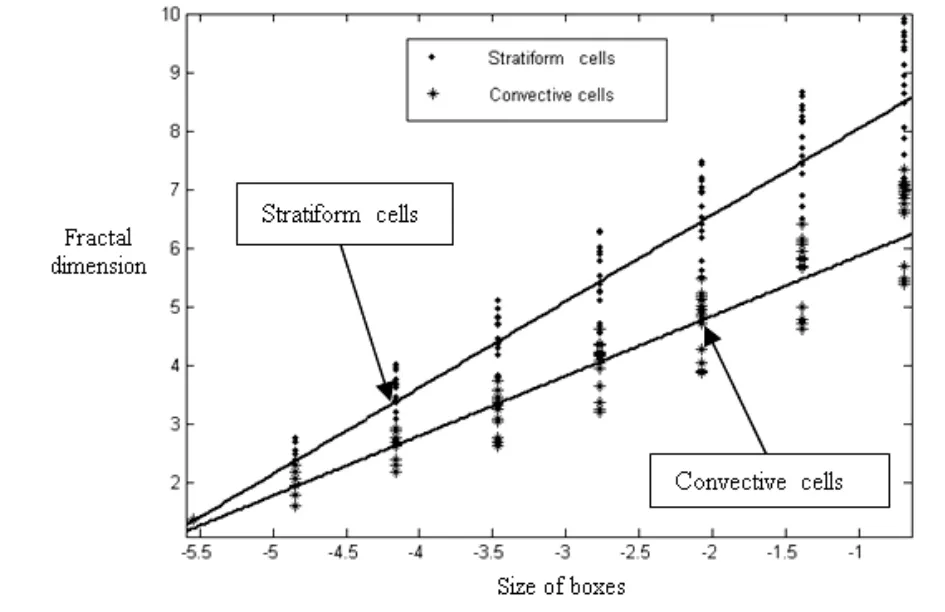
Fig. 2. Fractal dimension obtained for convective and stratiform cells.
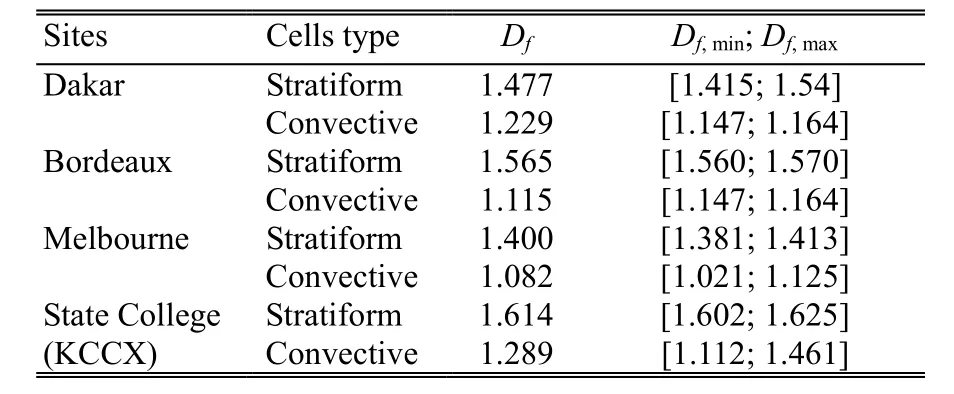
Table 5: Fractals dimensions obtained for the four regions.
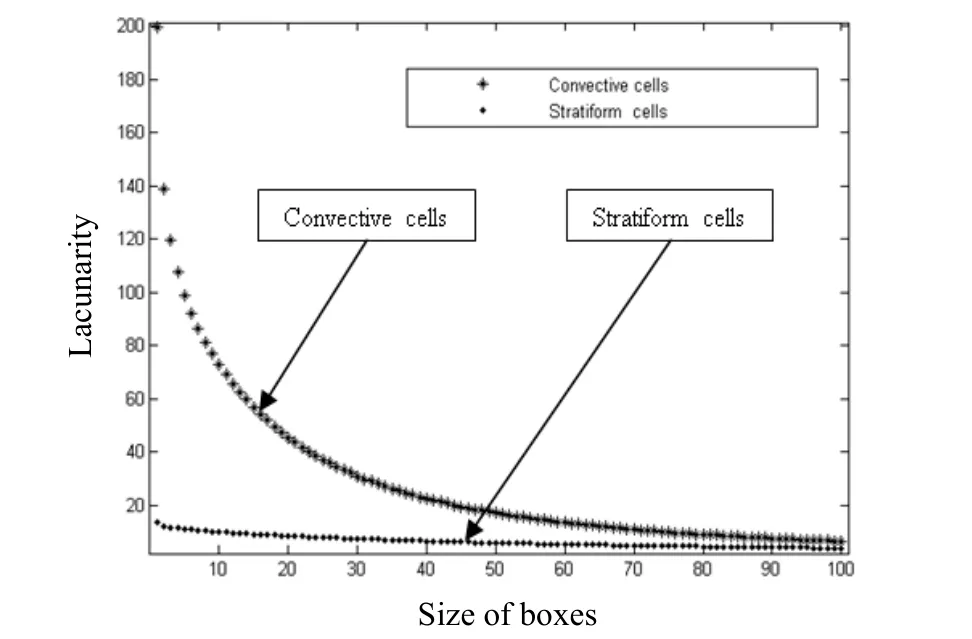
Fig. 3. Fractal lacunarity obtained for convective and stratiform cells.
4.2 Fractal Lacunarity
Fig. 3 represents the lacunarity fractal of convective cells and stratiform cells obtained for the site of Dakar.
It is observed that for all images analyzed, the behavior of the lacunarity Λ(x) resembles a hyperbola. Therefore, we approach the representations of the fractal lacunarity Λ(x)by the following model function L(x):

where a, b, c, and x represent the homogeneity factors,convergence order of L(x), translation term, and boxes size[16], respectively.
Table 6 shows the homogeneity factors of lacunarity curves obtained for the four regions studied. aminand amaxrepresent respectively the minimum and the maximum of the homogeneity factors obtained for each studied site.
We notice from Fig. 3 that the lacunarity curve of stratiform cells is below that of the convective cells. We then deduce that the stratiform cells are more homogeneous than the convective cells. The same conclusions are observed for the other radar sites.
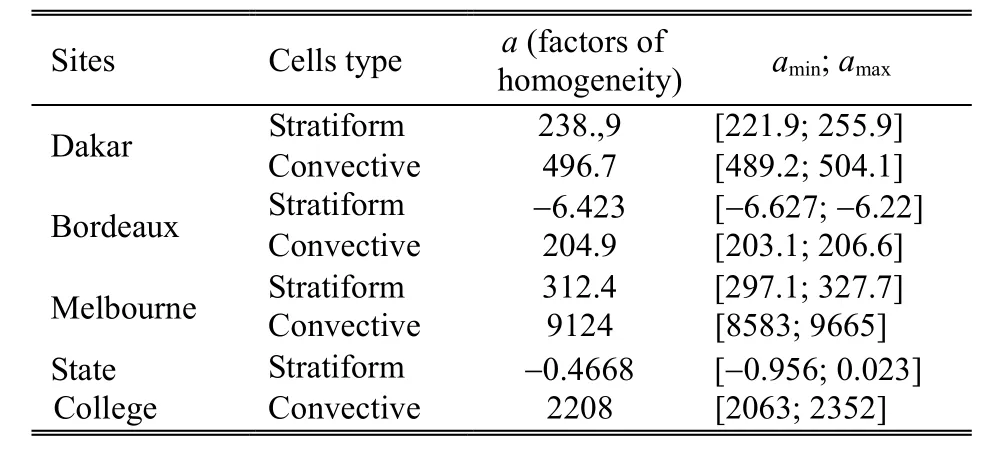
Table 6: Fractals dimensions obtained for the four regions
Also, from Table 6, we note that the parameter a of convective cells is greater than that of stratiform cells,whatever the study region. This is due to the fact that convective cells are less homogeneous than stratiform cells.
On the other hand, we know that the lacunarity is low when the texture is fine while it is high for a coarse texture[17].
We then deduce that the stratiform cells have a finer texture than the convective cells.
5. Conclusions
Our motivation in this work was to improve the recognition of cells types of precipitation by combining fractal measures and lacunarity measures. In the literature,the lacunarity and fractal dimension were always studied separately.
In this study, we showed that the fractal dimension and the fractal lacunarity are powerful discriminators between stratiform cells and convective cells. We also demonstrated that the stratiforms cells are more homogeneous and more distorted than convectives cells whatever the prevailing climate.
The calculation methods used in this paper, based on fractal geometry, could become an important complement to conventional techniques currently used in radar imaging for the identification and evaluation of rainfall. It can improve weather forecasts in the medium and long term.
[1] R. A. Houze, Jr., Cloud Dynamics, San Diego: Academic Press, 1993, pp. 570-573.
[2] F. Tridon, J. Van Baelen, and Y. Pointin, “Identification of convective and stratiform areas towards improved precipitation estimation with a local area X-band radar,” in Proc. of the 6th European Conf. on Radar in Meteorology and Hydrology, Sibiu, 2010, pp. 219-225.
[3] J. Simpson, R. F. Adler, and G. North, “A proposed tropical rainfall measurement mission (TRMM) satellite,” Bull. Am.Meteorol, vol. 69, pp. 278-295, Mar. 1998.
[4] N. E. Anagnostou, “A convective/stratiform precipitation classification algorithm for volume scanning weather radar observations,” Meteorological Applications, vol. 11, no. 4, pp.291-300, 2004.
[5] F. Mesnard, O. Pujol, H. Sauvageot, C. Costes, N. Bon, and J.Artis, “Discrimination between convective and stratiform precipitation in radar-observed rainfield using fuzzy logic,”presented at the 5th European Conf. on Radar in meteorology and Hydrology, Helsinki, 2008.
[6] C. W. Ulbrich and D. Atlas, “On the separation of tropical convective and stratiform rains,” Journal of Applied Meteorology, vol. 41, no. 2, pp. 188-195, 2002.
[7] A. Nzeukou and H. Sauvageot, “Distribution of rainfall parameters near the coasts of France and Senegal,” Journal of Applied Meteorology, vol. 41, no. 1, pp. 69-82, 2002.
[8] H. Sauvageot and G. Despaux, “SANAGA: A digital acquisition and visualization of radar data for the validity of satellite precipitation estimates,” Standby Climate Satellite,vol. 31, no. 1, pp. 51-55, 1990.
[9] D. B. Wolff, D. A. Marks, E. Amitai, D. S. Silberstein, B., L.Fisher, A. Tokay, J. Wang, and J. L. Pippitt, “Ground validation for the tropical rainfall measurement mission(TRMM),” Journal of Atmos. Ocean. Tech., vol. 31, no. 1, pp.51-55, 2005.
[10] B. B. Mandelbrot, The Fractal Geometry of Nature, New York: W. H. Freeman and Company, 1983, pp. 45-47.
[11] K. I. Kilic and R. H. Abiyev, “Exploiting the synergy between fractal dimension and lacunarity for improved texture recognition,” Signal Processing, vol. 91, no. 10, pp.2332-2344, 2011.
[12] S. Lovejoy and D. Schertzer, “Multifractals, Universality classes and satellite and radar measurement of cloud and rain fields,” Journal of Geophysical Research, vol. 95, pp.2021-2034, Feb. 1990.
[13] K. Falconer, Fractal Geometry. Mathematical Foundations and Applications, Chichester: John Wiley & Sons, 1990, pp.288.
[14] C. Allain and M. Cloitre, “Characterizing the lacunarity of random and deterministic fractal sets,” Physical Review A,vol. 44, pp. 3552-3558, Sep. 1991.
[15] D. Schertzer and S. Lovejoy, “Hard and soft multifractal processes,” Physical Review A, vol. 185, pp. 187-194, Jun.1992.
[16] A. Zaia, R. Eleonori, P. Maponi, R. Rossi, and R. Murri,“Medical imaging and osteoporosis: fractal’s lacunarity analysis of trabecular bone in MR images,” in Proc. of the 18th IEEE Symposium on Computer-Based Medical Systems,Dublin, 2005, pp. 1063-7125.
[17] B. Olalla, “Analysis of the basic dispersion and overall mechanisms of mineral fillers in polymers: influence the rheology and structure of the matrix,” Ph.D. dissertation,Jean Monnet University, Saint Etienne, France, 2010.
 Journal of Electronic Science and Technology2014年2期
- Journal of Electronic Science and Technology的其它文章
- Genomic Islands Prediction and Analysis in Cyanobacteira by Bioinfomatics
- Retrieval of High Resolution Satellite Images Using Texture Features
- Perfect Reconstructable Decimated One-Dimensional Empirical Mode Decomposition Filter Banks
- Adaptive Fourier Decomposition Based Time-Frequency Analysis
- Call for Papers Journal of Electronic Science and Technology Special Section on Special Section on Energy-Efficient Technologies
- Journal of Electronic Science and Technology Information for Authors
