
Comprehensive Evaluation of the Economic Development Level of Guanzhong-Tianshui Economic Zone Using Principal Component Cluster Analysis
2014-04-10 06:56:27ChunxiangZHAOXinrongYANXuGUO
Asian Agricultural Research 2014年2期
Chunxiang ZHAO,Xinrong YAN,Xu GUO
College of Science,Engineering University of CAPF,Xi'an 710086,China
In June 2009,the National Development and Reform Commission issued Guanzhong-Tianshui Economic Zone Development Plan,bringing a new development opportunity for Shaanxi and Gansu.Guanzhong-Tianshui Economic Zone includes Xi'an City,Tongchuan City,Baoji City,Xianyang City,Weinan City,Shangluo City(some districts and counties)and Yangling Demonstration Zone in Shaanxi Province,and the administrative regions under the jurisdiction of Tianshui City,Gansu Province,covering80 000 square kilometers.At the end of 2010,the permanent population was 28.107 million.The directly involved regions include Hanzhong and Ankang in southern Shaanxi,Yan'an and Yulin in northern Shaanxi,Pingliang,and Qingyang in Gansu.
Guanzhong-Tianshui Economic Zone,located in the center of the Eurasian Continental Bridge,at the strategic point connecting east and west,north and south,is the region with a good economic foundation,superior natural conditions,long human history and great development potential in China's western regions.Du Yueping[1]made a comprehensive and systematic analysis of development of Guanzhong-Tianshui Economic Zone,and he proposed that it was necessary to seize the opportunity,work hard,and make every effort to build Xi'an into an international metropolis.Yan Xinrong[2]discussed on how to change the mode of economic development.In this paper,using the principal component cluster analysis method,we carry out statistical analysis of the economic development level.
Regional economy is a comprehensive geographical concept of economic development,and also a comprehensive economic concept arising from the interaction between internal factors of economic development and external conditions in a certain area.It is restricted and influenced by the natural conditions,development and utilization of resources,socio-economic conditions,economic policies,and many other factors in the region.Regional economic development not only means the expansion of the size of the region's national economy,but also means the improvement of economic and social living standards.The regional economic effects are not merely reflected in the economic indicators,and there is a need to consider the overall social economic benefits and regional ecological benefits.Therefore,the study of economic development is of very important significance to the future development.
1 Data collection[3-4]
Xi'an City administers 13 districts and counties,and the differences in the resource endowments between regions lead to great disparities the economic development.In order to scientifically,objectively,accurately and reasonably measure the level of economic development of the district and county,according to the status of economic development in Xi'an City,this article selects seven key indicators that reflect the economic situation,and establishes the corresponding evaluation system.
The specific indicators are as follows:per capita GNP(X1),the indicator reflecting the level of economic growth;per capita total industrial output value(X2);per capita total agricultural output value(X3);per capita total tertiary industry output value(X4);per capita revenue(X5),the indicator reflecting the government's financial strength;total retail sales of social consumer goods(X6),the indicator reflecting the level of social purchasing power;fixed asset investment(X7),the indicator reflecting the level of investment.
According to the total amount of economic indicators and population in the districts and counties of Xi'an City,we calculate the above indicators,as shown in Table 1.
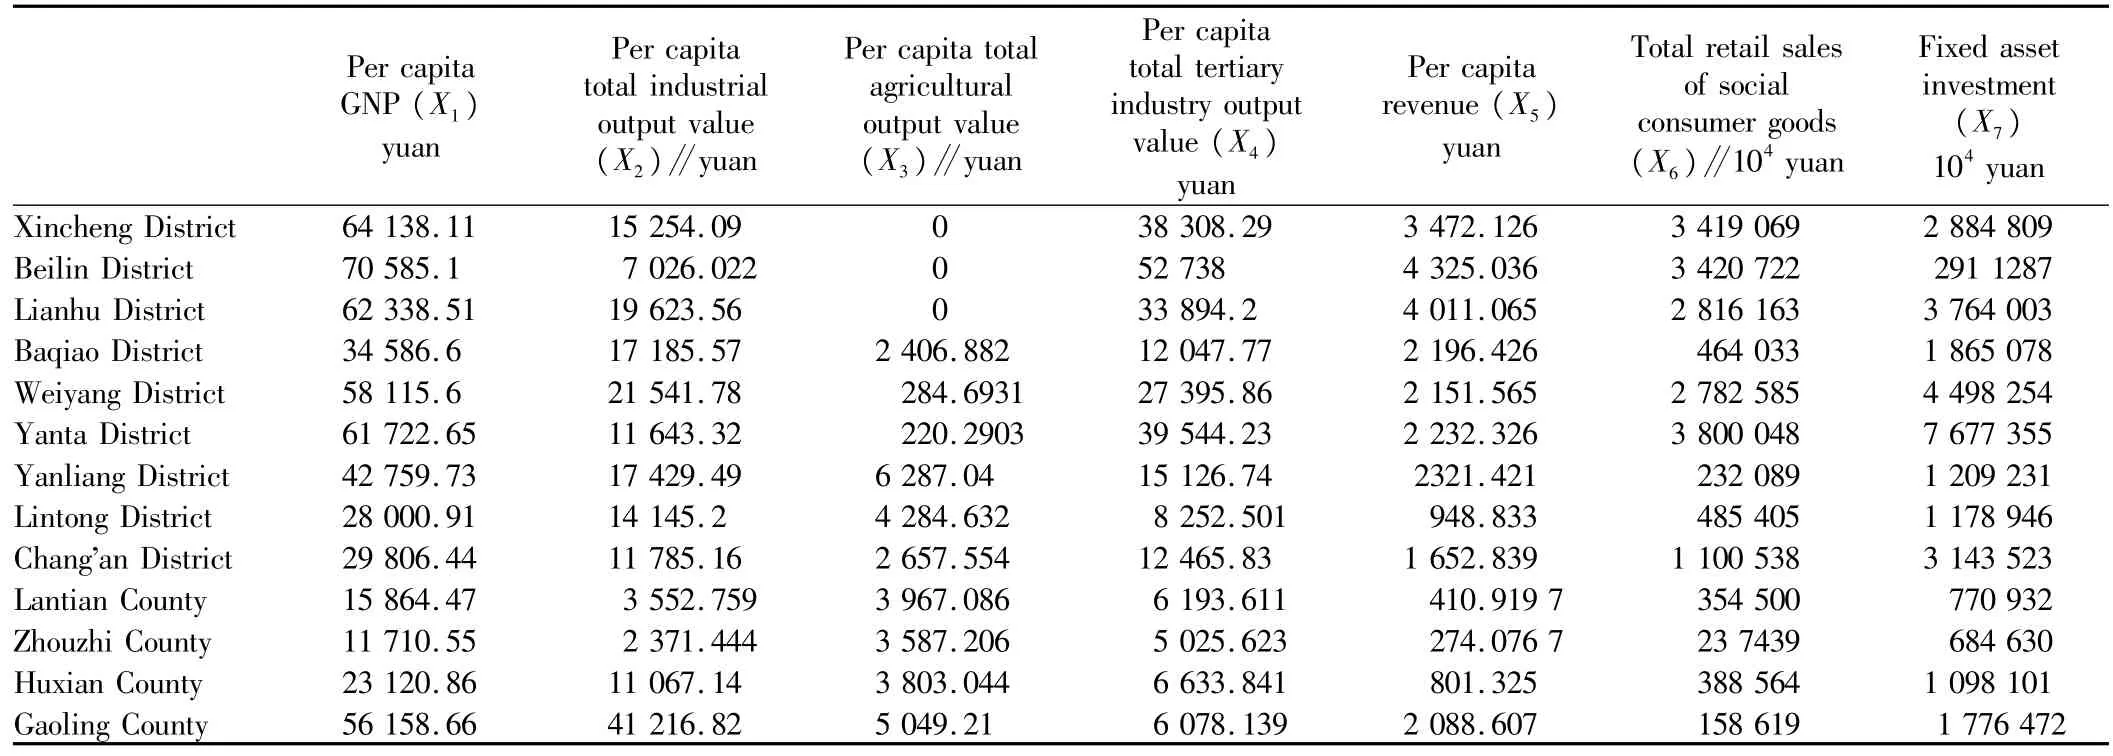
Table 1 The major economic indicators for 13 districts and counties of Xi'an City in 2011
2 Evaluation methods
Due to differences in resource endowments between the districts and counties,there are great differences in the economic development,and also in the rate of contribution to overall economic development of Xi'an.In order to objectively and comprehensively understand the specific circumstance of economic development in the districts and counties of Xi'an City to identify the degree of difference between them,this articlewill use both principal component analysis and cluster analysis.
Using the principal component analysis,the principal component scores are calculated,and the economic development of cities is reflected by the scores;using the cluster analysis to divide the 13 cities into several categories,the appropriate countermeasures are proposed according to their respective economic development level and geographical location.
Principal component analysis(PCA)[5-6],proposed by Hotelling in 1933,is a statistical procedure that uses orthogonal transformation to convert a set of observations of possibly correlated variables into a set of values of linearly uncorrelated variables called principal components.The number of principal components is less than or equal to the number of original variables.This transformation is defined in such away that the first principal component has the largest possible variance(that is,accounts for as much of the variability in the data as possible),and each succeeding component in turn has the highest variance possible under the constraint that it be orthogonal to(i.e.,uncorrelated with)the preceding components.Principal components are guaranteed to be independent if the data set is jointly normally distributed.PCA is sensitive to the relative scaling of the original variables.
Hierarchical clustering[5-6]is a method of cluster analysis which seeks to build a hierarchy of clusters.Strategies for hierarchical clustering generally fall into two types:Agglomerative:This is a"bottom up"approach:each observation starts in its own cluster,and pairs of clusters are merged as one moves up the hierarchy.Divisive:This is a"top down"approach:all observations start in one cluster,and splits are performed recursively as one moves down the hierarchy.In general,the merges and splits are determined in a greedy manner.The results of hierarchical clustering are usually presented in a dendrogram.Hierarchical clustering has the distinct advantage that any valid measure of distance can be used.In fact,the observations themselves are not required:all that is used is a matrix of distances.
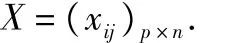
2.1The evaluation process using principal component analysis Assuming there are P observation objects,each with n indicators,the raw data of n indicators are derived as follows:
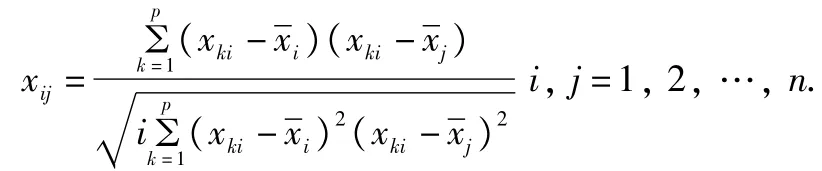
(i)Standardization of raw data.In order to make the comprehensive evaluation results objective and reasonable,it is necessary to eliminate the impact of dimension and magnitude.The standardization processing is commonly used:

(ii)Calculation of correlation coefficient matrix of indicator sample.

where rijis the correlation coefficient between indicator xiand indicator xj.
(iii)Calculation of eigenvalues and eigenvectors of the correlation coefficient matrix.The eigenvalues and eigenvectors of the correlation coefficient matrix are calculated.n eigenvalues of R are denoted asλ1≥λ2≥…≥λn≥0,and the corresponding eigenvectors are as follows:

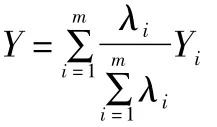
(iv)Calculation of the contribution rate of eigenvalues and extraction of principal component in accordance with the criterion of cumulative contribution rate.When the cumulative contribution rate of variance reaches85%,the first m principal components are taken:

(v)Calculation of comprehensive evaluation values based on multi-indicator and weighted comprehensive evaluation model.The weighted sum of m principal components is calculated to get the final evaluation value,and the weight is the variance contribution rate of each principal component.
2.2Principal component analysis According to the data in Table1,using SPSS software[7],we can derive the correlation coefficient matrix of X1,X2,X3,X4,X5,X6and X7as follows:

The eigenvalues,contribution rate and cumulative contribution rate of the correlation matrix R is shown in Table 2.
From the above table,we can find that when the number of principal component is2,the cumulative contribution rate reaches 88.01% (>85%),containing the vast majority of the needed information.Two principal components will be enough,so here we take the first two as the first principal component and second principal component,respectively.
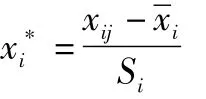
The original value of each indicator is standardized:
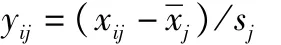

Table 2 Eigenvalues and contribution rate

Table 3 The standardized matrix

Table 4 Factor loading matrix

Table 5 Principal component eigenvectors
From the factor loading matrix,we know that the standardized eigenvector corresponding to the eigenvalue of R is(j=1,2,)in the column j of this matrix.

Assuming Y1and Y2represent the first principal component and second principal component,then:
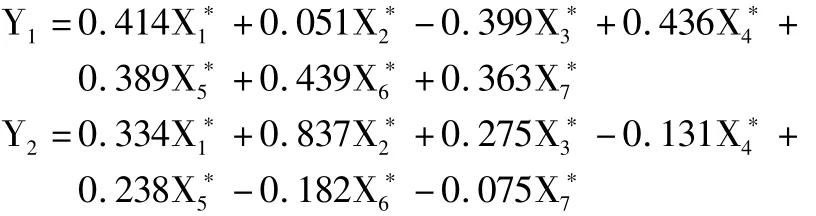
The first principal component Y1is mainly determined by X1,X3,X4,X5,X6,X7,and their coefficients are much larger than the coefficients of the other variables.Y1,is the integrated expression of X1,X3,X4,X5,X6,X7.F2is mainly determined by X2,so the second principal component Y2mainly reflects the industrial sector.
Thus,each principal component has a particular substantive significance.From two perspectives,two principal components reflect the economic development level of the districts and counties,so it is appropriate to use them to analyze and assess the economic development level of the districts and counties.After the score of principal components is calculated,then it is multiplied by the variance contribution rate of principal component,thereby we get the composite score for each city:
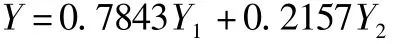
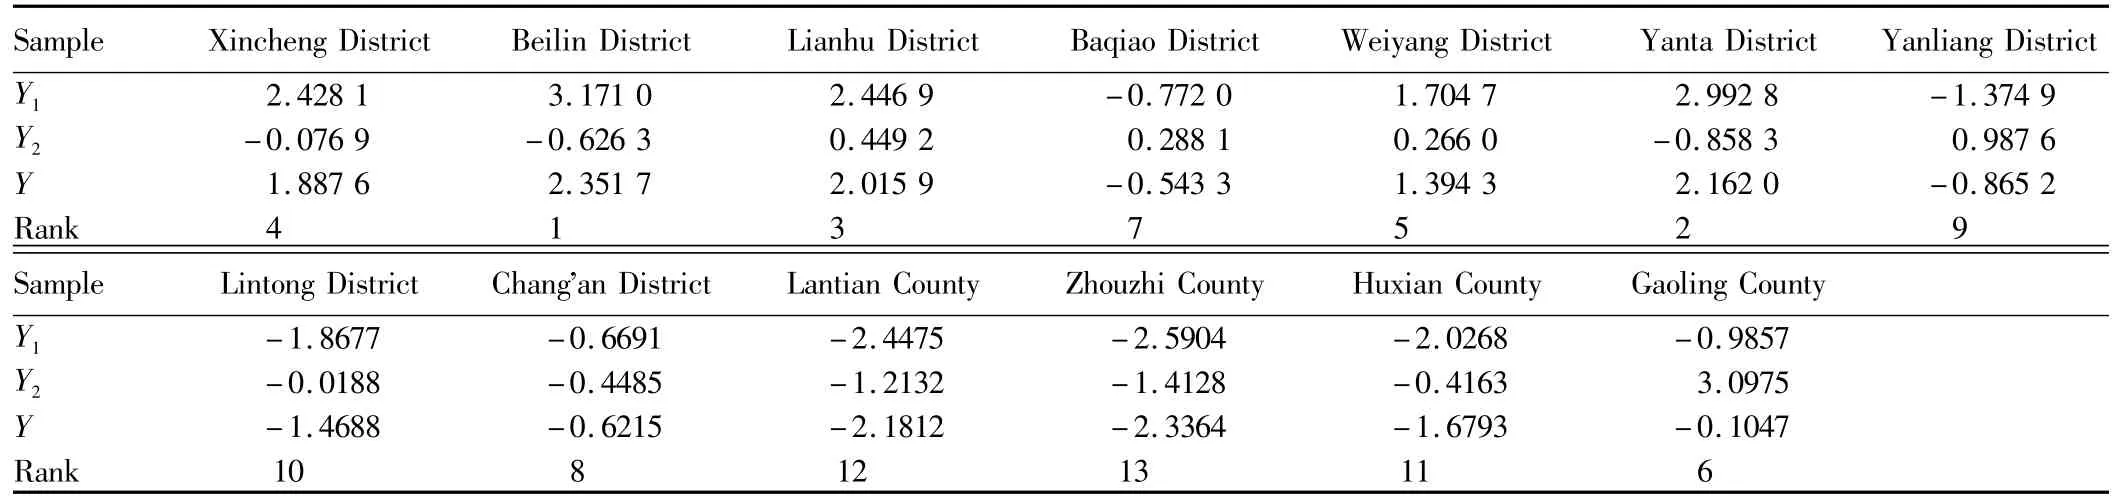
Table 6 Principal component scores and ranking
Based on the weighted composite value Y,we derive the ranking of economic development indicators of 13 districts and counties in the whole city.No.1 is Beilin District,No.2 is Yanta District,and No.3 is Lianhu District.The development scale of the tertiary industry in these areas is large,occupying a large proportion of the entire national economy,thus ranking forward.Zhouzhi County,Lantian County and Huxian County have no advantages in this area,so they rank behind.
2.3Cluster analysis According to the component scores of principal component,we carry out cluster analysis of the regions,and divide the 13 districts and counties of Xi'an City into three categories.
The first category:Yanta District,Beilin District,Weiyang District,Xincheng District and Lianhu District;The second category: Gaoling County, Yanliang District, Baqiao District,Chang'an District;The third category:Lantian County,Zhouzhi County,Lintong District,Huxian County(Fig.1).

Fig.1 Cluster analysis of the regions
The first category is the inner city of Xi'an;the second category is the north and south of Xi'an City;the third category is the east and west of Xi'an City.The inner city is developed rapidly,with high economic level,and especially the tertiary industry is booming,followed by urban north and south;east and west of city are lagging behind.For the districts in the first category,the per capita total agricultural output value is 100.82 yuan;for the districts in the third category,the per capita total agricultural output value is 3910.25 yuan,indicating that in the economically backward areas,there are more people engaged in agriculture,and the development of industry and tertiary industry is relatively backward.Thus,it can be seen that there are great differences in the economic development level between the regions of Xi'an City.How to bridge this gap?The development of secondary and tertiary industries is backward in the economically backward areas,so there is a need to vigorously develop industry and tertiary industry,and accelerate urbanization.The more developed regions can give technical help to backward areas,and the backward areas can also provide the labor resources needed by the developed regions.
3 Conclusions and recommendations
In this paper,using principal component analysis and cluster analysis,we carry out comprehensive evaluation analysis of the economic development level of 13 districts and counties of Xi'an City.The results of these two analyses are basically the same,and the results show that there are great differences in the economic development level between the regions of Xi'an.Yanta District,Beilin District,Weiyang District,Xincheng District and Lianhu District are the center of Xi'an City.They should give full play to their advantages in science,education,commerce and industry,focus on developing high-tech industries and equipment manufacturing to constantly improve the city's service function,and strive to keep the economic development ahead.The development of secondary developing high-tech industries and equipment manufacturing to constantly improve the city's service function,and strive to keep the economic development ahead.The development of secondary and tertiary industries is balanced in Gaoling County,Yanliang District,Baqiao District and Chang'an District,so the overall economic strength is also great.They should give full play to their strengths to make the central city facilities serve Chang'an and Gaoling,speed up the construction of Chang'an Aerospace Industrial Base,Jinghe Industrial Park,Yanliang Aviation Industrial Base,and take active support policies and measures,to promote a new round of rapid development of the economy.The secondary and tertiary industries are underdeveloped in Lantian County,Zhouzhi County,Lintong District,and Huxian County.Based on their own characteristics,they should rely on the industrial park,undertake the relocation of the central city businesses,and form"supporting industry+featured agriculture"functional area by providing support services for large enterprises.In summary,it is reasonable to use principal component analysis and cluster analysis to carry out comprehensive evaluation of the overall economic strength of districts and counties in Xi'an City.In fact,it is also consistent with the actual situation of Xi'an.Through the division of the economic conditions of 13 districts and counties,it provides data support for further economic development and policy establishment in Xi'an City.
[1]DU YP,ZHAOW,DENG JR.The development of Western Chinese and Guanzhong-Tianshui Economic Region[M].Xidian University Press,2012.(in Chinese).
[2]YAN XR.Study on economic development pattern of Guanzhong-Tianshui Economic Region[J].Journal of Guizhou College of Finance and Economics,2013:58-59(in Chinese).
[3]DING YX,ZHANG XG.Shaanxi statistical yearbook,2012[M].Shaanxi Statistics Press,2012.(in Chinese).
[4]ZHANG XG,CHEN B.Statistical yearbook of Guanzhong-Tianshui Economic Region[M].Shaanxi Provincial Bureau of Statistics,2012.(in Chinese).
[5]WU Y,LIYL,HUQJ.Applied mathematical statistics[M].National University of Defense Technology Publish House,2008.(in Chinese).
[6]XUE Y,CHEN LP.Statistical modeling and R software[M].Beijing:Tsinghua University Press,2012.(in Chinese).
[7]YU JY,HEXH.Data statistics analysis and SPSS application[M].Beijing:Posts&Telecom Press,2003.(in Chinese).
 Asian Agricultural Research2014年2期
- Asian Agricultural Research的其它文章
- Training and Recommendations on the Lower Limbs Exp losive Force of Juvenile Amateur M en Sprinters
- Efficiency Evaluation of Vegetable Specialized Cooperatives Based on Data of Chongqing Municipality
- Effects of Soil C/N Ratio on Apple Grow th and Nitrogen Utilization,Residue and Loss
- Drought and Waterlogging Characteristics during the Grow th Period of Summer Maize in Luxi Plain Areas
- Model for Predicting Climatic Yield of Sugarcane in Nanning City
- Assessment of Cultivation M ethod for Energy Beet Based on LCA Method