
Genetic characterization and linkage disequilibrium mapping of resistance to gray leaf spot in maize(Zea mays L.)
2014-03-13 05:51:24LiyuShiXinglingLvJinfengWengHnyongZhuChnglinLiuZhunfngHoYuZhouDeguiZhngMingshunLiXiokeCiXinhiLiShihungZhng
The Crop Journal 2014年1期
Liyu Shi,Xingling Lv,Jinfeng Weng,Hnyong Zhu,Chnglin Liu,Zhunfng Ho,Yu Zhou,Degui Zhng,Mingshun Li,Xioke Ci,Xinhi Li,*,Shihung Zhng,**
aNational Key Facility of Crop Gene Resources and Genetic Improvement,Institute of Crop Science,Chinese Academy of Agricultural Sciences,Beijing 100081,China
bCollege of Agronomy,Shenyang Agricultural University,Shenyang,Liaoning 110161,China
cWenshan Academy of Agricultural Sciences,Wenshan,Yunnan 663000,China
1.Introduction
Gray leaf spot(GLS)of maize(Zea mays L.),caused by the fungal pathogen Cercospora zeae-maydis [1],is an environmentally sensitive foliar disease requiring high humidity and moderate temperatures[2].In diseased leaves,gray to tan rectangular spots(5 mm to 70 mm long by 2 mm to 4 mm wide)run parallel to the leaf veins.Upon further expansion of lesions,the spots coalesce and the entire leaves become blighted.Stalk deterioration and severe lodging[3]can result in 20%to 60%loss of grain yield,even as high as 100% loss during severe epiphytotics [4].GLS has become a major economic concern in many maize-growing regions,both in China and worldwide [3,5–8].Currently,host resistance is expected to be the most cost-effective,efficient,and acceptable method for controlling GLS [3,7,9].However,most maize germplasm that has been assessed is highly susceptible to Cercospora zeae-maydis,with very little resistant germplasm identified to date from tropical or subtropical maize[6,10].Thus,it is of increasing concern to identify and deploy heritable resistance to GLS.Development of molecular markers closely linked to underlying genes or quantitative trait loci(QTL)for the trait and their application in marker-assisted selection(MAS)can enhance the efficiency of breeding activities in general [11,12],and for disease resistance in particular.
Reports have shown that GLS resistance is quantitatively inherited and is controlled primarily by additive gene action[12–14].Many QTL underlying GLS resistance have been identified across the 10 maize chromosomes in various mapping populations [9,12,15–20].An integrated QTL map for GLS resistance in maize was constructed by compiling 57 QTL from previous studies using different mapping populations,from which 26“real” QTL or meta-QTL (consensus QTL obtained by metaanalysis) were identified across maize chromosomes using meta-analysis approaches [8].Furthermore,a major QTL on chromosome 8 was fine-mapped to a 1.4-Mb interval using a segregating population from the cross between a resistant inbred,Y32,and a susceptible line,Q11[4].However,no QTL for GLS resistance has been cloned to date.Moreover,because GLS resistance is genetically complex and strongly influenced by environment [12,20],genetic information derived from biparental mapping populations that can be used for plant improvement has been very limited.Often,either quantitative information for traits that display simple inheritance,or QTL explaining a substantial portion of phenotypic variation,can be employed in MAS[21].
As an alternative to overcome some of the limitations of biparental mapping,association mapping in current breeding germplasm may lead to more effective marker strategies for crop improvement[22,23],with higher resolution and greater capacity for identifying favorable genetic loci responsible for traits of interest [24,25].To date,association mapping has been used successfully to identify QTL or genes for the most prevalent diseases in maize at the whole-genome level,including Southern corn leaf blight[26],Northern corn leaf blight[27],and head smut [28].However,a genome-wide association study (GWAS)for GLS resistance has not yet been reported with Chinese maize germplasm.Accordingly,the objectives in this study were to(1)assess phenotypic variation among 161 Chinese maize inbred lines under artificial inoculation with a propagule suspension,(2)identify genetic loci conferring GLS resistance by performing a genome-wide association study of GLS resistance using 41,101 SNP markers in the population,and(3)identify candidate genes for GLS resistance.The results obtained here will help to drive the breeding process towards improvement of GLS resistance.
2.Materials and methods
2.1.Plant materials and field trials
An association mapping panel with 161 Chinese maize inbred lines was planted in a plant pathology nursery at Shenyang,Liaoning Province,China (41.48° N,123.25° E),in 2010 and 2011,using complete randomized blocks with two replicates.Each plot was planted in single rows,0.67 m apart and 4.5 m long,with a total of 20 plants per row.Among these lines,the inbred lines Shen 137 and Dan 340 were used as resistant and susceptible controls,respectively[15].
2.2.Phenotypic evaluation for resistance to GLS and statistical analysis
The association mapping panel was artificially inoculated during the bugle stage (V9–V11 developmental stage) with a 10-mL propagule suspension containing 2.5 × 10⁴conidia following the method of Dong et al.[10].During the maize milky maturity stage,the disease reaction on each plant was scored on a scale with five levels (G1,G3,G5,G7,and G9) that represent the percentage of the infected foliar area (PIFA) as follows:G1 ≤5%PIFA and absence of symptoms;G3 = 6%–10%PIFA with few and sparse lesions;G5 = 11%–30%PIFA with lesions reaching the ear leaf and a few lesions occurring on the leaves above the ear;G7 = 31%–70% PIFA with lesions reaching the leaves above the ear; G9 ≥71% PIFA with premature plant death before physiological maturity(black layer formation in kernels)[4,10].
GLS resistance was evaluated by PIFA for all plants in each row and the average score for the row comprised the phenotypic data.All the phenotypic data collected in 2010 and 2011 were summarized as percentages (e.g.PIFA).An arcsine transformation was performed and statistical tests were conducted using Statistical Analysis System (SAS) software [29].A PROC UNIVARIATE normal plot was used to test whether the data was normally distributed.A standard analysis of variance(ANOVA)was performed using PROC GLM to determine variation in disease response.The general linear model procedure was used to analyze the effects of environments,block,inbred lines,and the interactions between these factors.Estimates of the variance components associated with all model terms were calculated using the PROC MIXED option.Heritabilities(h2)of GLS resistance were calculated as a ratio of the estimated genetic variance to the phenotypic variance of a population mean using the formula described by Hallauer and Miranda[30]:
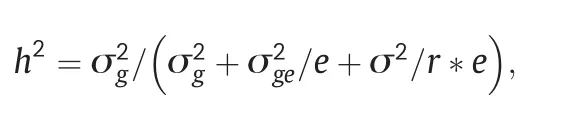
where σ2g,σ2ge,and σ2are estimates of genotypic,genotype × environment interaction and error variances,and e and r are the numbers of environments and replications per environment,respectively.Spearman's rank correlations for GLS resistance with PIFA for these 2 years were calculated using SAS software[29].
2.3.Genotyping with SNPs and SNP filtering
DNA from each of the panel lines was extracted using a modified CTAB extraction procedure[31],and DNA quality for each sample was carefully checked using electrophoresis and a spectrophotometer (Nanodrop 2000,Thermo Scientific).These lines were genotyped with 56,110 evenly spaced SNP markers and 984 negative controls,selected from several public and private sources (Illumina,Inc.),covering the entire maize genome according to the B73 genome reference sequence.SNP genotyping was performed using the MaizeSNP50 BeadChip processed by Emei Tongde (Beijing).A total of 41,101 SNPs were selected by filtering with stringent quality criteria for further analysis[32].
2.4.Genotype–phenotype association mapping
The extent of linkage disequilibrium(LD)was characterized using HAPLOVIEW v4.0 [33].Population structure and kinship information for the lines in the panel were estimated with a mixed linear model using the software STRUCTURE version 2.3 [34] and 4000 SNPs (minor allele frequency (MAF) ≥0.2).STRUCTURE was run three times with 500,000 burn-in iterations followed by 500,000 MCMC(Markov chain Monte Carlo) iterations to test for the presence of five genotypic subgroups(K = 5),as determined in a previous study [35].The panel was classified into five genotypic subgroups:PB(inbred lines derived from modern U.S.hybrids in China),Lan(Lancaster Sure Crop),LRC(Lvda Red Cob,a Chinese landrace and its derivatives),SPT(Si-ping-tou,a Chinese landrace and its derivatives),and Mixed (inbred lines derived from modern US hybrids in China and Reid group).Because GLS resistance in the PB subgroup differed significantly from the other subgroups,lines belonging to the PB group could be eliminated from the panel of 161 Chinese maize inbred lines and used to form a new panel for mapping.As a result,a total of four sets of data,respectively designated as E1a,E1b,E2a,and E2b (i.e.,2010(161),2010(135),2011(161),and 2011(135),respectively) were used to identify SNPs significantly associated with GLS resistance.
The mixed linear model (MLM) implemented in the TASSEL program version 3.0[36]was used for a genome-wide scan of loci governing resistance to GLS with 41,101 SNPs(MAF ≥0.05),and SNPs with P ≤0.001 were declared to be significantly associated with GLS resistance.
To compare linkage mapping with association mapping of GLS resistance,significant marker information in the same linkage group was converted into QTL information in reference to a report of 2011[37].These QTL,together with QTL previously reported in biparental mapping populations,were then integrated with the genetic map IBM Neighbors 2008,following Shi et al.[8]
2.5.Candidate gene analysis
(1) Significant SNPs that were repeatedly detected in different experiments (herein,E1a,E1b,E2a,and E2b were regarded as different experiments) were selected to identify candidate genes underlying GLS resistance.(2) To scan for potential genes within a sequence region containing consensus significant SNPs,the 60-bp source sequences of these “consensus”significant SNPs were used to perform nucleotide BLAST searches against the B73 RefGen_v2 (MGSC) (http://blast.maizegdb.org/home.php?a=BLAST_UI).Local LD blocks that contained consensus significant SNPs were selected as target sequence regions to scan for potential genes,using the GenScan web server at http://genes.mit.edu/GENSCAN.html.Local LD blocks were defined by the confidence interval method of Gabriel et al.[38] using Haploview 4.0 [33].(3) To identify candidate genes for GLS resistance,predicted peptides of potential genes were used to search for conserved domains at the NCBI website http://www.ncbi.nlm.nih.gov/Structure/cdd/wrpsb.cgi.Genes with disease resistance-related annotations were evaluated as candidate genes for GLS resistance.
3.Results
3.1.Phenotypic variation for GLS resistance
The resistant control Shen 137 proved highly resistant to GLS,with average scores of grade 3 (G3) in 2010 and G1 in 2011,respectively,whereas the susceptible line Dan 340 was highly susceptible to GLS and was rated as G9 in both years (Fig.1-A),indicating an appropriate level of inoculation in this study.The significant (P <0.0001) correlation (R2= 0.864) (Table 1) between the phenotypic data among the 2 years indicated that GLS resistance among these 161 lines was highly consistent across years.A quantitative distribution of the phenotypes among 161 lines in each year(Fig.1-A)suggests that maize resistance to GLS is quantitatively inherited.The genotypic variances among 161 lines were highly significant (P <0.0001) in each year,and the broad-sense heritability of GLS resistance was 0.88 (Table 1),revealing the presence of predominantly genetically controlled resistance in this panel.
Phenotypic differences in the GLS PIFA among these five subgroups were extremely significant (P <0.0001).The PB subgroup,with the lowest PIFA,exhibited the most resistance to GLS(Fig.1-B),and differed significantly from the other subgroups according to the Student–Newman–Keuls multiple range test(SNK) (Fig.1-B),suggesting either that the resistance genes originate from the PB subgroup,or that more genetic information about GLS resistance is available in the PB subgroup,and that fitting population structure and kinship matrix information into the model is necessary for association mapping of this trait.
3.2.Genome-wide association study of GLS resistance
In these four experiments,a total of 51 SNPs across 10 chromosomes were significantly associated with PIFA(P <0.001) (Fig.2; Table 2).Given that some significant SNPs fell into LD blocks (Table 2),38 polymorphic sites (including six singleton loci)were actually identified,and were allocated to 31 QTL regions across all maize chromosomes.These polymorphisms were named using prefix “qGLS” plus the chromosome bin identifier number(Table 2).
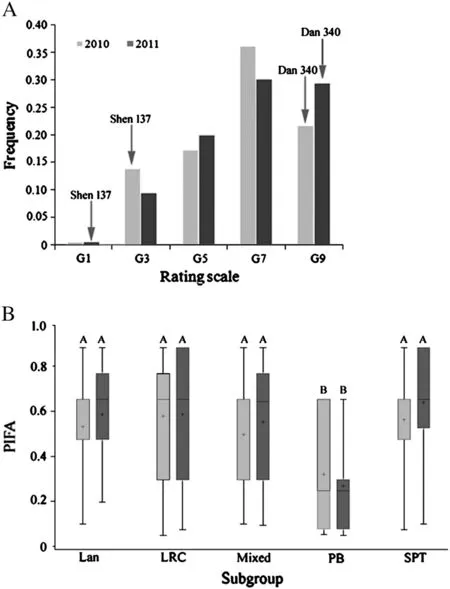
Fig.1-Distribution of GLS resistance in this maize diversity panel.A:Distribution of average GLSPIFA across two environments for 161 maize inbred lines;B:Phenotypic variation in GLS resistance within each of five maize subgroups.
Four of the 31 QTL,including qGLS3.01,qGLS4.11,qGLS7.03-1,and qGLS10.05,were detected in three experiments(Table 2).In two experiments,nine QTL were detected(Fig.2;Table 2),among which qGLS1.01(i.e.SYN200081)was detected in E1b and E2b(i.e.experiments using inbred lines,excluding those from the PB subgroup) (Fig.2-A,B),suggesting either that favorable allelic variation was not available in the PB subgroup,or that the frequency of favorable alleles in the PB subgroup was too low to be detected.In addition,qGLS7.02 was detected only in E1(including E1a and E1b)(Fig.2-C,D),while other QTL,including qGLS1.05,qGLS3.05,qGLS3.07,qGLS5.05,qGLS8.01,and qGLS9.07,were detected only in E2(including E2a and E2b).
3.3.Candidate gene analysis
Sixteen significant SNPs that were repeatedly detected were selected to identify candidate genes underlying GLS resistance(Table 2).Three candidate genes,designated as GLScgcb03071,GLScgcb03072,and GLScgcb0907,in chromosome bins 3.07 and 9.07were identified as conferring GLS resistance(Fig.3).
Among these candidates,GLScgcb03071 is a coiled-coil (CC)domain-containing protein whose genomic-sequence is separated from the significant SNP PZE-103142893 in bin 3.07 by a physical interval of 8.6 kb.The other candidate gene in chromosome bin 3.07,GLScgcb03072,which contains a serine/threonine kinase (STK) catalytic region,harbored the significant SNP PZE-103142893.Interestingly,this SNP occurred in the fourth exon of GLScgcb03072.The third candidate gene,GLScgcb0907,was identified by its co-location with the significant SNP PZE-109119001 in chromosome bin 9.07 (Fig.3).Its protein sequence homolog from Ricinus communis is a virion-binding protein.Notably,some proteins with such conserved domains have been shown to be directly or indirectly involved in the detection of pathogen effectors and activation of defense signal transduction by plants.
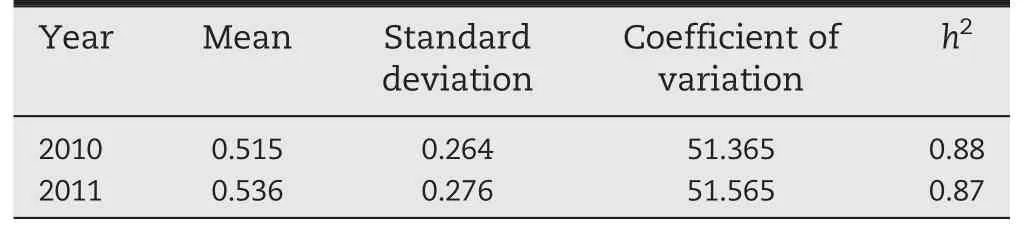
Table 1-Statistics for GLS severity evaluated in 161 maize inbred lines during 2010 and 2011 growing seasons.
4.Discussion
4.1.Relevant parameters to GWAS in the study
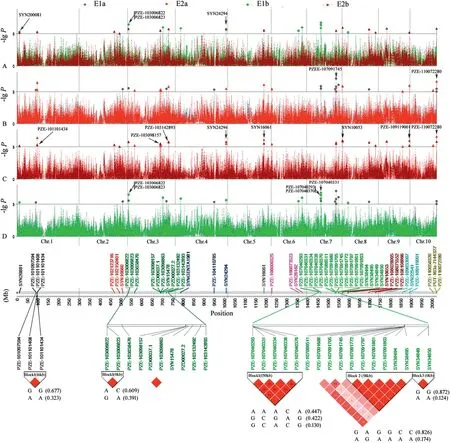
Fig.2-Pairwise comparison of GWAS of GLS resistance with a mixed linear model in different trials.E1 and E2 represent experiments of 2010 and 2011,respectively;the letters a and b indicate the different population sizes and compositions(“a”represents the panel including the PB group,and “b” represents the panel excluding the PB group).Markers on different chromosomes are indicated by different colors,and chromosomes 1 to 10 are shown in order from left to right.At the bottom of the graphic,LD patterns are shown for multiple SNPs found to associate with GLS resistance in certain genomic regions,and their haplotypes.
Sample size has been one of the most critical influences on the power of GWAS to detect genes[39].In this study,we used a total of 161 maize inbred lines originating in different corn planting regions in China,including the Northern Spring Corn Region,the Huang-Huai-Hai Summer Corn Region,and the Southwest Hilly Corn Region,which together comprise the Corn Belt of China[40].This panel of 161 Chinese maize inbred lines exhibited a high degree of phenotypic diversity,although only a minority of these lines (about 16%) were evaluated for resistance to GLS disease.Using this panel,51 SNPs significantly associated with GLS resistance (P <0.001) were identified.The P-value cutoff used in this study for GLS resistance(0.001)was not as strict as that(0.0001)imposed in other GWAS[27,32,37,41].However,the standard we applied has also been used in some studies[42–45].Moreover,in the present study,QTL for resistance to GLS that had been identified in biparental mapping populations were integrated with the genetic map IBM Neighbors 2008,as a reference criterion for distinguishing true from spurious associations.For example,Pozar et al.[17] identified a QTL for GLS resistance in bin 3.07 using near-isogenic lines derived from a cross between two inbred lines,MON323 and MON402,which was integrated with the genetic map IBM Neighbors 2008 in this study.As shown in Fig.4,in the present study,there was an overlapping region between the QTL and the local LD block that harbors the significant SNP PZE-103142893 in bin 3.07.Thus,we did not consider the association of SNP PZE-103142893 with GLS resistance to be spurious,despite its P-value(0.0003)greater than 0.0001.

Table 2-QTL/SNPs for PIFA identified in this study,using phenotypic information collected for 161 and 135 inbred lines tested in 2010 and 2011.
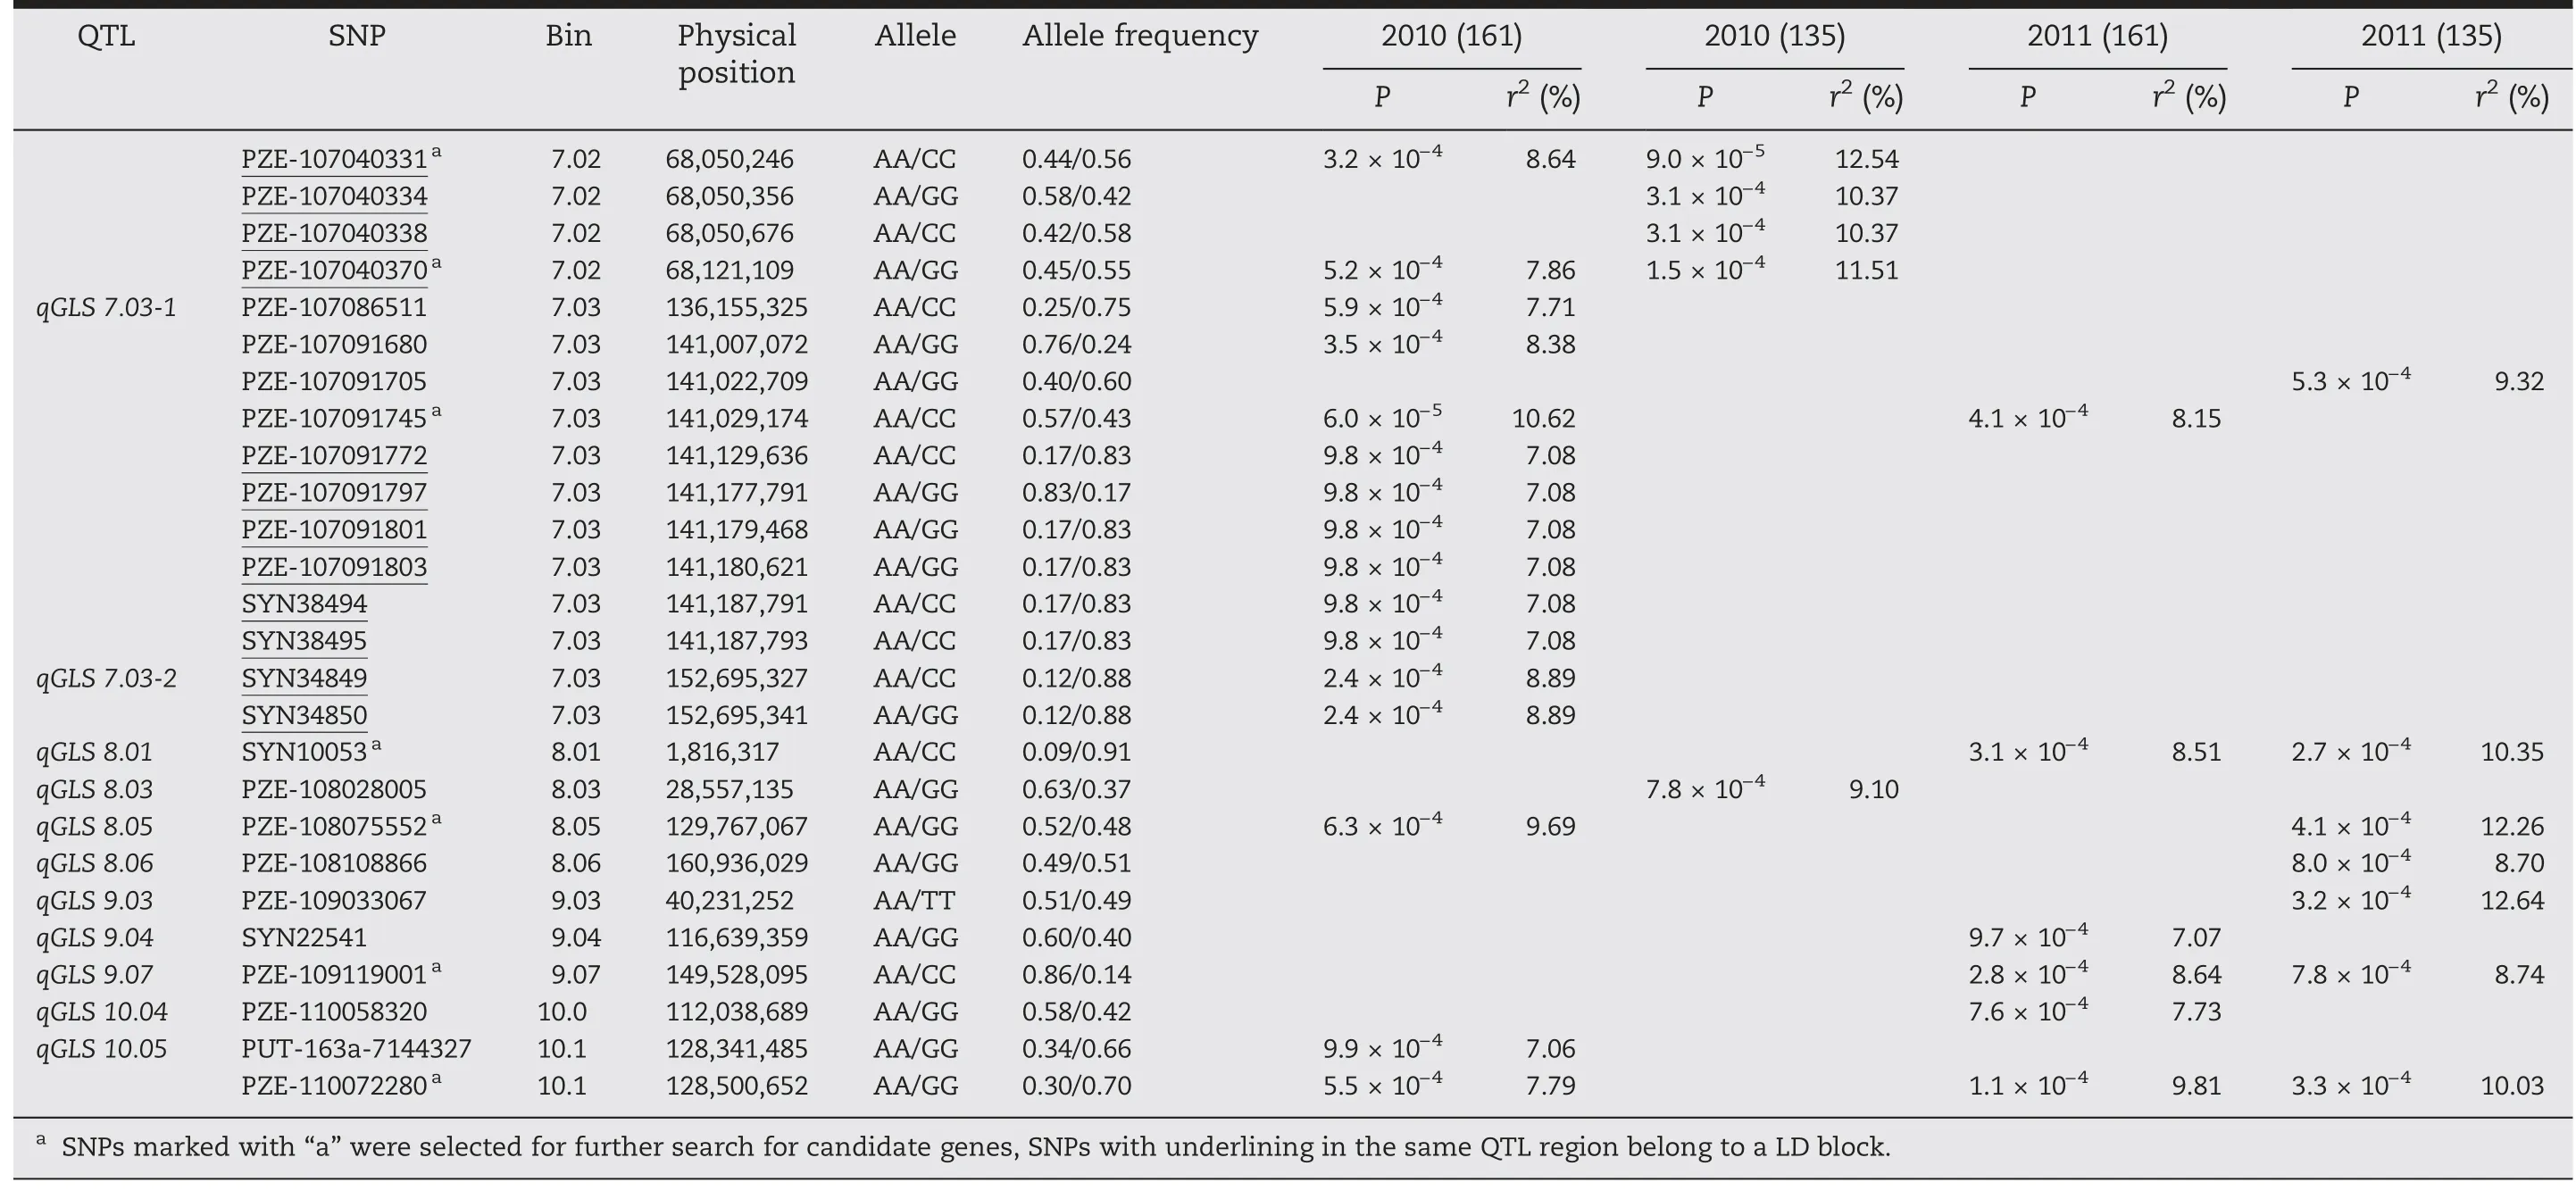
Table 2 (continued

Fig.3-Information about candidate genes derived from SNPs significantly associated with GLS resistance identified in this study.
Population structure is revealed by the presence of systematic differences in allele frequencies between subpopulations that may have arisen due to differences in ancestry,and that may lead to spurious allelic associations in association studies as a result of LD between alleles and nearby polymorphisms[46].To reduce these false associations,an MLM controlling for both population structure and relative kinship is usually used in association studies.In this model,population structure is fitted as a covariate that represents the proportional contribution from ancestor populations to each individual line[36].However,the use of different types of markers to characterize the structure of a population can result in different conclusions[47].SNPs are used to infer population structure; however,because most SNPs are relatively uninformative markers with only two alleles[48,49],only a small fraction of them are highly diagnostic of population structure [47,50].Increasing the number of SNPs can compensate for their low information content and enhance their power to detect population structure [48,50–52].Still,10,000 SNP simulations designed to estimate the power of sets of SNPs have identified incorrect numbers of subpopulations in a structure,owing to high proportions of simulated SNP loci with low minor allele frequencies(~20% singletons)[52].Upon filtering of singletons from SNP data sets(1000 SNPs,MAF >0.1),a better estimate of the number(or simulated number)of populations can be made.
In the present study,4000 SNPs distributed evenly across the entire maize genome,four times the number of SNPs(1000 SNPs)in the above mentioned simulation [52],were used to analyze the population stratification of 161 inbred lines.To eliminate the potential effects of a high proportion of SNPs with low MAF,these 4000 SNPs were selected to have MAF greater than 0.2.This threshold for selection of markers with normal allele frequencies has also been used in other studies[28,32].Using these 4000 SNPs with MAF ≥0.2,the 161 maize inbred lines in this study could be divided into five groups,including PB,Lan,LRC,SPT and Mixed,which were roughly consistent with their pedigrees.Similar conclusions about the number of distinct subgroups in this panel have been drawn in previous studies[35,53–56].For example,in 2012,a total set of 820 Chinese maize inbred lines was divided into five groups,using 40 core maize genome-wide SSRs developed for fingerprinting and uniformity analysis of Chinese maize varieties[35].In an earlier study,commonly used inbred lines that represent maize genetic diversity in China were also divisible into six groups,including PA,BSSS,PB,Lan,LRC,and SPT[57].But the close genetic relationship between PA and BSSS[58]and their overlapping geographical origins[56]suggest that it is reasonable and credible that only five groups were identified in our study.Moreover,the GLS resistance of maize inbred lines within the PB subgroup differed significantly from that of other subgroups (P <0.0001) (Fig.1-B).To define a population with more randomly distributed alleles for association mapping,26 inbred lines belonging to the PB subgroup were excluded from the association panel.However,for retaining germplasm diversity and also as a control,the PB subgroup was included as a separate association mapping population.A mixed linear model controlling population structure and kinship matrix was employed to minimize spurious associations.

Fig.4-QTL for GLS resistance identified in other studies using biparental mapping populations,compared with the QTL identified in this study using GWAS.
4.2.QTL identified by GWAS
Some QTL detected in this study,including qGLS2.07,qGLS3.04,qGLS3.05,qGLS3.06,qGLS3.07,qGLS4.04,qGLS5.05,qGLS6.05,qGLS7.02,qGLS7.03,qGLS8.06,and qGLS9.04 overlapped with QTL regions identified in previous studies using biparental mapping populations[8,15,17,18].However,some QTL regions relevant to GLS resistance are reported here for the first time,including qGLS1.01,which was detected in E1,and qGLS8.03,which was detected in E2(Fig.2;Table 2).This finding suggests that GWAS is a powerful approach not only for confirming previously described regions but also for identifying new regions associated with GLS resistance.
For all SNPs significantly associated with GLS resistance,the highest additive-effect estimate was only 0.59.Each of the QTL defined by these SNPs was accordingly regarded as relatively minor.In this study,each identified QTL explained less than 13% of the phenotypic variation for GLS PIFA when estimated with individual experiments(Table 2),whereas a QTL on chromosome 1 with r2values as high as 47%had been identified using a population derived from line Va14 and B73 [9].Compared with previous QTL mapping experiments for GLS using biparental populations in maize,GWAS has advantages for identification of QTL with minor effects.These advantages may be attributed to the lower phenotypic and greater genotypic variation in these 161 maize inbred lines [37].Because biparental mapping usually employs phenotypically diverse parents,and progeny populations with allele frequencies close to 0.5,it is expected to be most effective in identifying large-effect QTL.
Association mapping based on LD has been proved to be effective for revealing the genetic basis of important traits in maize with high resolution [59],as shown on chromosomes 3,5,7,8,and 9 (Fig.4),by markers such as PZE-103142893(qGLS3.07),and PZE-109119001 (qGLS3.07) within candidate genes in chromosome bins 3.07 and 9.07,respectively(Fig.3).
4.3.Candidate genes identified by GWAS
Previous studies suggested that SNPs significantly associated with phenotypic variance could be located very closely to the causative genetic variants [60,61].In the present study,three candidate genes,GLScgcb03071,GLScgcb03072,and GLScgcb0907,were identified by their conserved regions including CC and STK,which are shared by many R genes cloned to date[62,63].The CC domain is a conserved motif contained in some nucleotidebinding site/leucine rich repeat(NBS-LRR)proteins(CC-NBS-LRR)that are involved in pathogen sensing and host defense[64–66].These types of domains have been identified in proteins involved in resistance to fungal diseases including Dm3,which confers Bremia lactucae resistance in lettuce[67];I2,which confers Fusarium oxysporum resistance in tomato [68,69]; Mla,which confers Blumeria graminis resistance in barley [37]; Pib,which confers Magnaporthe grisea resistance in rice[70];and Rp1,which confers Puccinia sorghi resistance in maize[71].Proteins containing STK domains,such as the rice bacterial blight resistance gene product Xa21 [72],constitute one category of receptor protein kinases (RPK) [73] that play important roles in plant–pathogen interaction and defense responses [73–76].Collectively,the candidate genes we have identified suggest that joint linkage–linkage disequilibrium mapping is a powerful tool for revealing candidate genes for complex traits.However,it should be emphasized that these candidate genes should be further validated via other methods.
There are two main reasons why only three candidate genes were identified in this study.First,the sequence lengths of regions within the LD blocks containing significant SNPs that were scanned for potential genes were variable.For example,the length of the genomic sequence derived from PZE-103142492 in chromosome bin 3.06 was only 2583 bp.Second,not all conserved domains and motifs useful for identifying candidate genes conferring GLS resistance have yet been identified.To date,most R genes that have been cloned share a limited number of conserved domains and motifs,such as NBS,LRR,and PK motifs,transmembrane domains,leucine zippers,and Toll-interleukin-1 motifs[65].
4.4.Development of functional markers underlying GLS resistance
Given that GLS resistance in this study was dominated by several loci with relatively small effects,how can these small-effect QTL be used to improve germplasm for resistance to GLS?Unlike large-effect QTL that are easier both to identify and to maintain in breeding populations by phenotypic selection,small-effect QTL are more likely to be lost from breeding populations without the use of MAS [37].Thus,development of molecular markers closely linked to underlying genes or QTL for traits,especially functional markers,will be necessary for accumulation and maintenance of many of these small-effect QTL to achieve an acceptable level of resistance within breeding populations.Functional marker development also requires allele sequences of functionally characterized genes from which polymorphic,functional motifs affecting plant phenotypes can be identified [77].In this study,significant SNPs identified using GWAS,especially those within candidate genes for GLS resistance such as PZE-103142893 and PZE-109119001 can provide an important reference for functional marker development.These gene-derived functional markers would be the ideal tools for MAS breeding of GLS disease resistance in maize.
5.Conclusions
In this study,41,101 SNPs and phenotypic data for GLS resistance collected in 2010 and 2011 were used for a GWAS.As a result,51 SNPs were significantly (P <0.001) associated with GLS resistance,and could be converted into 31 QTL.Three candidate genes are associated with plant defense,including NBS-LRR and STK genes similar to those known to be involved in basal defense [73–76].Two genic SNPs (PZE-103142893 and PZE-109119001)in chromosome bins 3.07 and 9.07,respectively,associated with GLS resistance,could be useful for MAS breeding of GLS resistance in maize.
This study was jointly funded by the National High Technology Research and Development Program of China (2012AA101104)and the Modern Agro-Industry Technology Research System of Maize(CARS-02-02).
[1] L.Tehon,E.Daniels,Notes on the parasitic fungi of Illinois:II,Mycologia 17(1925)240–249.
[2] R.C.Pratt,S.G.Gordon,Breeding for resistance to maize foliar pathogens,in:J.Janick(Ed.),Plant Breeding Reviews,John Wiley&Sons,Inc.,Hoboken New Jersey,2006,pp.119–173.
[3] J.M.J.Ward,E.L.Stromberg,D.C.Nowell,J.F.W.Nutter,Gray leaf spot:a disease of global importance in maize production,Plant Dis.83(1999)884–895.
[4] Y.Zhang,L.Xu,X.Fan,J.Tan,W.Chen,M.Xu,QTL mapping of resistance to gray leaf spot in maize,Theor.Appl.Genet.125(2012)1797–1808.
[5] J.Wang,M.Levy,L.D.Dunkle,Sibling species of Cercospora associated with gray leaf spot of maize,Phytopathology 88(1998)1269–1275.
[6] G.H.Cao,The research advance on resistance to grey leaf spot in maize,J.Maize Sci.17(2009) 152–155.
[7] H.Gevers,J.Lake,T.Hohls,Diallel cross analysis of resistance to gray leaf spot in maize,Plant Dis.78(1994) 379–383.
[8] L.Y.Shi,X.H.Li,Z.F.Hao,C.X.Xie,H.L.Ji,X.L.Lü,S.H.Zhang,G.T.Pan,Comparative QTL mapping of resistance to gray leaf spot in maize based on bioinformatics,Agric.Sci.China 6(2007)1411–1419.
[9] M.A.S.Maroof,Y.Yue,Z.Xiang,E.Stromberg,G.Rufener,Identification of quantitative trait loci controlling resistance to gray leaf spot disease in maize,Theor.Appl.Genet.93(1996) 539–546.
[10] H.Y.Dong,Y.Jiang,L.J.Wang,X.D.Xu,Evaluation on maize germplasm resources for resistance to gray leaf spot,J.Plant Genet.Resour.6(2005)441–443(in Chinese with English abstract).
[11] R.Bernardo,Molecular markers and selection for complex traits in plants: learning from the last 20 years,Crop Sci.48(2008) 1649–1664.
[12] M.J.Clements,J.Dudley,D.White,Quantitative trait loci associated with resistance to gray leaf spot of corn,Phytopathology 90 (2000) 1018–1025.
[13] A.Menkir,M.Ayodele,Genetic analysis of resistance to gray leaf spot of midaltitude maize inbred lines,Crop Sci.45(2005)163–170.
[14] S.G.Gordon,P.E.Lipps,R.C.Pratt,Heritability and components of resistance to Cercospora zeae-maydis derived from maize inbred VO613Y,Phytopathology 96(2006)593–598.
[15] G.H.Cao,Preliminary studies on germplasm evaluation and QTL mapping for resistance to gray leaf spot in maize,MS Thesis of Chinese Academy of Agricultural Sciences,Beijing,China,2008.
[16] F.C.Juliatti,M.G.Pedrosa,H.D.Silva,J.V.C.da Silva,Genetic mapping for resistance to gray leaf spot in maize,Euphytica 169 (2009) 227–238.
[17] G.Pozar,D.Butruille,H.D.Silva,Z.P.McCuddin,J.C.V.Penna,Mapping and validation of quantitative trait loci for resistance to Cercospora zeae-maydis infection in tropical maize (Zea mays L.),Theor.Appl.Genet.118 (2009) 553–564.
[18] J.C.Zwonitzer,N.D.Coles,M.D.Krakowsky,C.Arellano,J.B.Holland,M.D.McMullen,R.C.Pratt,P.J.Balint-Kurti,Mapping resistance quantitative trait loci for three foliar diseases in a maize recombinant inbred line population-evidence for multiple disease resistance,Phytopathology 100(2010)72–79.
[19] A.Lehmensiek,A.Esterhuizen,D.Van Staden,S.Nelson,A.Retief,Genetic mapping of gray leaf spot (GLS) resistance genes in maize,Theor.Appl.Genet.103 (2001) 797–803.
[20] D.M.Bubeck,M.M.Goodman,W.D.Beavis,D.Grant,Quantitative trait loci controlling resistance to gray leaf spot in maize,Crop Sci.33 (1993) 838–847.
[21] Y.Xu,J.H.Crouch,Marker-assisted selection in plant breeding:from publications to practice,Crop Sci.48(2008)391–407.
[22] J.L.Jannink,M.C.A.M.Bink,R.C.Jansen,Using complex plant pedigrees to map valuable genes,Trends Plant Sci.6 (2001)337–342.
[23] J.B.Buntjer,A.P.Sørensen,J.D.Peleman,Haplotype diversity:the link between statistical and biological association,Trends Plant Sci.10(2005) 466–471.
[24] J.Yu,E.S.Buckler,Genetic association mapping and genome organization of maize,Curr.Opin.Biotechnol.17(2006)155–160.
[25] C.S.Zhu,M.Gore,E.S.Buckler,J.M.Yu,Status and prospects of association mapping in plants,Plant Genome 1(2008)5–20.
[26] K.L.Kump,P.J.Bradbury,R.J.Wisser,E.S.Buckler,A.R.Belcher,M.A.Oropeza-Rosas,J.C.Zwonitzer,S.Kresovich,M.D.McMullen,D.Ware,Genome-wide association study of quantitative resistance to southern leaf blight in the maize nested association mapping population,Nat.Genet.43(2011)163–168.
[27] J.A.Poland,P.J.Bradbury,E.S.Buckler,R.J.Nelson,Genome-wide nested association mapping of quantitative resistance to northern leaf blight in maize,Proc.Natl.Acad.Sci.U.S.A.108 (2011) 6893–6898.
[28] J.F.Weng,X.J.Liu,Z.H.Wang,J.J.Wang,L.Zhang,Z.F.Hao,C.X.Xie,M.S.Li,D.G.Zhang,L.Bai,C.L.Liu,S.H.Zhang,X.H.Li,Molecular mapping of the major resistance quantitative trait locus qHS2.09 with simple sequence repeat and single nucleotide polymorphism markers in maize,Phytopathology 102(2012)692–699.
[29] I.Sas,SAS/STAT User's Guide,Ver 8,SAS Institute Inc.,Cary,NC,1999.
[30] A.Hallauer,J.Miranda,Quantitative Genetics in Maize Breeding,Iowa State University Press,Ames,Iowa,1988.
[31] M.Saghai-Maroof,K.Soliman,R.A.Jorgensen,R.Allard,Ribosomal DNA spacer-length polymorphisms in barley:Mendelian inheritance,chromosomal location,and population dynamics,Proc.Natl.Acad.Sci.U.S.A.81(1984)8014–8018.
[32] J.F.Weng,C.X.Xie,Z.F.Hao,J.J.Wang,C.L.Liu,M.S.Li,D.G.Zhang,L.Bai,S.H.Zhang,X.H.Li,Genome-wide association study identifies candidate genes that affect plant height in Chinese elite maize(Zea mays L.)inbred lines,PLoS ONE 6(2011)e29229.
[33] J.Barrett,B.Fry,J.Maller,M.Daly,Haploview: analysis and visualization of LD and haplotype maps,Bioinformatics 21(2005) 263–265.
[34] J.K.Pritchard,M.Stephens,P.Donnelly,Inference of population structure using multilocus genotype data,Genetics 155 (2000) 945–959.
[35] Z.Z.Liu,X.Wu,H.L.Liu,Y.X.Li,Q.C.Li,F.G.Wang,Y.S.Shi,Y.C.Song,W.B.Song,J.R.Zhao,J.S.Lai,Y.Li,T.Y.Wang,Genetic diversity and population structure of important chinese maize inbred lines revealed by 40 core simple sequence repeats(SSRs),Sci.Agric.Sin.45(2012)2107–2138(in Chinese with English abstract).
[36] P.J.Bradbury,Z.Zhang,D.E.Kroon,T.M.Casstevens,Y.Ramdoss,E.S.Buckler,TASSEL: software for association mapping of complex traits in diverse samples,Bioinformatics 23(2007) 2633–2635.
[37] J.Massman,B.Cooper,R.Horsley,S.Neate,R.Dill-Macky,S.Chao,Y.Dong,P.Schwarz,G.Muehlbauer,K.Smith,Genome-wide association mapping of Fusarium head blight resistance in contemporary barley breeding germplasm,Mol.Breed.27(2011) 439–454.
[38] S.B.Gabriel,S.F.Schaffner,H.Nguyen,J.M.Moore,J.Roy,B.Blumenstiel,J.Higgins,M.DeFelice,A.Lochner,M.Faggart,The structure of haplotype blocks in the human genome,Science 296 (2002) 2225–2229.
[39] Z.Wei,W.Wang,J.Bradfield,J.Li,C.Cardinale,E.Frackelton,C.Kim,F.Mentch,K.Van Steen,P.M.Visscher,Large sample size,wide variant spectrum,and advanced machine-learning technique boost risk prediction for inflammatory bowel disease,Am.J.Hum.Genet.6(2013) 1008–1012.
[40] Z.Y.Wang,K.L.He,F.Zhang,X.Lu,D.Babendreier,Mass rearing and release of Trichogramma for biological control of insect pests of corn in China,Biol.Control 68(2014) 136–144.
[41] M.W.Horton,A.M.Hancock,Y.S.Huang,C.Toomajian,S.Atwell,A.Auton,N.W.Muliyati,A.Platt,F.G.Sperone,B.J.Vilhjálmsson,Genome-wide patterns of genetic variation in worldwide Arabidopsis thaliana accessions from the RegMap panel,Nat.Genet.44(2012) 212–216.
[42] Jin L.Construction of an association population and association analysis for some quality traits in rice(Oryza sativa L.).PhD Dissertation of Zhejiang University,Hangzhou,China,2009.
[43] Y.Wu,C.Wu,B.Qin,Z.Wang,W.Huang,M.Yang,Y.Yin,Diversity of 175 wheat varieties from Yellow and Huai River Valleys facultative wheat zone and association of SSR markers with plant height and yield related traits,Acta Agron.Sin.38(2012)1018–1028(in Chinese with English abstract).
[44] T.Wei,X.Chang,D.Min,R.Jin,Analysis of genetic diversity and tapping elite alleles for plant height in drought-tolerant wheat varieties,Acta Agron.Sin.36 (2010) 895–904(in Chinese with English abstract).
[45] W.Wei,Y.Zhang,H.Lü,L.Wang,D.Li,X.Zhang,Population structure and association analysis of oil content in a diverse set of Chinese sesame(Sesamum indicum L.) germplasm,Sci.Agric.Sin.45(2012) 1895–1903(in Chinese with English abstract).
[46] L.Kruglyak,Prospects for whole-genome linkage disequilibrium mapping of common disease genes,Nat.Genet.22(1999)139–144.
[47] R.Turakulov,S.Easteal,Number of SNPS loci needed to detect population structure,Hum.Hered.55(2003) 37–45.
[48] J.K.Pritchard,N.A.Rosenberg,Use of unlinked genetic markers to detect population stratification in association studies,Am.J.Hum.Genet.65(1999) 220–228.
[49] N.Liu,L.Chen,S.Wang,C.Oh,H.Zhao,Comparison of single-nucleotide polymorphisms and microsatellites in inference of population structure,BMC Genet.6 (Suppl.1)(2005) S26.
[50] N.A.Rosenberg,L.M.Li,R.Ward,J.K.Pritchard,Informativeness of genetic markers for inference of ancestry,Am.J.Hum.Genet.73(2003)1402–1422.
[51] P.A.Morin,G.Luikart,R.K.Wayne,SNPs in ecology,evolution and conservation,Trends Ecol.Evol.19(2004) 208–216.
[52] R.J.Haasl,B.A.Payseur,Multi-locus inference of population structure:a comparison between single nucleotide polymorphisms and microsatellites,Heredity 106(2010)158–171.
[53] Y.Lu,J.Yan,C.T.Guimaraes,S.Taba,Z.Hao,S.Gao,S.Chen,J.Li,S.Zhang,B.S.Vivek,Molecular characterization of global maize breeding germplasm based on genome-wide single nucleotide polymorphisms,Theor.Appl.Genet.120(2009)93–115.
[54] R.Wang,Y.Yu,J.Zhao,Y.Shi,Y.Song,T.Wang,Y.Li,Population structure and linkage disequilibrium of a mini core set of maize inbred lines in China,Theor.Appl.Genet.117 (2008) 1141–1153.
[55] F.G.Wang,H.L.Tian,J.R.Zhao,H.M.Yi,L.Wang,W.Song,Development and characterization of a core set of SSR markers for fingerprinting analysis of Chinese maize varieties,Maydica 56(2011) 1–11.
[56] G.Z.Lv,Y.X.Zhang,J.Y.Liang,H.Yang,G.Chen,Y.Sun,L.Chen,Z.Y.Wang,Epidemics of gray leaf spot of corn(cercospora zeae-maydis)and varietal resistance,Acta Phytopathol.Sin.33(2003)462–467(in Chinese with English abstract).
[57] C.Xie,S.Zhang,M.Li,X.Li,Z.Hao,L.Bai,D.Zhang,Y.Liang,Inferring genome ancestry and estimating molecular relatedness among 187 Chinese maize inbred lines,J.Genet.Genomics 34(2007)738–748.
[58] L.X.Yuan,J.H.Fu,S.H.Zhang,X.Z.Liu,Z.B.Peng,X.H.Li,M.Warburton,M.Khairallah,Heterotic grouping of maize inbred lines using RFLP and SSR markers,Acta Agron.Sin.27(2001)149–156 (in Chinese with English abstract).
[59] D.L.Remington,J.M.Thornsberry,Y.Matsuoka,L.M.Wilson,S.R.Whitt,J.Doebley,S.Kresovich,M.M.Goodman,E.S.Buckler,Structure of linkage disequilibrium and phenotypic associations in the maize genome,Proc.Natl.Acad.Sci.U.S.A.98(2001)11479–11484.
[60] X.Huang,X.Wei,T.Sang,Q.Zhao,Q.Feng,Y.Zhao,C.Li,C.Zhu,T.Lu,Z.Zhang,Genome-wide association studies of 14 agronomic traits in rice landraces,Nat.Genet.42(2010)961–967.
[61] M.J.Aranzana,S.Kim,K.Zhao,E.Bakker,M.Horton,K.Jakob,C.Lister,J.Molitor,C.Shindo,C.Tang,Genome-wide association mapping in Arabidopsis identifies previously known flowering time and pathogen resistance genes,PLoS Genet.1(2005) 531–539.
[62] S.H.Hulbert,C.A.Webb,S.M.Smith,Q.Sun,Resistance gene complexes: evolution and utilization,Annu.Rev.Phytopathol.39(2001) 285–312.
[63] J.J.Liu,A.Ekramoddoullah,Isolation,genetic variation and expression of TIR-NBS-LRR resistance gene analogs from western white pine (Pinus monticola Dougl.ex.D.Don.),Mol.Genet.Genomics 270 (2004) 432–441.
[64] B.J.DeYoung,R.W.Innes,Plant NBS-LRR proteins in pathogen sensing and host defense,Nat.Immunol.7(2006)1243–1249.
[65] G.B.Martin,A.J.Bogdanove,G.Sessa,Understanding the functions of plant disease resistance proteins,Annu.Rev.Plant Biol.54 (2003) 23–61.
[66] G.van Ooijen,H.A.van den Burg,B.J.C.Cornelissen,F.L.W.Takken,Structure and function of resistance proteins in solanaceous plants,Annu.Rev.Phytopathol.45(2007) 43–72.
[67] B.C.Meyers,K.A.Shen,P.Rohani,B.S.Gaut,R.W.Michelmore,Receptor-like genes in the major resistance locus of lettuce are subject to divergent selection,Plant Cell Online 1998(1833–1846) 10.
[68] W.I.L.Tameling,S.D.J.Elzinga,P.S.Darmin,J.H.Vossen,F.L.W.Takken,M.A.Haring,B.J.C.Cornelissen,The tomato R gene products I-2 and MI-1 are functional ATP binding proteins with ATPase activity,Plant Cell Online 14(2002)2929–2939.
[69] G.Simons,J.Groenendijk,J.Wijbrandi,M.Reijans,J.Groenen,P.Diergaarde,T.Van der Lee,M.Bleeker,J.Onstenk,M.de Both,Dissection of the Fusarium I2 gene cluster in tomato reveals six homologs and one active gene copy,Plant Cell Online 10(1998) 1055–1068.
[70] Z.X.Wang,M.Yano,U.Yamanouchi,M.Iwamoto,L.Monna,H.Hayasaka,Y.Katayose,T.Sasaki,The Pib gene for rice blast resistance belongs to the nucleotide binding and leucine-rich repeat class of plant disease resistance genes,Plant J.19(2002) 55–64.
[71] N.Collins,J.Drake,M.Ayliffe,Q.Sun,J.Ellis,S.Hulbert,T.Pryor,Molecular characterization of the maize Rp1-D rust resistance haplotype and its mutants,Plant Cell Online 11(1999) 1365–1376.
[72] W.Y.Song,G.L.Wang,L.L.Chen,H.S.Kim,L.Y.Pi,T.Holsten,J.Gardner,B.Wang,W.X.Zhai,L.H.Zhu,A receptor kinase-like protein encoded by the rice disease resistance gene,Xa21,Science 270 (1995) 1804–1806.
[73] A.J.Afzal,A.J.Wood,D.A.Lightfoot,Plant receptor-like serine threonine kinases: roles in signaling and plant defense,Mol.Plant-Microbe Interact.21(2008) 507–517.
[74] D.Hardie,Plant protein serine/threonine kinases:classification and functions,Annu.Rev.Plant Biol.50 (1999)97–131.
[75] S.H.Shiu,A.B.Bleecker,Plant receptor-like kinase gene family: diversity,function,and signaling,Sci.Signal.113(2001) re22.
[76] J.M.Stone,J.C.Walker,Plant protein kinase families and signal transduction,Plant Physiol.108 (1995) 451–457.
[77] J.R.Andersen,T.Lübberstedt,Functional markers in plants,Trends Plant Sci.8 (2003) 554–560.
- The Crop Journal的其它文章
- Genome-wide analysis of the WRKY transcription factor gene family in Gossypium raimondii and the expression of orthologs in cultivated tetraploid cotton
- Development of highly glyphosate-tolerant tobacco by coexpression of glyphosate acetyltransferase gat and EPSPS G2-aroA genes
- SSR genetic linkage map construction of pea (Pisum sativum L.) based on Chinese native varieties
- Rank correlation among different statistical models in ranking of winter wheat genotypes,
- Effects of exogenous ABA application on post-anthesis dry matter redistribution and grain starch accumulation of winter wheat with different staygreen characteristics
- Overexpression of GmDREB1 improves salt tolerance in transgenic wheat and leaf protein response to high salinity