Basic Study of Air Leakage Position Based on Thermography Mosaic Technology
Ying Jin, Tao Wang, and Bo Wang
Basic Study of Air Leakage Position Based on Thermography Mosaic Technology
Ying Jin, Tao Wang, and Bo Wang
—When locating the leakage of thermal field of a certain container, it is hard for us to evaluate the leakage with one or several separate thermal infrared images. Instead, panoramic imagery with a wide visual angle and high distinguishability is always needed. However, we can only get images for part of the scene because of the limited visual field of thermography and the large size of the measured object in practical. What is more, the hardware that can be used to get panoramic images is always expensive and cannot be used in large scale. Therefore, this paper introduces image mosaic technology, which can be used to get the intact thermal infrared image of the measured and increase the efficiency of detection. The experiment results demonstrate its effectiveness.
Index Terms—Leakage position, thermal infrared image, image mosaic.
1. Introduction
In recent years, leakage detection technology has been widely used in the automobile industry, hydropneumatic components, medical treatment, and chemical industry[1]. Leakage detection, which is a kind of performance index, is often conducted in the process of system manufacture and mainly used to test the leakproofness of a sealed container. It is always conducted in the industrial field with speediness[2].
The infrared nondestructive testing technology[3], which is also called thermal image detection technology, is a kind of new nondestructive testing technology and is widely used in the detection of electrical equipment. It has a certain effect in the research of lining damage of high-temperature and high-pressure thermal equipment and is one of the most active research hotspots. The infrared nondestructive testing technology is based on the theory of infrared radiation, which converts the distribution of temperature of the measured object into a visual thermal graph (a grayscale image or chromogram).
The image mosaic technology[4]was first applied in the aerospace field and now it has wide applications in many other aspects[5]. The image mosaic technology splices a series of figures for the same scene, which have overlaps, seamlessly to make an image with a wide visual angle and high distinguishability. The mosaic image is requested to be similar to the original image as much as possible and the anamorphose should be as small as possible without obvious suture lines.
In practical, we can only get images for part of the scene restricted by the limited visual field of thermography and the large size of the measured object. When positioning the leakage of thermal field of a certain container, it is difficult for us to evaluate the leakage with partial thermal-induced images. This paper will introduce image mosaic technology into the field of thermal image processing. We will combine thermography with air leakage positioning and use the mosaic technology for partial thermal infrared images of the measured object to obtain the leakage position with multi angles and multi aspects in a constructed system that can automatically locate the air leakage.
2. Construction of Leakage Position System Based on Thermography
In this paper we construct a leakage position system based on thermography as shown in Fig. 1.
We put the measured object and thermography in a lens hood, which can remove thermal radiation interference and heat reflection influence through shield measures. To simulate the tiny leak of practical object, we have designed a measured air-capacitor referring to industrial applications and made several leakage holes on the wall of an air-capacitor by using laser boring. The overall dimension of the cylinder-shaped air-capacitor is 150 mm×150 mm×255 mm and the volume is 3.197 L. In Fig. 2, the plotted point is the leakage hole.
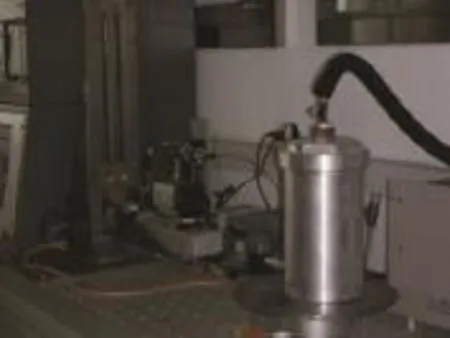
Fig. 1. Leakage position system based on thermography.
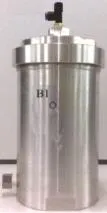
Fig. 2. Cylinder-shaped air-capacitor and the leakage hole.
The pneumatic circuit in the experiment is shown in Fig. 3. The core of system is A20m on-line thermography, which is produced by FLIR Company, America. The gas coming from the air supply will be the testing medium of 0.4 Mpa to 0.7 Mpa after being pressure regulated by the precision pressure reducing valve. At this time, the cooler will cool the compressed air when we open the inflation valve and two three-way valves. When the temperature becomes the required 253 K to 273 K, the air will flow through the speed control valve and aerate the measured object with certain speed. When the pressure sensor detects that the pressure in container is stable, we should turn off the inflation valve and open the flow measurement valve, switching in the flow meter of small range to measure the real-time leakage. In the experiment, the thermography will record the frame sequential of infrared thermal images and transmit it to a computer through the 1394 interface to store and process. When an experimental period is finished, the flow measurement valve is closed and the two three-way valves are switched to exhaust. Because of the Joule-Thomson effect and heat-transfer effect generated by leakage flowing, the change of temperature field before and after the air inflation in the leakage hole will be detected by thermography. By processing the collected infrared thermal images with the image mosaic and positioning algorithm, we can get the leakage position.
3. Obtaining Infrared Thermal Image and Pretreatment
Considering the noise characteristic and the real-time performance of every algorithm, this paper has designed the image filtering software through LabVIEW software by using the Wiener filtering method for the thermal infrared image denoising processing. For thermal infrared image preprocessing in a complicated background, the Wiener filtering method has good performance and it can eliminate noise while keeping high frequency information in a preferably effective way. The filtering result of thermal infrared image is shown in Fig. 4.

Fig. 3. Experimental circuit of air leakage position.
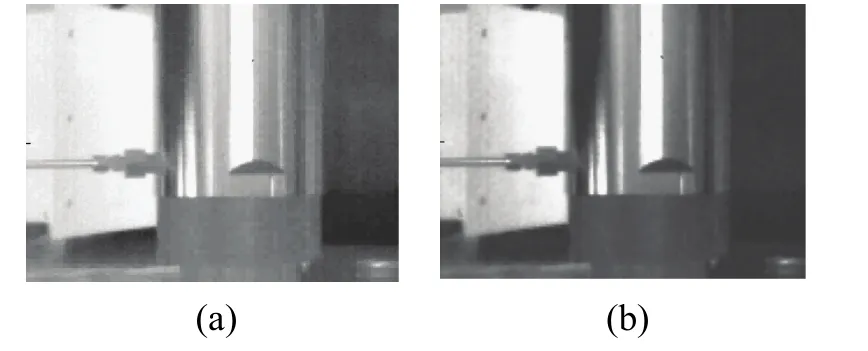
Fig. 4. Filtering result of thermal infrared image: (a) original image and (b) thermal infrared image processed by the Wiener filtering.
4. Measured Object’s Thermal Infrared Image Matching Based on SIFT Algorithm
Based on characteristics of thermal infrared images, we choose the scale-invariant feature transform (SIFT) algorithm. Through this algorithm we can conduct calculation for feature points in both of the spatial domain and scale domain at the same time. The extraction of character features can keep certain invariance even if the image has variable factors, such as the rotation, image scaling and affine transformation, changes of view, illumination variation, and noise. The algorithm can also extract the feature points correctly in the image whose scale and view angle varies significantly so that the noise interference in the image can be eliminated effectively. It has good performance of real-time and robustness, which is a preferably good feature matching algorithm.
4.1 Extreme Detection of Scale Space
In this paper, we use the difference of Gaussian (DOG) pyramid to build the scale space of image: Firstly, the Gaussian templateis used to make convolution to get the Gaussian pyramid. Then we make scale decompositions for the Gaussian pyramid based on the Gaussian template of different scale factors. In the end, we can get DOG pyramid by conducting the difference operation to the Gaussian pyramids of adjacent scale space. The Gaussian template is defined as followed:


where * is convolution. The order of common Gaussian pyramid is 4 and there is a 5-layer scale image in each order. In the same order, the scale factor of adjacent layers is k, and the difference operation can be carried out in order to get DOG pyramid, just as (3):

4.2 Refine Feature Points
The feature points detected through the scale space would be sensitive to noise and margin information because of the characters of the DOG operator. Thus, in order to obtain more suitable feature points of image mosaic, we should refine the feature points and exterminate the low-contrast feature points and unstable edge response points, which can make the matching more stable and enhance the capacity of anti-noise.
4.3 Calculating Direction of Feature Point
The greatest advantage of SIFT algorithm is rotation invariance, and the key procedure to make it have rotation invariance is to use the distribution character in the gradient direction of the neighborhood pixel to appoint the direction parameter for each feature point:

Equation (4) is the gradient value m(x, y) and direction of point (x, y) θ(x, y). In the actual calculation, we sample in the neighborhood whose center is the feature point and record the gradient direction of the neighborhood pixel with a histogram. The range of gradient histogram is from 0 degree to 360 degree, in which there is a column every 10 degree, and 36 columns in all. The peak value of the histogram represents the principal direction of neighborhood gradient of this feature point, which is the direction of this feature point.
4.4 Generate the Eigenvector
First, we take an 8×8 pixels window, whose center is the feature point, without the line and row, where the feature point locates, to calculate the gradient of the pixel value of the point in the chosen window. Then, the 8×8 pixels window is divided equally into 4 small windows and we calculate the weighted sum of 8 direction gradients of the points in 4 small windows. The weighted value of pixel gradient will increase as it gets close to the feature point, which would generate a seed point, just as Fig. 5 shows.
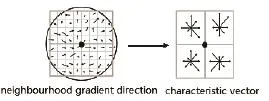
Fig. 5. Generate the eigenvector from neighborhood gradient information of feature point.
In Fig. 5, a key point consists of 2×2 pixels, which are 4 seed points in all, and every seed point has 8 direction vectors’ information. This idea of uniting the neighborhood direction information can help to increase the ability of anti-noise of the algorithm and it also provides fault tolerance for feature matching with location errors.
Through the 4 steps above, the extraction of SIFT feature points can be accomplished. Then we can get the panorama image with preferable mosaic effect through the match of the sequence images’ features and image fusion.
4.5 SIFT Feature Matching and Result of SoftwareImplementation
After the generation of SIFT eigenvector of two images, we use the Euclidean distance of key points’ eigenvectors as the measurement of similarity judgment of key points in two images. Assume that the signalments of p and q from feature points are Despand Desq, respectively, then the definition of Euclidean distance is

First, the k-d tree is used to conduct the best-first search to search the two nearest-neighbor feature points of each feature point, for example we find two neighborhood feature points q′ and q″ whose Euclidean distance is the nearest and the second nearest to the feature point p. Then we calculate the ratio r between these two distances. If the ratio r is less than the given threshold T, the matching is successful and the point pair (p, q′) is a pair of match points in the image sequence, otherwise, the matching fails.
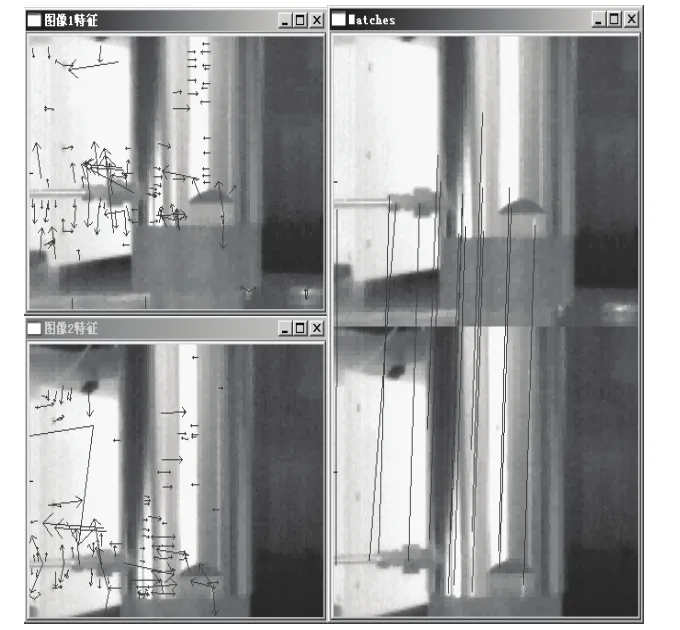
Fig. 6. Feature extraction and matching.
In this paper, we choose two sequential collected thermal infrared images. Then we call the SIFT algorithm by using the dynamic link library in the LabVIEW to get the matching feature points in the two images. Fig. 6 shows the results of feature extraction and matching of two images in sequential images.
5. Measured Object’s Thermal Infrared Image Mosaic and Blending
First, we should use the Wiener filtering method to preprocess all images and next we extract the feature points of adjacent images and match them. Then we can get parameters through affine transformation. Thus, two images registration can be achieved based on the parameters of transformation so that the transformation between two thermal infrared images can be determined before stitching. When blending the images to produce a panoramic image, we should use the weighting fusion method because of the seams produced by the chromatic aberration. So that we can get the gradually fading out effect and accomplish the two images mosaic. The whole thermal infrared panoramic image can be obtained by using the above method to successively process the collected sequential images.
This paper uses the images taken by the thermography to conduct the mosaic experiment. The adjacent images have overlap area of 30% to 50% and are taken from the top to the bottom with a constant focal length. The software experimental conditions are VC++6.0, WinXP, Matlab6.5, and LabVIEW. A series of original images that are extracted from thermal infrared image video frames are shown in Fig. 7. The size of these images is 320×240 pixels with a 50% overlap area. The panoramic image obtained by using sequential images mosaic is shown as Fig. 8. It is obvious that the effect for stitching of edges of images is good by using the proposed processing method. With the help of SIFT algorithm which is preferably stable for the illumination and contrast ratio variation, we get the mosaic image with a high quality. This also illustrates that the SIFT algorithm has the capacity of anti-interference.
With the thermal infrared panoramic image, we can conduct the leakage position algorithm through the mosaic of thermal infrared images extracted from video frames before and after air inflation in the following leakage detection. Finally, we can get the leakage position and enhance the detection efficiency.
6. Experiment and Its Result of Leakage Position Based on Thermal Infrared Image
The statistic characteristics of entropy calculation can just make up the defects of the single frame processing method and the direct difference method. When the measured object’s heat conduction is uneven or its position changes slightly, the entropy can also be stable as long as the distribution of grayscale is stable. On the other hand, the entropy will change when the occurrence of leakage destroys the grayscale distribution in this area. As the image entropy does not have position information in space, we need to use a local processing method when we introduce the image entropy to position the leakage. In this way, we need to calculate the entropy in every neighbor of a pixel, respectively, and get the partial entropy matrix so that we can position the leakage through the fusion of the local entropy difference of thermal infrared images before and after the air inflation.
In order to show the geometrical characteristic of images in a further way and realize the space location of the leakage area, we introduce the local entropy.
Just as the definition of image entropy, we assume an image and a template are M×N pixels and n1×n2pixels, respectively. It is also assumed that the image function is f(i, j)≥0, where. Then the local entropy of an image based on the n1×n2template can be defined as

After we characterize every provincial characteristic in the whole image successively by using the local entropy, the calculation result is an entropy matrix that consists of local entropy, as shown in (7).
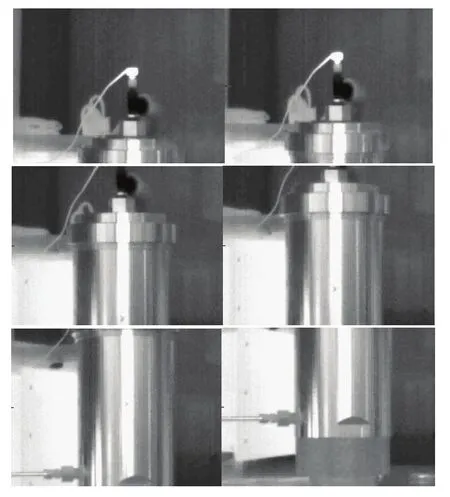
Fig. 7. Part sequence of original images.
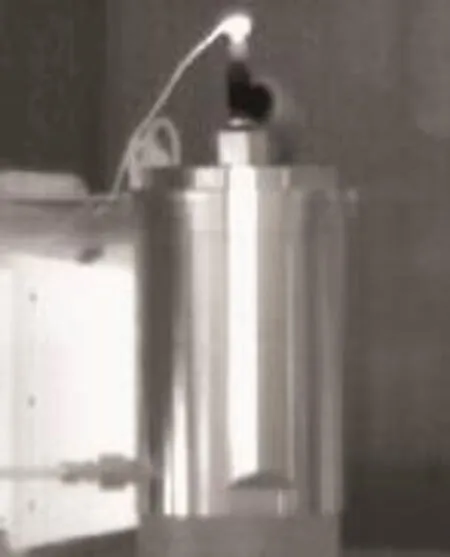
Fig. 8. Panoramic image obtained by the images above mosaic.
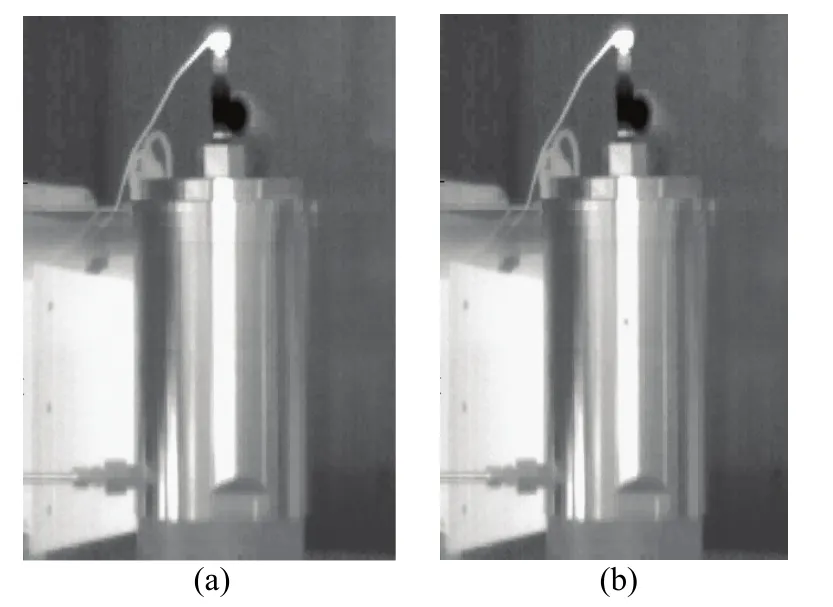
Fig. 9. Thermal infrared panoramic image: (a) thermal infrared image of leakage hole before air inflation and (b) thermal infrared image of leakage hole after a 130 s period of air inflation.
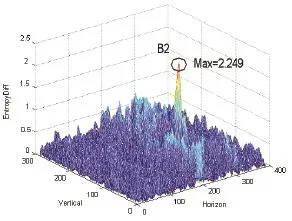
Fig. 10. Entropy matrix of thermal infrared image.

We calculate the local entropy difference matrix of the two images by using

If the thermal infrared images G and F match with each other well enough and each element in the local entropy difference matrixis small and close to 0, then it can be determined that the measured object has no leakage.
Assume the threshold is δ and scan the local entropy difference matrixpoint by point, if the value of elements in a certain successive area ofis greater than the threshold δ, then it can be determined that the measured object has a leakage point in this area (there may be more than one area).
The conditions to conduct the leakage position experiment of the measured object are following: the inflation pressure is 0.6 Mpa, the inflation temperature is 263 K, the time interval of collecting thermal infrared images before and after air inflation is 130 s, and the size of images exported by a 20 m thermography is 320×240 pixels. Besides, considering the calculation speed and capacity of resisting disturbance, we choose 10×10 pixels for the formwork of local entropy difference fusion.
First, we conduct the local entropy difference fusion calculation for the local thermal infrared images of the pre-estimated leakage position of the measured object. The experimental result is shown in Fig. 9 and the entropy matrix of thermal infrared image of the measured object is shown in Fig. 10.
Second, we use the local entropy difference fusion method to process the collected thermal infrared images. For the panoramic image obtained by image mosaic, the maximum value of the local entropy difference matrix of two images is 2.249, which is greater than the experience threshold of an aluminum air-capacitor, which is 2.1. Thus, we can say that this point is a leakage point. Therefore, the thermal infrared image mosaic algorithm used in this paper can not only achieve the large field of view collection to extend the visual range, but also pinpoint the leakage point when positioning the leakage through the local entropy fusion method, which enhances the efficiency of detection.
7. Conclusions
For a certain measured object, it is hard for us to evaluate the leakage with one or several separate thermal infrared images. Instead, the panoramic image with a wide visual angle and a high distinguish ability is always needed. In this paper, we introduce the image mosasic technology into the field of thermal infrared image processing in order to enhance the detection efficiency. We can choose the intact thermal infrared images of the measured object to process and position the leakage in a multi-view and multi-aspect way by using the image mosaic processing for the collected thermal infrared images.
[1] X.-J. Wu and R.-X. Yan, Leakage Detection, Beijing: China Machine Press, 2005 (in Chinese).
[2] G.-Z. Peng, “Current status of air tightness detection technique and improved method of detection efficiency,”Maschinen Market, vol. 14, no. 10, pp. 12-13, 2008.
[3] Y. Huang, “Inversion of infrared nondestructive testing with evolution algorithm,” Advanced Mechanical Design, doi: 10.4028/www.scientific.net/AMR.479-481.1614.
[4] H.-C. Shao, W.-L. Hwang, and Y.-C. Chen, “Biomedical image mosaicing: An optimized multiscale approach,” in Proc. of the 8th IEEE Int. Symposium on Biomedical Imaging: From Nano to Macro, Chicago, 2011, pp. 1374-1378.
[5] J.-P. Li, Dynamics of Pneumatic System, Guangzhou: South China University of Technology Press, 1991 (in Chinese).

Ying Jinwas born in Jilin, China in 1976. She received the B.S. and the M.S. degrees from the Beijing Institute of Technology (BIT), Beijing, in 1999 and 2002, respectively. And she received the Ph.D. degree in mechanical engineering from Osaka University, Japan in 2009. Currently, she is working with BIT. Her research interests include leakage positioning, image processing, and rehabilitation robot.
Tao Wangwas born in Inner Mongolia, China in 1971. He received the B.S. and M.S. degrees from BIT, Beijing in 1993 and 1999, respectively. And he received the Ph.D. degree in mechano-micro engineering from Tokyo Institute of Technology, Japan in 2006. Now, he works with BIT as an associate researcher. His research interests include modeling and control of pneumatic servo system and pneumatic components characteristics measurement.

Bo Wangwas born in Shandong, China in 1976. He received the B.S. and the M.S. degrees from BIT, Beijing in 1997 and 2005, respectively. Currently, he is working with BIT. His research interests include modeling and control of pneumatic servo system.
Manuscript received February 20, 2013; revised May 16, 2013.
Y. Jin is with the School of Automation Control, Beijing Institute of Technology, Beijing 100081, China (Corresponding author e-mail: jinyinghappy@bit.edu.cn).
T. Wang and B. Wang are with the School of Automation Control, Beijing Institute of Technology, Beijing 100081, China (e-mail: wangtaobit@bit.edu.cn; wangbo231@bit.edu.cn).
Digital Object Identifier: 10.3969/j.issn.1674-862X.2014.02.020
 Journal of Electronic Science and Technology2014年2期
- Journal of Electronic Science and Technology的其它文章
- Guest Editorial TTA Special Section on Terahertz Spectroscopy
- Guest Editorial Special Section on the Energy-Efficient Technologies
- An Overview of Non-Volatile Flip-Flops Based on Emerging Memory Technologies
- Analysis of Partial Volume Effects on Accurate Measurement of the Hippocampus Volume
- A Matrix Formulation of Discrete Chirp Fourier Transform Algorithms
- De-Duplication Complexity of Fingerprint Data in Large-Scale Applications
