
Determination of sodium hyaluronate in pharmaceutical formulations by HPLC-UV
2013-12-23 06:15:26RuckmniSleemShikhPvneKhlilMuneerThusleem
K. Ruckmni, Sleem Z. Shikh,*, Pvne Khlil,M.S. Muneer, O.A. Thusleem
aDepartment of Pharmaceutical Technology, Anna University of Technology, Thiruchirapalli, Trichy 620024, Tamilnadu, India
bDepartment of Analytical Research & Development, Jamjoom Pharmaceuticals, P.O. Box-6 267, Jeddah 21442, Saudi Arabia
1. Introduction
Sodium hyaluronate is an anionic, nonsulfated glycosaminoglycan distributed widely throughout connective, epithelial, and neural tissues [1]. It is unique among glycosaminoglycans in that it is nonsulfated, forms in the plasma membrane instead of the golgi,and can be very large,with its molecular weight often reaching the millions [2]. As one of the chief components of the extracellular matrix, hyaluronan contributes significantly to cell proliferation and migration, and may also be involved in the progression of some malignant tumors.
The average 70 kg(154 lbs)person has roughly 15 g of sodium hyaluronate in the body, one-third of which is turned over(degraded and synthesized) every day [3]. Sodium hyaluronate is also a component of the group A streptococcal extracellular capsule [4—6].
Sodium hyaluronate is a polymer of disaccharides, themselves composed of D-glucuronic acid and D-N-acetylglucosamine,linked via alternating β-1,4 and β-1,3 glycosidic bonds. Hyaluronate can be 25,000 disaccharide repeats in length. Polymers of sodium hyaluronate can range in size from 5000 to 20,000,000 Da in vivo.The average molecular weight in human synovial fluid is 3—4 million Da, and hyaluronan purified from human umbilical cord is 3,140,000 Da [7].
Sodium hyaluronate is used in eye surgery i.e., corneal transplantation, cataract surgery, glaucoma surgery, surgery to repair retinal detachment and eye lubricant as an ophthalmic solution [8].
Sodium hyaluronate is used as a viscosupplement,administered through a series of injections into the knee,increasing the viscosity of the synovial fluid, which helps lubricate, cushion and reduce pain in the joint.It is generally used as a last resort before surgery and provides symptomatic relief, by recovering the viscoelasticity of the articular fluid, and by stimulating new production from synovial fluid.Use of sodium hyaluronate may reduce the need for joint replacement.
In comparison with derivatization, size exclusion chromatographic methods have the advantages of reducing analysis time,enhancing sensitivity and flexibility and lowering the cost of the instruments and maintenance[9].One of the biggest disadvantages of derivatization has been lack of stability. The reaction products are not stable and have short half life possibly because of a spontaneous intermolecular rearrangement [10]. Another disadvantage of derivatization is that it reacts with only few functional groups.
The literature survey shows that several methods [11—28] like enzymatic, Carbopac PA1 chromatography, chemiluminescence,digestion, gas—liquid chromatographic, on-line HPLC/ESI—MS;HPLC UV—vis methods have been reported for the determination of sodium hyaluronate with derivatization. Most of the reported methods are by derivatization, gel permeation chromatography or digestion. These methods and the official methods may not be suitable for assay of sodium hyaluronate in ophthalmic solutions due to complexity, sensitivity, risk and flexibility issues involved into it. However, as per bibliographical revisions performed,no HPLC analytical method has been reported for direct (without derivatization) determination of sodium hyaluronate.
The present study was aimed at developing simple, specific,accurate and precise HPLC method for the determination of sodium hyaluronate in commercially available and in-house prepared pharmaceutical formulations, based on direct UV-detection, in which a size exclusion stationary phase was selected for use in routine quality control applications. The proposed method for the determination of sodium hyaluronate in pharmaceutical formulations by HPLC UV detectors is first of its kind without involving derivatization and GPC software.
The issues with the GPC software are that it gives analysis data output as:
Relative molecular weight values (Mn, Mw, Mz and Mp),molecular weight distribution: MWD and polydispersity: Mw/Mn.Procedure involves lengthy and tedious column calibration. In regards to polymers, the molecular masses of most of the chains will be too close resulting in eluting broad peaks in the GPC separations.
The proposed method could be of use to industries that deal with sodium hyaluronate and need to determine its content without having to invest into GPC software.
2. Experimental
2.1. Instrumentation
Integrated high performance liquid chromatographic systems LC-2010AHT from Shimadzu Corporation (Chromatographic and Spectrophotometric Division, Kyoto, Japan) consisted of a binary gradient system, a high speed auto-sampler, a column oven and a UV—vis detector. BioSep SEC S2000, 300 mm×7.8 mm analytical column from USA, was used as stationary phase. Chromatograms were recorded and integrated on PC installed with LC solution chromatographic software, version 1.22 SP1 (Shimadzu,Kyoto, Japan).
2.2. Reference substances, reagents and chemicals
Sodium hyaluronate was obtained from Yantai Dongcheng Biochemicals, China. Sodium phosphate, sodium azide, phosphoric acid, potassium hydroxide, and potassium dihydrogen phosphate were purchased from Panreac Quimica (Barcelona) Espana.Distilled water was obtained from a Milli-Q system Millipore,Milford, MA, USA. All the chemicals and reagents were of analytical or reagent grade. Reference standards of sodium hyaluronate were obtained from British Pharmacopoeia Commission Laboratory, London. The excipients sodium dihydrogen phosphate, di-sodium hydrogen phosphate and sodium chloride were obtained from Merck, Germany. Ophthalmic formulations containing sodium hyaluronate were developed and manufactured in our research and development laboratory.
2.3. Chromatographic conditions
Isocratic mobile phase consisted of a 0.05 M potassium dihydrogen phosphate, pH adjusted to 7.0 using potassium hydroxide(10% solution). The mobile phase was filtered and degassed through membrane filter of 0.45 μm porosity under vacuum.A constant flow rate of l.0 mL/min was employed throughout the analysis. Variable UV—vis detector wavelength was set at 205 nm.All pertinent analyses were made at 25°C and volume of solution injected on to the column was 10 μL.
2.4. Samples
Test samples were ophthalmic solution prepared in-house and purchased from the local market with composition of 2.0 mg/mL of sodium hyaluronate. Other test samples used were accelerated stability samples with similar composition.
2.5. Solution preparation
2.5.1. Sodium hyaluronate standard solution
Standard solutions were prepared by transferring accurately about 80.0 mg of sodium hyaluronate reference standard to a 200 mL volumetric flask. A 150 mL portion of mobile phase was added initially and stirred on a magnetic stirrer until it dissolved. The solution was diluted to volume with the mobile phase and mixed.The solution was filtered through 0.45 μm membrane filter and 10 μL was injected.
2.5.2. Estimation from formulations
Contents of five containers of ophthalmic solutions, containing sodium hyaluronate 2.0 mg/mL, were transferred to a 100 mL beaker. From this, a 5 mL portion of analyte was transferred to a 25 mL volumetric flask. Initially 10 mL of mobile phase was added and shaken by hand for few minutes to extract and solubilize sodium hyaluronate and made to the volume with mobile phase. The solution was filtered through 0.45 μm membrane filter and 10 μL was injected directly on to the column.
2.6. Quantitation

Fig.1 (A)Mobile phase:0.01 M phosphoric acid,pH adjusted to 3.0 using 10% potassium hydroxide, flow rate 0.50 mL/min, column,ultrahydrogel,300 mm×7.8 mm,1000 Å and detector wavelength set at 205 nm.(B)Mobile phase:0.1 M ammonium dihyrogen phosphate,flow rate 0.50 mL/min, column, ultrahydrogel, 300 mm×7.8 mm,1000 Å and detector wavelength set at 205 nm.


Fig.2 Effect of pH on retention time,detection response(peak area)and efficiency (as shown as plate number N/column) of sodium hyaluronate. Column, BioSep SEC S2000, 300 mm×7.8 mm, mobile phase: 0.05 M potassium hydrogen phosphate, pH adjusted to shown below using potassium hydroxide(10%solution),flow rate of l.0 mL/min,wavelength set at 205 nm and injection volume 10 μL.

Fig.3 Effect of buffer on detection response(peak area)and capacity factor of sodium hyaluronate. Column, BioSep SEC S2000,300 mm×7.8 mm, mobile phase: buffer (potassium hydrogen phosphate) at varied concentration as shown in below, pH adjusted to 7.0 using potassium hydroxide (10% solution), flow rate of l.0 mL/min,wavelength set at 205 nm and injection volume 10 μL.
Peak areas were recorded for sodium hyaluronate peak. The peak areas were taken into account to quantitate the label amount, in percentage, of the ophthalmic solution by using the following formula:where Ru is peak area obtained from sodium hyaluronate in the test solution;Rs is the peak area obtained from sodium hyaluronate in the standard solution; C is the weight, in mg, of sodium hyaluronate reference standard taken to prepare standard solution;LC is the label claim, in mg, of the test sample; P is purity of sodium hyaluronate reference standard.
3. Results and discussion
3.1. Chromatography
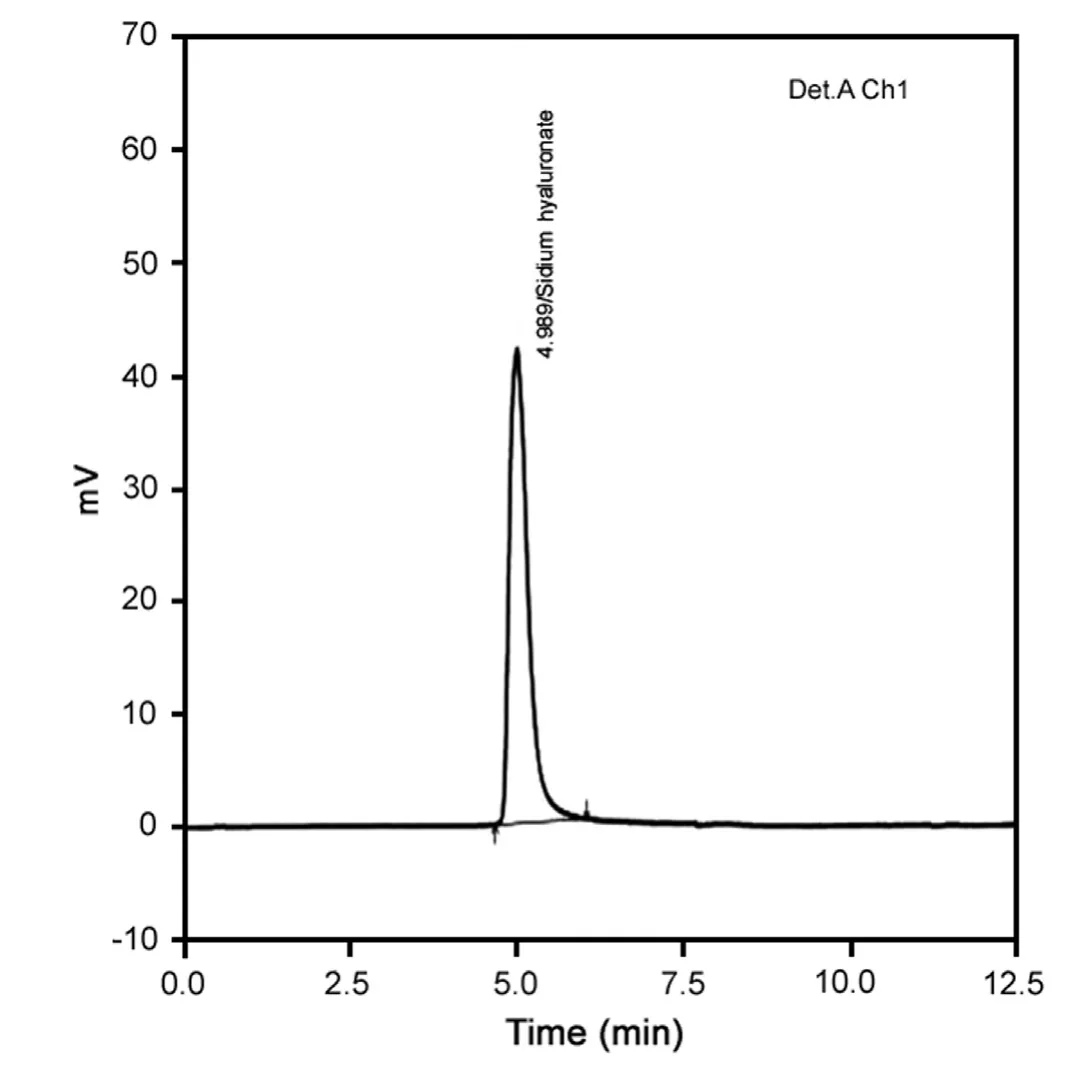
Fig.4 A typical HPLC chromatogram of sodium hyaluronate.Mobile phase: 0.05 M potassium dihydrogen phosphate, pH adjusted to 7.0 using potassium hydroxide (10% solution). Column, BioSep SEC S2000, 300 mm×7.8 mm, flow rate of l.0 mL/min, wavelength was set at 205 nm and injection volume 10 μL.
Chromatographic system comprising mixture of 0.01 M dibasic sodium phosphate, monobasic sodium phosphate and 0.02%sodium azide, as mobile phase at a constant flow rate of 0.5 mL/min, ultrahydrogel, 300 mm×7.8 mm, 1000 Å and ultrahydrogel 300 mm×7.8 mm, waters column as stationary phase in parallel and use of PDA detector resulted in no peak elution even after 60 min run time. Same chromatographic conditions were used as above with RI detector which resulted in peak elution with low response. 0.1 M aqueous potassium dihydrogen phosphate buffer,pH adjusted to 7.0 with 10% potassium hydroxide was tried and in isocratic conditions on the polysep-GFC-plinear 250 mm×4.6 mm column, to obtain symmetrical peak shapes and clear separation of the signal peaks from the solvent front peaks but it resulted in no peak elution.
Upon investigation of following chromatographic system containing 0.01 M phosphoric acid, pH adjusted to 3.0 using potassium hydroxide and 0.1 M ammonium dihydrogen phosphate solution as mobile phase at a constant flow rate of 0.50 mL/min,ultrahydrogel, 300 mm×7.8 mm, 1000 Å analytical column as stationary phase and detector wavelength at 205 nm resulted in peak elution at 3.2 min and 4.3 min respectively.
These investigations have resulted in very close elution of sodium hyaluronate to dead volume peak arising from diluents,shown in Fig.1A and B.
Further,in order to develop a suitable and robust LC method for the determination of sodium hyaluronate by UV detection different mobile phases and columns were employed to achieve the best signal response and retention time. Finally, the mobile phase consisting of 0.05 M potassium dihydrogen phosphate, pH adjusted to 7.0 using potassium hydroxide (10%) at a constant flow rate of 1.0 mL/min and detector wavelength set at 205 nm,using a BioSep SEC S2000 300 mm×7.8 mm,column was found to be appropriate, allowing good signal response of sodium hyaluronate.
3.2. Optimization of HPLC
The pH of the mobile phase can affect the analyte's retention time as well as the detection sensitivity. Fig.2 shows the results of retention, detection response (peak area) and efficiency (shown as plate number N/column) of sodium hyaluronate at different pH.The optimal pH 7.0 was chosen for the determination of sodium hyaluronate.Concentration of buffer is another factor that can alter the ion-pair formation. Fig.3 shows the retention and response as the concentration of buffer is varied. Low signal response was observed when a concentration less than 0.05 M potassium dihydrogen phosphate was used. This may be due to highlyaqueous environment which is unfavorable for ion-pairing. Therefore, potassium dihydrogen phosphate at pH 7.0 was chosen for estimation of sodium hyaluronate. Typical chromatogram of test solution is shown in Fig.4.

Table 1 Accuracy data: analyte recovery (sodium hyaluronate).
3.3. Method validation
Test method for the determination of sodium hyaluronate was validated to include the essential demands of International Conference on Harmonization (ICH) guidelines [29]. Parameters like specificity, linearity, accuracy, precision, range, robustness and system suitability were examined.
3.3.1. Specificity
No interferences were observed due to obvious presence of excipients like sodium dihydrogen phosphate, disodium hydrogen phosphate and sodium chloride.
3.3.2. Linearity
Peak areas versus concentration in milligram per milliliter were plotted for sodium hyaluronate at the concentration range between 80.0 and 120.0% of target level. Sodium hyaluronate showed linearity in the range of 0.32—0.48 mg/mL, respectively. Linear regression equations and correlation coefficient (r2) are provided below: Ysodiumhyaluronate=124908.2x-101,658 (r2=0.999910).
3.3.3. Accuracy
Accuracy of the proposed HPLC determination was evaluated from the assay results of the components. Accuracy was done by performing the assay of samples and calculated the peak area responses of different samples by recovery method.
Appropriate portions of stock solution were spiked into blank placebo matrix to produce concentration of 80.0 to 120.0% of target level. Mean recovery of spiked samples was 99.30% for sodium hyaluronate shown in Table 1.
3.3.4. Precision
Instrumental precision was determined by six replicate determinations of standard solution, relative standard deviation was calculated and found to be 0.49% for sodium hyaluronate.

Table 2 System suitability parameters of the proposed method.
Method precision or intra-assay precision was performed by preparing six different samples from the same sample pool. Each solution was injected in triplicate under the same conditions and mean value of peak area response for each solution was taken.The relative standard deviation of sodium hyaluronate in six sample solutions was calculated.Relative standard deviations obtained for sodium hyaluronate was 0.51%.
Intermediate precision was performed by analyzing the samples by two different analysts employing different instruments. Standard solution and six different samples at 100%target level were prepared by each analyst. Relative standard deviation obtained from 12 assay results by two analysts was 0.61% for sodium hyaluronate.
3.3.5. Range
Range of a method is defined as the lower and higher concentrations for which the method has adequate accuracy, precision and linearity.To demonstrate the range, six samples each of lower concentration(80%of target level)and higher concentration(120%of target level)were prepared similar to accuracy samples by spiking the drug substance into blank matrix (placebo). Each sample was analyzed in duplicate. At lower concentration, mean recovery of sodium hyaluronate was found to be 99.42%. Relative standard deviation obtained from these determinations was found to be 0.68% for sodium hyaluronate. At higher concentration, mean recovery of sodium hyaluronate was found to be 100.08%. Relative standard deviation obtained at the higher concentration level was found to be 0.49%
3.3.6. Robustness
Robustness of the proposed method was performed by keeping chromatographic conditions constant with following deliberate variations.
i. Change in column temperature.
ii. Changing flow rate from 1.0 to 1.2 mL/min.Standard solution was injected six times in replicate for each minor change. System suitability parameters like peak asymmetry, theoretical plates, capacity factor and relative standard deviation were recorded for sodium hyaluronate peak and found to be within acceptable limits.
Six test samples at the target concentration level were prepared and analyzed for each change. Recoveries and relative standard deviations were calculated for sodium hyaluronate during each change and found to be 98.90—100.52% and less than 1.0 respectively. It was noted during the experiments that slight change in column temperature or flow rate does not affect the method and produces results with of similar system suitability.
3.3.7. System suitability
System suitability tests were performed to chromatograms obtained from standard and test solutions to check parameters such as peak retention, column efficiency, peak asymmetry andcapacity factor of sodium hyaluronate peak.Results obtained from six replicate injections of standard solution as per the proposed method are summarized in Table 2.
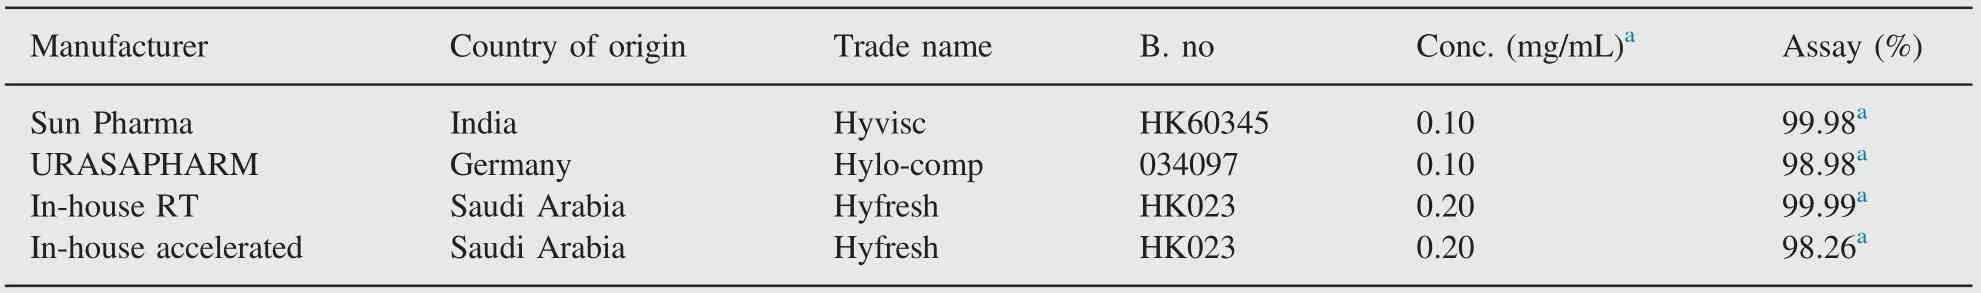
Table 3 Application of the developed HPLC method for the determination of sodium hyaluronate.
3.4. Application of the proposed method
In-house prepared samples, marketed samples and samples stored at accelerated stability conditions (40°C/25%RH) were evaluated for assay of sodium hyaluronate. The method gave reproducible results of assay for all the samples tested for sodium hyaluronate.There was no interference observed in the estimation of test samples since the peak eluted at a reasonable retention time. The excipients in ophthalmic solution of sodium hyaluronate as a result of accelerated storage did not interfere with the estimation of the component. The assay of test samples (RT and accelerated) and market samples are summarized in Table 3.
4. Conclusion
A size exclusion liquid chromatography method based on UV detection has been developed and validated for determination of sodium hyaluronate in pharmaceutical formulations (ophthalmic solution). The method is specific, simple, rapid, accurate, precise(RSD<2.0%) and linear r2=0.9999. The described method is suitable for routine quality control and stability studies.
Acknowledgment
The authors wish to thank Mr. Noor Sherrif, Mr. Anwer Saeed,Mr. Mahmood Jamjoom and colleagues in Jamjoom Pharma for their inspiration and motivation, which together are the true formulas for writing the scientific manuscript.
[1] J.H. Poulson, Urine and tissue glycosaminoglycan and their interactions, Dan. Med. Bull. 33 (1975) 75—96.
[2] J.R.E. Frasher, T.C. Laurent, UBG Laurent, Hyaluronan: its nature,distribution,function and turnover,J.Intern.Med.242(1997)27—33.
[3] R. Sten, Hyaluronan catabolism: a new metabolic pathway, Eur. J.Cell Biol. 83 (7) (2004) 317—325.
[4] K. Sugahara, N.B. Schwartz, A. Dorfma, Biosyntheses of hyaluronic acid by streptococcus, J. Bio. Chem. 254 (14) (1979) 6252—6261.
[5] M.R. Wessels, A.E. Moses, JB Goldberg, et al., Hyaluronic acid capsule is a virulence factor for mucoid group A streptococci, Proc.Natl. Acad. Sci. 88 (19) (1991) 8317—8321.
[6] H.M. Schrager, J.G. Rheinwald, M.R. Wessels, Hyaluronic acid capsule and the role of streptococcal entry into keratinocytes in invasive skin infection, J. Clin. Invest. 98 (9) (1996) 1954—1958.
[7] H. Saari, Differential effects of reactive oxygen species on native synovial fluid and purified human umbilical cord hyaluronate,Inflammation 17 (1993) 403—415.
[8] P.Algvere,Intravitreal injection of high molecular weight hyaluronic acid in retinal detachment surgery: a preliminary report, Acta Ophthalmol. 49 (1971) 975—976.
[9] Size-Exclusion Chromatography of Polymers, Encyclopedia of Analytical Chemistry, R.A. Meyers (Ed.), John Wiley & Sons Ltd., 2000,pp. 1—26.
[10] A. Medvedovici, A. Farca, V. David, Derivatization reactions in liquid chromatography for drug assaying in biological fluids, Adv.Chromatogr. 47 (2009) 283—314.
[11] N. Volpi, On-line HPLC/ESI-MS separation and characterization of hyaluronan oligosaccharides from 2-mers to 40-mers,Anal.Chem.79(16) (2007) 6390—6397.
[12] K.Kakehi,M.Kinoshita,S.Yasueda,Hyaluronic acid:separation and biological implications, J. Chromatogr. B: Anal. Technol. Biomed.Life Sci. 797 (12) (2003) 347—355.
[13] L.J.Bao,J.C.Yang,Z.H.He,et al.,Zymohydrolysis with chondroitinase ABC and high performance liquid chromatography used for the determination of hyaluronic acid in shark fin, Se Pu 20 (6) (2002) 557—559.
[14] I. Koshiis, M. Takenouchi, T. Hasegawa, T. Imanari, Enzymatic method for the simultaneous determination of of hyaluronan and chondroitin sulfates using high-performance liquid chromatography,Anal. Biochem. 265 (1) (1998) 49—54.
[15] R.J.Midura,A.Salustri,A.Calabro,et al.,High-resolution separation of disaccharide and oligosaccharide alditols from chondroitinsulphate,dermatan sulphate and hyaluronan using CarboPac PA1 chromatography, Glycobiology 4 (3) (1994) 333—342.
[16] M. Nurminen, A. Dejmek, G. Mårtensson, et al., Clinical utility of liquid-chromatographic analysis of effusions for hyaluronate content,Clin. Chem. 40 (5) (1994) 777—780.
[17] U.M.Agren,R.Tammi,M.Tammi,A dot-blot assay of metabolically radiolabeled hyaluronan, Anal. Biochem. 217 (2) (1994) 311—315.
[18] H.Akiyama,S.Shidawara,A.Mada,et al.,Chemiluminescence highperformance liquid chromatography for the determination of hyaluronic acid, chondroitin sulphate and dermatan sulphate, J. Chromatogr.579 (2) (1992) 203—207.
[19] H. Saari, R.M. Tulamo, Y.T. Konttinen, et al., Methyl prednisolone acetate induced release of cartilage proteoglycans: determination by high performance liquid chromatography, Ann. Rheum. Dis. 51 (2)(1992) 214—219.
[20] E. Orviský, M. Kéry Vand Stanciková, Specific high performance liquid chromatographic determination of the molecular weight and concentration of hyaluronic acid in complex mixtures by labeled hyaluronate binding proteins,Biomed.Chromatogr.5(6)(1991)251—255.
[21] H.Akiyama,H.Toyoda,S.Yamanashi,et al.,Microdetermination of hyaluronic acid in human urine by high performance liquid chromatography, Biomed. Chromatogr. 5 (5) (1991) 189—192.
[22] M. Zebrower, F.J. Kieras, J. Heaney-Kieras, High pressure liquid chromatographic identification of hyaluronic acid and chondroitin sulphate disaccharides, Glycobiology 1 (3) (1991) 271—276.
[23] E. Paya, J.Y. Jouzeau, F. Lapicque, et al., Assay of synovial fluid hyaluronic acid using high-performance liquid chromatography of hyaluronidase digests, J. Chromatogr. 566 (1) (1991) 9—18.
[24] D.M.Whitfield,S.Stojkovski,H.Pang,et al.,Diagnostic methods for the determination of iduronic acid in oligosaccharides, Anal. Biochem. 194 (2) (1991) 259—267.
[25] N.S. Fedarko, J.D. Termine, P.G. Robey, High-performance liquid chromatographic separation of hyaluronan and four proteoglycans produced by human bone cell cultures, Anal. Biochem. 188 (2)(1990) 398—407.
[26] N. Motohashi, I. Mori, Quantitation of hyaluronic acid and chondroitin sulphates in rabbit synovial fluid by high-performance liquid chromatography of oligosaccharides enzymatically derived thereof,Chem. Pharm. Bull. 38 (3) (1990) 769—773.
[27] T. Gherezghiher, M.C. Koss, R.E. Nordquist, et al., Rapid and sensitive method for measurement of hyaluronic acid and isomeric chondroitin sulfates using high-performance liquid chromatography,J. Chromatogr. 413 (1987) 9—15.
[28] D.Murphy,C.A.Pennock,K.J.London,Gas—liquid chromatographic measurement of glucosamine and galactosamine content of urinary glycosaminoglycans, Clin. Chim. Acta 53 (2) (1974) 145—152.
[29] ICH Harmonized Tripartite Guideline, International Conference on Harmonization onTechnical Requirements for Registration of Pharmaceuticals for Human Use, Q2A, Text on Validation of Analytical Procedures, Step 4 of the ICH process (1994) and Q2B,Validation of Analytical Procedures:Methodology,Step 4 of the ICH process,ICH Steering Committee (1996) International Conference on Harmonization, Geneva, Switzerland.
 Journal of Pharmaceutical Analysis2013年5期
- Journal of Pharmaceutical Analysis的其它文章
- A novel and rapid microbiological assay for ciprofloxacin hydrochloride
- Copper interactions with DNA of chromatin and its role in neurodegenerative disorders
- A critical quality parameter in quantitative fused-core chromatography: The injection volume
- Application of LC-MS/MS for quantitative analysis of glucocorticoids and stimulants in biological fluids
- In situ modified screen printed and carbon paste ion selective electrodes for potentiometric determination of naphazoline hydrochloride in its formulation
- Kinetic performance comparison of fully and superficially porous particles with sizes ranging between 2.7 μm and 5 μm: Intrinsic evaluation and application to a pharmaceutical test compound