
Changes in daily climate extremes in Xinjiang,northwestern China
2013-12-15 05:55WenWenWang
WenWen Wang
Department of Mathematic,Xinjiang University,Urumqi,Xinjiang 830046,China
1 Introduction
Changes in frequency or intensity of extreme weather and climate events would exert profound impacts on both human society and the natural environment (Easterlinget al.,2000;Zhanget al.,2009,2010),e.g.,"in early 2005,worst snowfall in the last two decades blanketed northwest Asia killing hundreds of people in Tajikistan,Pakistan,India and Afghanistan." What are extreme weather and climate events?IPCC 2001 definition of the extreme weather event is:"An extreme weather event is an event that is rare within its statistical reference distribution at a particular place.Definitions of ′rare′ vary,but an extreme weather event would normally be rare as or rarer than the 10th or 90th percentile."The statistical analysis of extreme events is a prerequisite,which plays an important role for climate disasters assessment and decision making.An analysis of extreme climate events may improve assessment of drought and flood forecast which is influential in water resources management.Many studies revealed changes in intensity and frequency of weather extremes across the globe (Colomboet al.,1999;Kharin and Zwiers,2000;IPCC,2001,2007;Goldsteinet al.,2003;Zhanget al.,2008).By analyzing the trends of annual precipitation values,Karlet al.(1996) reported an increase in the frequency of high intensity precipitation events across the United States over the period of 1910 to 1996.Hyung and Slobodan (2012) reported that climate change may affect magnitude and frequency of regional extreme events with a possibility of serious impacts on existing infrastructure systems.In China,since the 1990s,the occurrence of floods in the seven large river valleys is of high frequency,and both flood and geological disasters increased due to an increase of intense precipitation events and the consequential increase of their concentration degree (e.g.,Zhanget al.,2008).The changes of spatial and temporal concentration degree and variation of heavy precipitation in China were the major possible reasons for the frequent flood disasters (Xieet al.,2005;Zhanget al.,2008,2009).Jianget al.(2002a,b;2004;2005) and Jiang and Yang (2004) indicated an increase of droughts and floods in the Xinjiang region and this observation is in good agreement with changing properties of floods and droughts in China and the world.Shiet al.(2003)showed that regional climate in northwestern China exhibited a climate shift from warm-dry to warm-wet states over the last two decades while the globe is in a warming process.Flood and drought will potentially increase,enhance and intensify in the 21st century in Xinjiang as a result of global warming (Xu,1997;Jianget al.,2004;Zhanget al.,2008).
The objective of this paper was to estimate variations and trends of extreme precipitation in Xinjiang based on daily precipitation,maximum and minimum temperature datasets covering 1960-2008.The present study aims to analyze changes of extreme climate indices,which were based on precipitation percentile thresholds and suggested for general use by the R packages RClimDex.It is believed that this current study is very necessary to understand extreme climate index changes and possible implications for flood and drought changes in the study region under the impact of changing climate.
2 Data and methods
Daily precipitation,maximum and minimum temperatures are provided by National Meteorological Information Center,China Meteorological Administration (CMA).Calculation of indices is facilitated using information provided by ETCCDI (see http://cccma.seos.uvic.ca/ETCCDI for available calculated station-level indices) (see Peterson and Manton,2008 and Youet al.,2011).The daily precipitation dataset at 48 stations across Xinjiang covering 1961-2008 was provided by the National Climatic Centre of China,China Meteorological Administration.Figure 1 shows the locations of the 48 meteorological stations.Quality control of the dataset has been conducted by the aforementioned institution before its release,and homogeneous detection for the dataset has also been performed by the RHTestsV3 package(http://cccma.seos.uvic.ca/ETCCDMI/software.shtml).Stations with missing precipitation data of more than one year was excluded from the dataset and daily precipitation data at 38 stations are analyzed in this study.Figure 2 presents the mean annual temperature and precipitation during 1961-2008 in Xinjiang.It can be seen from Figure 2 that the temperature is generally higher in southern Xinjiang,but precipitation is generally higher in most regions,especially northwestern Xinjiang.
Data quality control and homogeneity assessment were attained using the RClimDex software package (http://cccma.seos.uvic.ca/ETCCDI/software.shtml).Precipitation data is much more difficult for quality control than data of other climatic parameters (Kruger,2006),e.g.,temperature,mainly because of the relatively poor spatial correlation of daily precipitation amounts.The RHTestV3 software,developed at the Climate Research Branch of Meteorological Service of Canada (available from the ETCCDI website),was applied to assess data homogeneity.It is based on a two-phase regression model applying a linear trend for the parameter in question to identify potential inhomogeneities(Wang and Swail,2001).
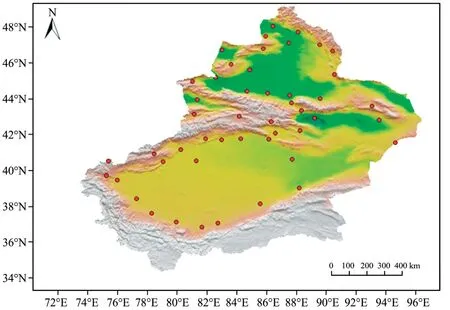
Figure 1 The distribution of 48 precipitation stations across Xinjiang,China
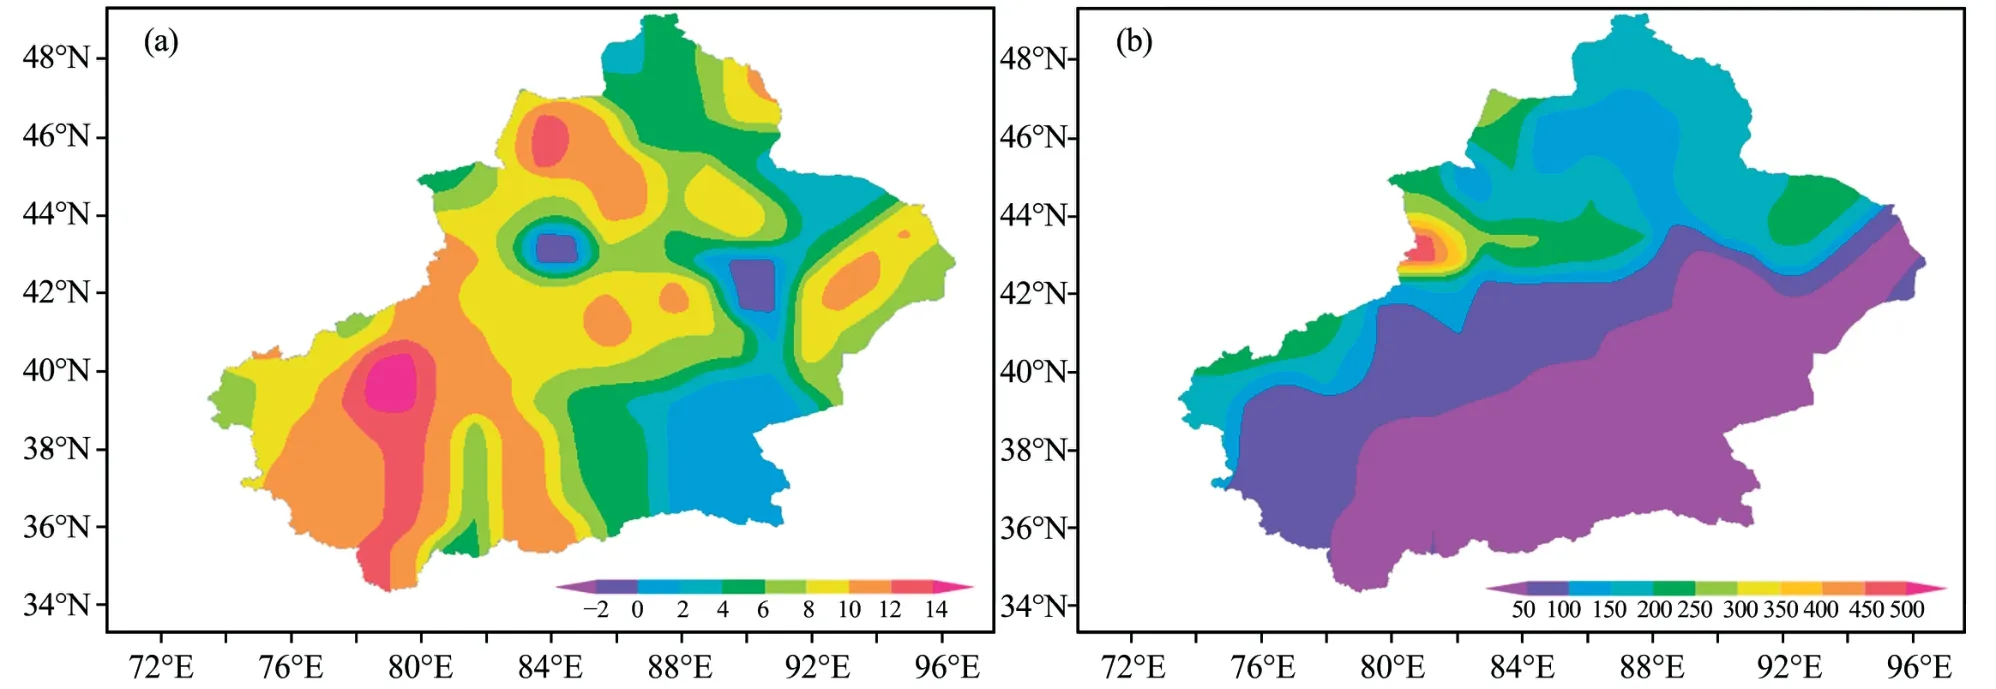
Figure 2 Mean annual (a) temperature (°C) and (b) precipitation (mm) during 1961-2008 in Xinjiang
We applied twelve temperature and six precipitation indices (http://cccma.seos.uvic.ca/ETCCDI) in this study (Table 1).All the indices are calculated by RClimDex.The indices were chosen primarily for assessment of the many aspects of a changing global climate which include changes in intensity,frequency and duration of temperature and precipitation events (Alexanderet al.,2006).Alexanderet al.(2006) divided the indices we have chosen into five different categories:(1) percentile-based indices,such as occurrence of cold nights (TN10),(2) absolute indices represent maximum or minimum values within a season or year,such as daily maximum temperature (TXx) and maximum 1-day precipitation amount (RX1day),(3) threshold indices defined as the number of days on which a temperature or precipitation value falls above or below a fixed threshold,such as the number of frost days (FD),(4) duration indices which define periods of excessive warmth,cold,wetness or dryness (or in the case of growing season length,periods of mild),such as consecutive dry days (CDD),(5) other indices,such as diurnal temperature range (DTR).

Table 1 Definitions of twelve temperature indices and six precipitation indices used in this study
3 Result and discussion
3.1 Temperature
The annual mean maximum and minimum temperatures over the Xinjiang region have increased by 0.25 °C/decade and 0.52 °C/decade during 1961-2008,respectively (as shown in Figure 2).These increase rates are greater than the warming rate of global mean surface temperature(0.13-0.03 °C/decade) over a 50-year period from 1956 to 2005 (IPCC,2007).According to analyses of seasonal change rates,the increasing rates of average maximum and minimum temperatures over the Xinjiang region in winter are greater than those in summer.In winter,the rates of increase of maximum and minimum temperatures over the Xinjiang region are 0.32 and 0.70 °C/decade,respectively,whereas the corresponding increases of maximum and minimum temperatures in summer are 0.17 and 0.43 °C/decade,respectively.The increase rate of minimum temperature is generally greater than that of maximum temperature in both summer and winter,indicating larger changes in mean temperatures exist at night than in day time.
Figure 3 presents the spatial distribution pattern of the temporal trends in cold extremes for the 38 meteorological stations and Figure 4 demonstrates the regional annual series for indices in Xinjiang during 1961-2008.Table 2 shows the number of stations with negative,no-trend and positive trends for cold extremes indices.Numbers of stations passing the significant level are also presented in Table 2.Regional averages are calculated as an arithmetic mean of values at all stations in the study.For cold days (TX10) and cold nights(TN10),about 95% and 97% of stations have decreasing trends,respectively.Figures 3a and 3b show that stations in northern and western Xinjiang have larger trend magnitudes.
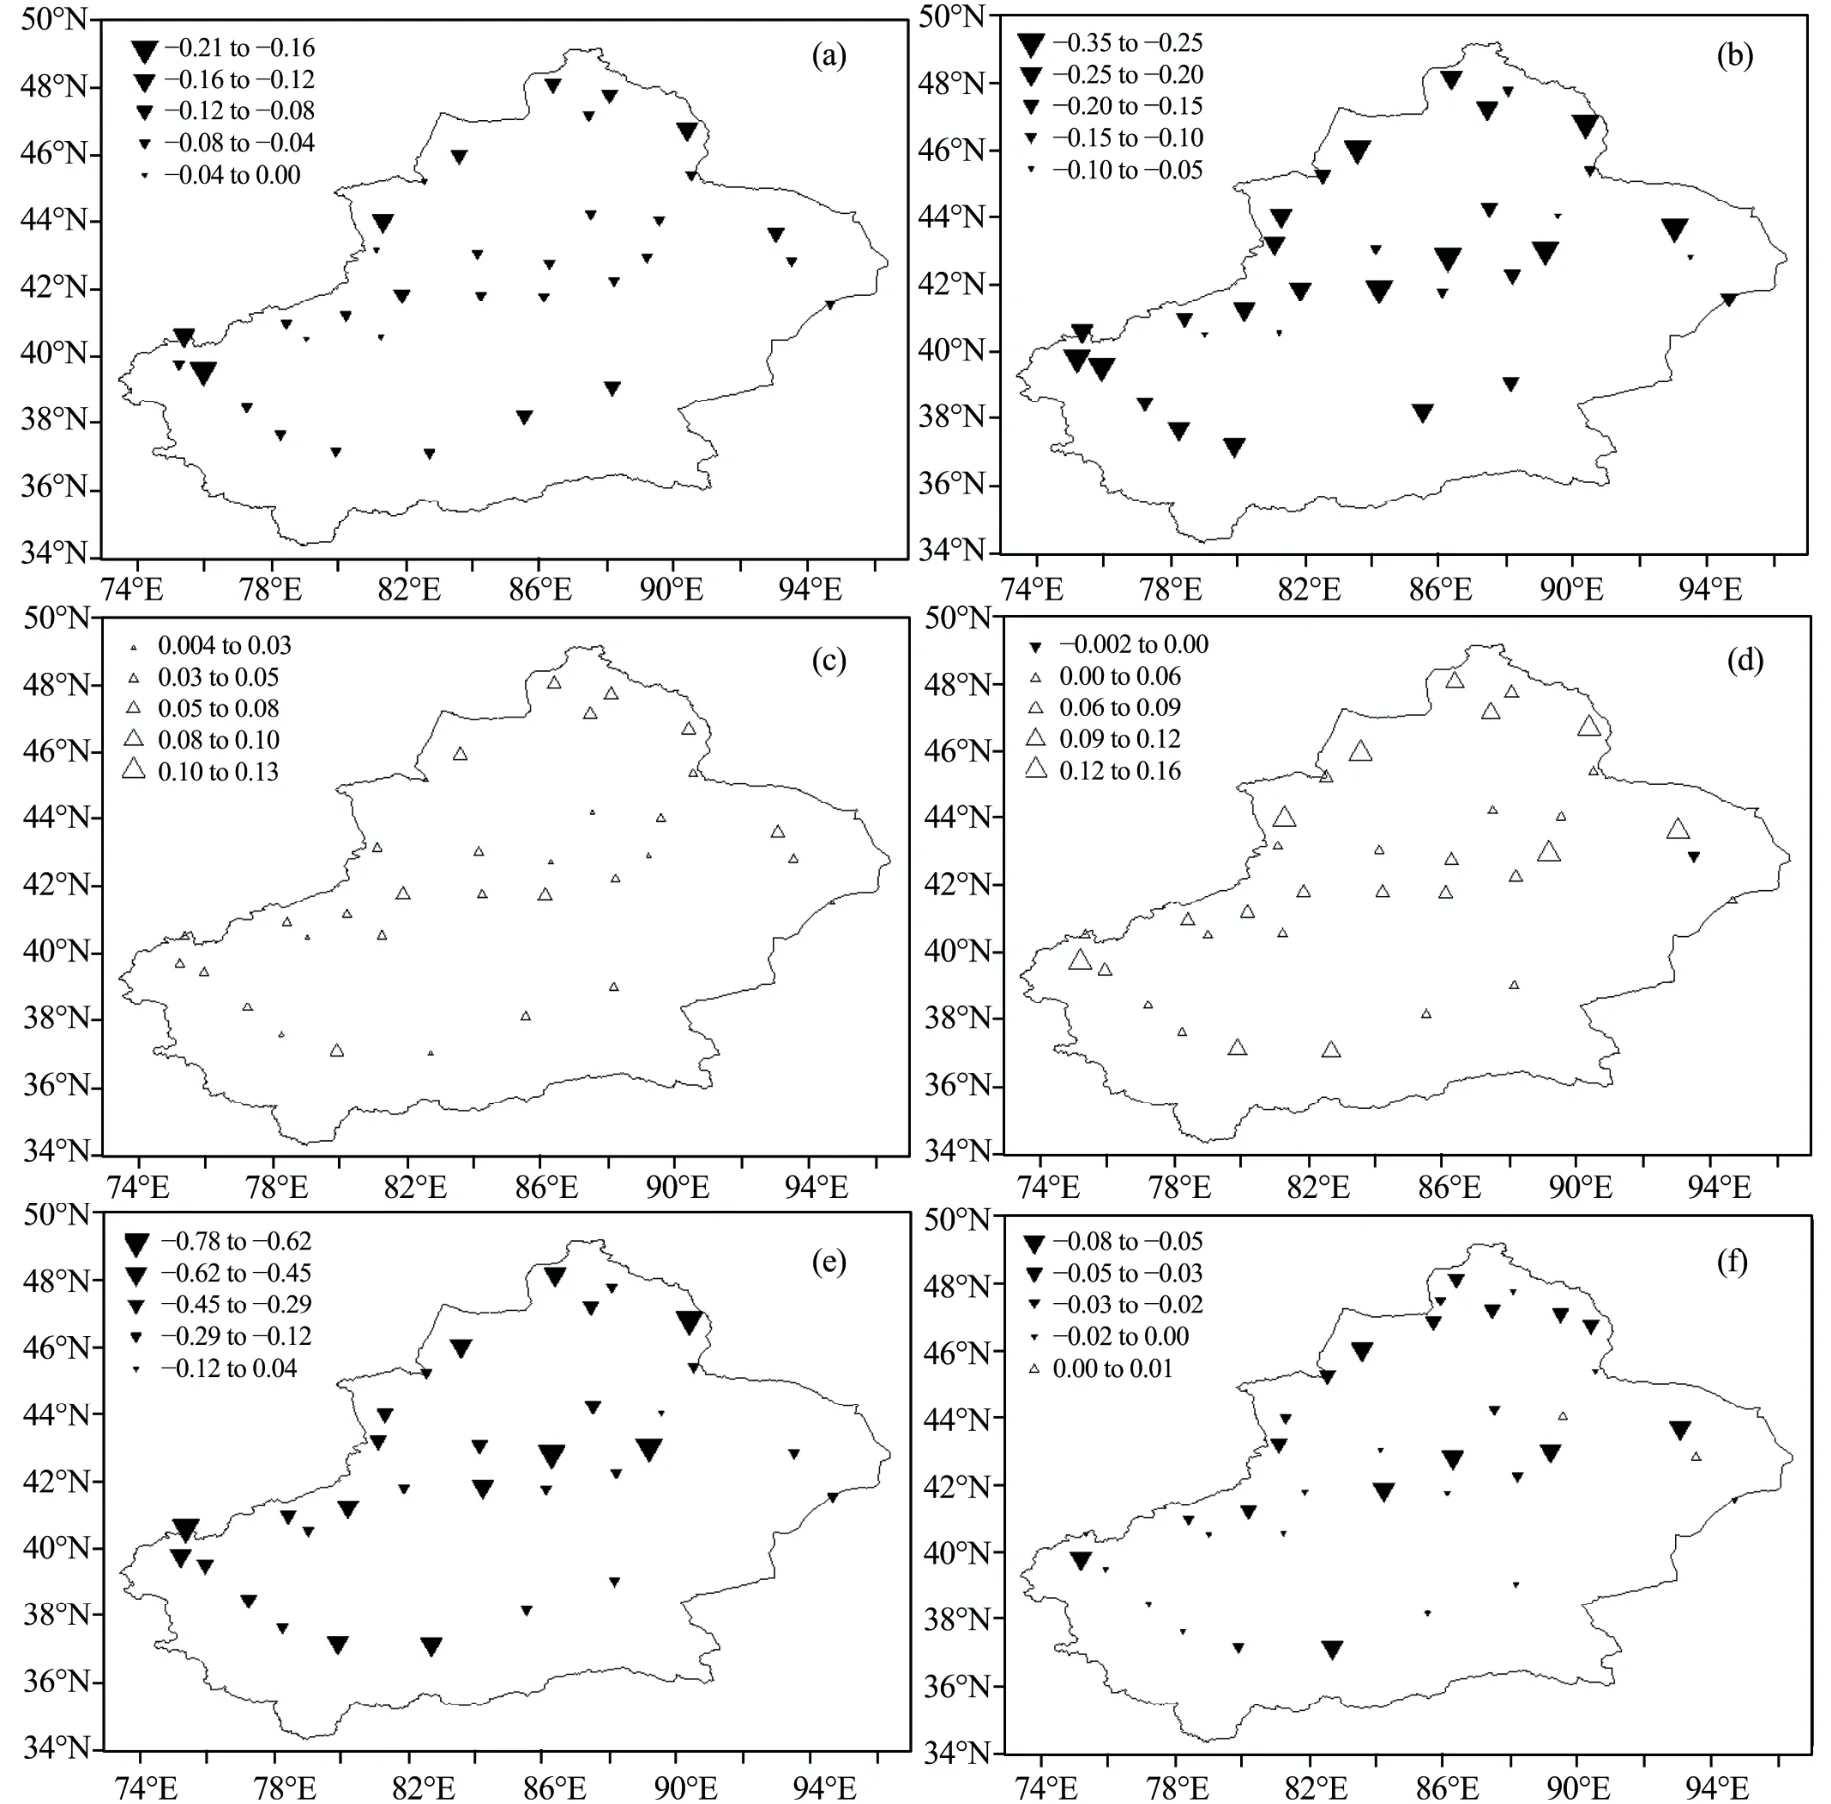
Figure 3 Spatial patterns of trends per decade during 1961-2008 in China for indices of cold extremes (a:TX10;b:TN10;c:TXn;d:TNn;e:FD and f:DTR).Positive/negative trends are shown as up/down triangles
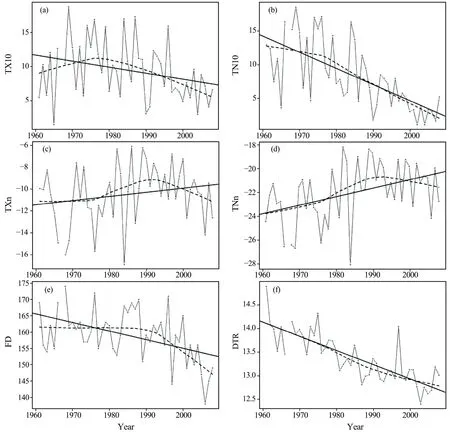
Figure 4 Regional annual series for indices of cold extremes (a:TX10;b:TN10;c:TXn;d:TNn;e:FD and f:DTR)
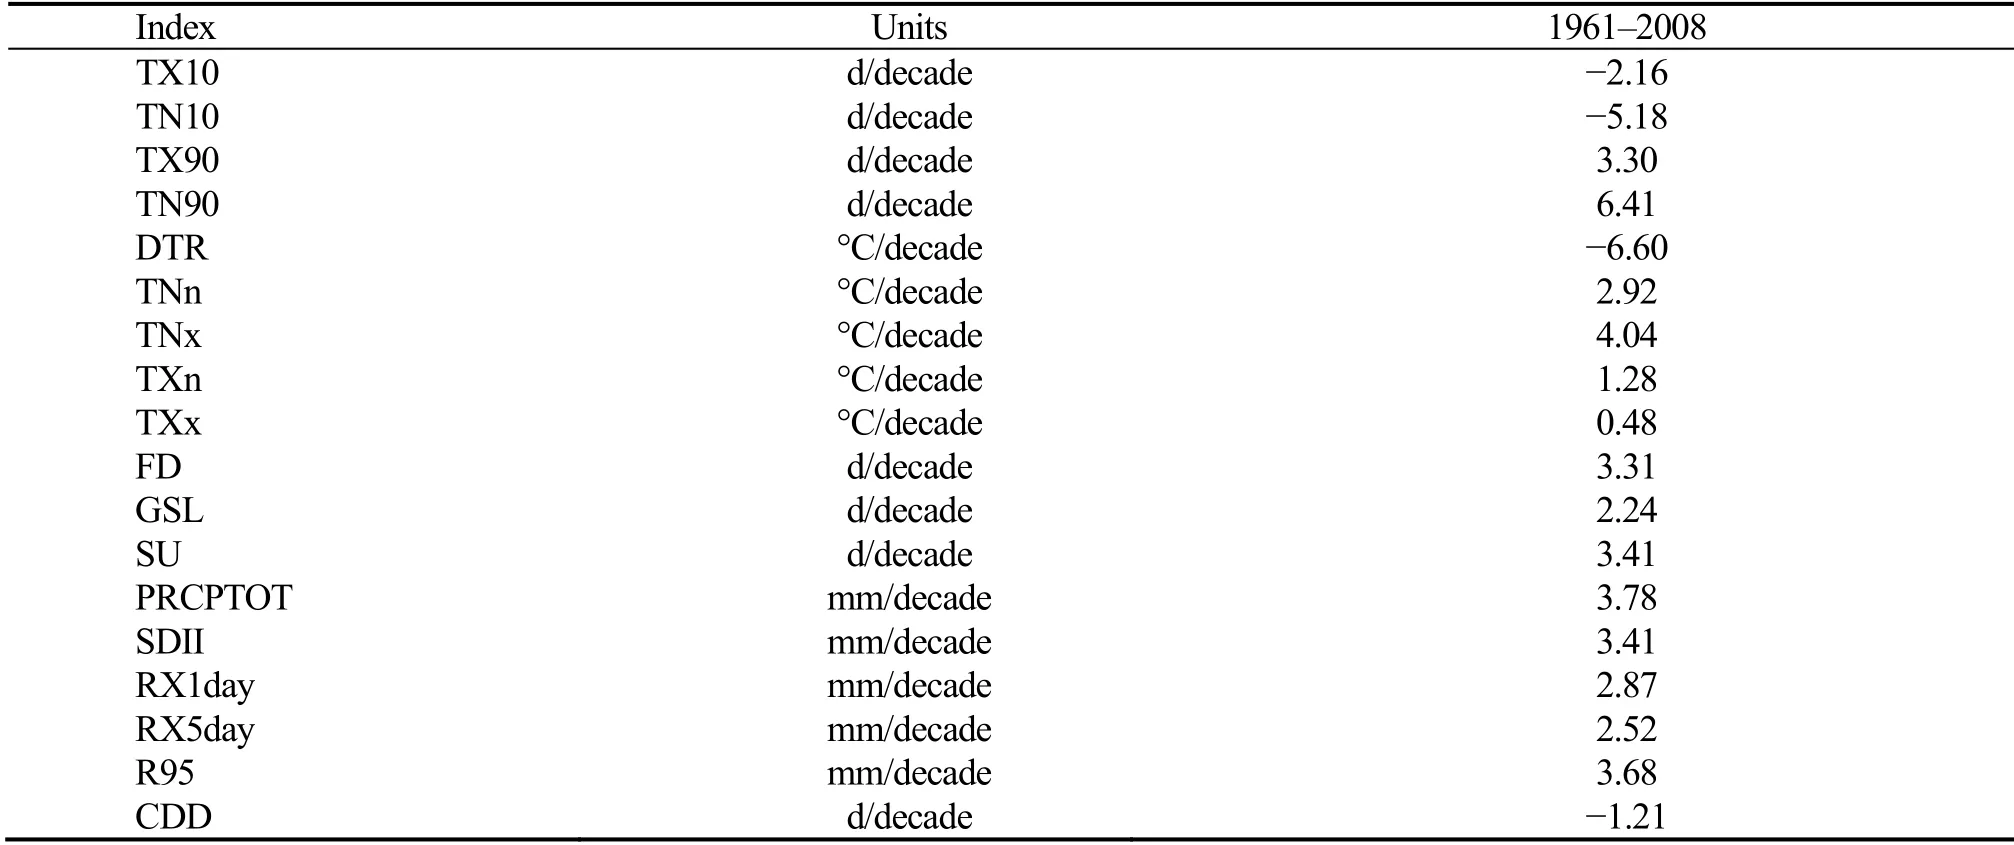
Table 2 Trends per decade for regional indices of temperature and precipitation extremes
Similarly,temperatures recorded on the coldest days and nights (TXn and TNn) in each year have also increased at approximately 97% and 89% of stations,respectively.Figures 3c and 3d show that stations situated in northeastern and northwestern Xinjiang show the largest changes.The number of frost days (FD) has also generally decreased during 1961-2008 with 81% of stations showing a significant decrease at the 0.05 level.Figure 3e shows that stations with larger trend magnitudes are again distributed in northwestern and central Xinjiang.About 86% of stations show a decreasing trend in DTR in China (Table 3).Diurnal temperature range shows that trend magnitudes tend to decrease from northwestern to southeastern Xinjiang (Figure 3f).
The temporal variability in regional cold indices is demonstrated in Figure 4.The variation of cold days (TX10)shows an increasing trend before 1975 and a strong decrease after that (Figure 4a).The cold nights (TN10) last a decreasing trend (Figure 4b).The mean trends for cold days and nights have decreased by-0.86 d/decade and-2.45 d/decade,respectively.Meantime,the coldest days (TXn) show decreasing trend before the 1970 and turn to an increasing trend after 1980,and show decreasing trend again after 1990 (Figure 4c).The coldest nights (TNn) show increasing trend before 1990 and turn to a decreasing trend after 1990 (Figure 4d).Regional trends in coldest days and nights are 0.43 °C/decade and 0.77 °C/decade,respectively.The frost days (FD) are in consistent declining trend during the period,especially show steep trend after 1990 (Figure 4e).Regionally,the mean trend of frost days is-2.54 d/decade.During the same period,the regional trend in diurnal temperature range (DTR) is-0.28 °C/decade,which drastically declines,especially before 1980 (Figure 4f).
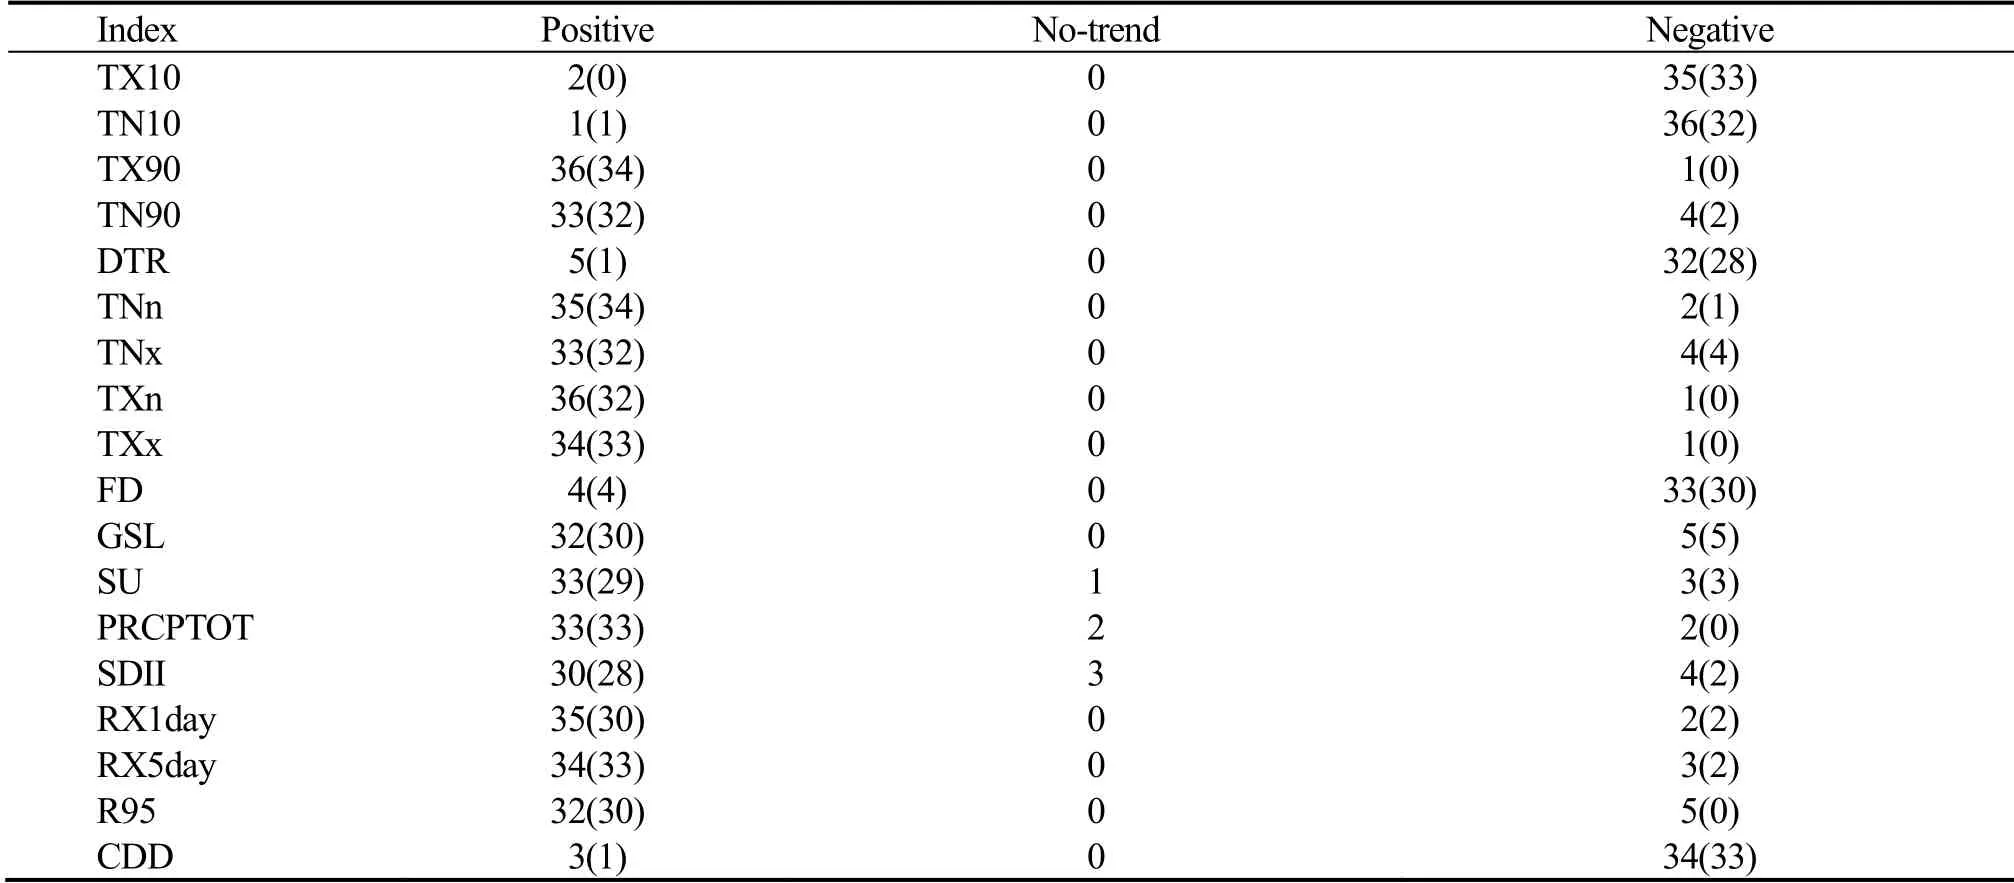
Table 3 Number of stations with positive (significant at the 0.05 level),non-trend,and negative (significant at the 0.05 level) trends for annual temperature and precipitation indices during 1961-2008
Regional changes in warm extremes during 1961-2008 are presented in Figure 5,and Figure 6 demonstrates the regional annual series for indices of warm extremes.
For warm days (TX90) and warm nights (TN90),97%and 4% of stations respectively show increasing trends.The distribution of TX90 and TN90 (Figures 5a and 5b) demonstrate that stations in southeastern and central Xinjiang have larger changing trend magnitude.The temperature of the warmest days (TXx) and the warmest nights (TNx) have also increased,around 92% and 97% of stations show an increase in TXx and TNx,with the largest changes in northwestern China (Figures 5c and 5d).For distribution of growing season length (GSL),about 86% of stations have positive changing trends (Figure 5e),with most stations showing larger trend magnitude.For summer days (SU),around 89% of stations show increasing trends,also with most stations having larger trend magnitude,and some stations show decreasing trends (Figure 5f).
In Figure 6,the regional trends for TX90 and TN90 indices are 1.62 (P<0.05) and 4.85 (P<0.05) d/decade,respectively.TXx fluctuated before 1990 but increased rapidly since then,while TNx has been continually increasing.The regional trends for these two indices are equivalent to-2.35 °C/decade (P>0.05) and 0.40 °C/decade (P<0.05).The regional trends for GSL and SU are 2.62 d/decade(P<0.05) and 2.82 d/decade (P<0.05),respectively.SU shows a gradual increase during the period of 1961-2008,while GSL shows little change until 1990.
Table 3 again shows comparative trends at individual sites.Compared with TX90,about 83% of stations have greater trend magnitudes in TN90,and approximately 64%of stations have greater trend magnitudes in TNx than in TXx.This again reinforces the enhanced nighttime warming in comparison with daytime.
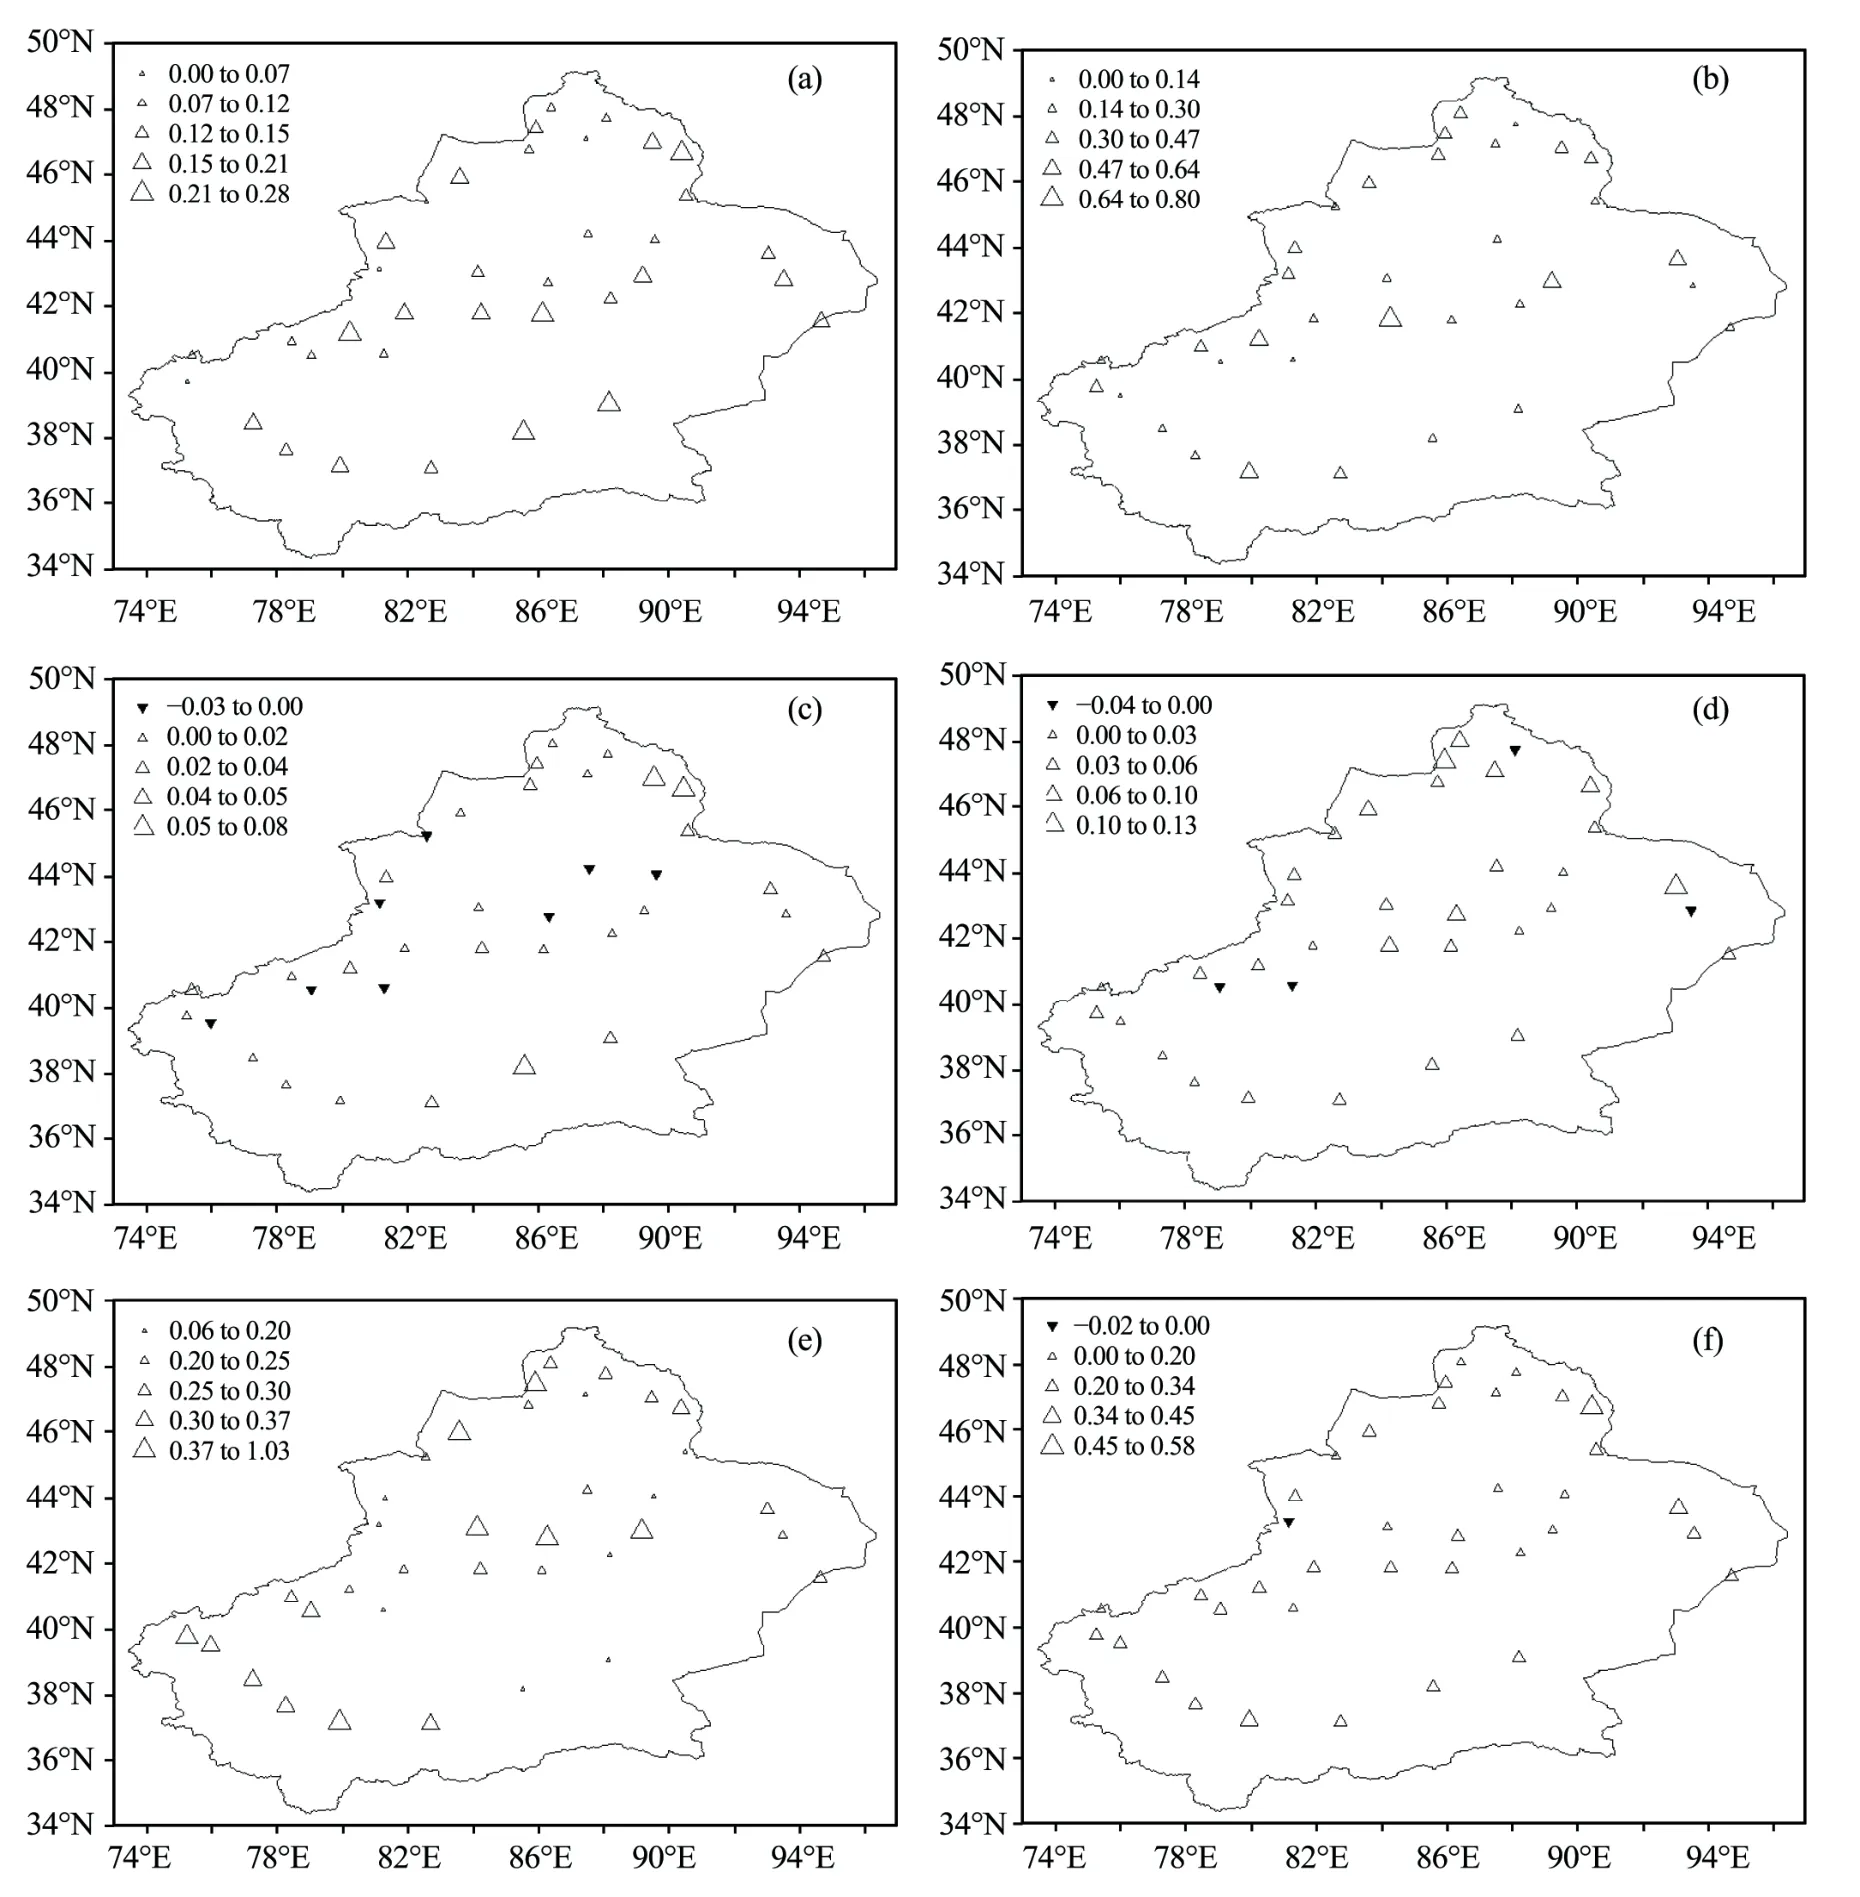
Figure 5 Spatial patterns of trends per decade during 1961-2008 in China for indices of warm extremes (a:TX90;b:TN90;c:TXx;d:TNx;e:GSL and f:SU).Positive/negative trends are shown as up/down triangles
We also compared the relative magnitudes of trends in warm versus cold indices,and some results are presented in Table 3.For TX90 versus TX10,72% of stations have larger trend magnitudes in TX90,and the regional trend in TX90(0.62 d/decade) is slightly more than 1.3 times that of TX10(-0.47 d/decade).For TN90 versus TN10,the regional trend in TN10 (-2.06 d/decade) is of greater magnitude than that of TN90 (1.75 d/decade),about 60% of stations having higher trend magnitudes in TN10 than in TN90.This means that during the day there is a tendency towards increased inter-diurnal variability.For TXx and TXn,however,the regional trend in TXn (0.35 °C/decade) is much higher than in TXx (0.07 °C/decade),and roughly 80% of stations show larger trends in TXn.TXn (which occurs in winter) warms faster than TXx (which occurs in winter) due to the rapid warming in winter,suggesting decreased daytime inter-diurnal variability when extremes are examined,in contradiction with the daytime percentile analysis.The regional trend in TNn (0.63 °C/decade) is three times of TNx (0.21 °C/decade),which is in agreement with the percentile analysis.At individual stations,about 93% of stations have greater trend magnitudes in TNn compared with TNx.In addition,changes in extremes based on daily minimum temperature (TN10 and TN90) are generally larger than changes in extremes based on daily maximum temperature (TX10 and TX90),and changes in minimum of daily minimum and maximum temperature (TNn and TXn) generally have higher trend magnitudes than that in maximum of daily minimum and maximum temperature(TNx and TXx).In most cases,both cold and warm extremes have high correlations with mean annual temperature,with correlation coefficients higher than 0.5,indicating that changes in temperature extremes can reflect general warming in Xinjiang.
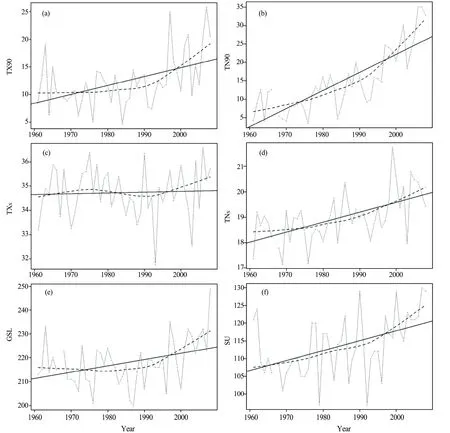
Figure 6 Regional annual series for indices of warm extremes (a:TX90;b:TN90;c:TXx;d:TNx;e:GSL;f:SU)
3.2 Precipitation
In a majority of cases,most precipitation indices suggest that both the amount and intensity of precipitation are increasing.For example,56% of stations have increasing trends in annual total precipitation (PRCPTOT),mostly occurring in southeastern,southwestern and northwestern Xinjiang.The 44% of stations with decreasing trends are situated in northeastern and middle Xinjiang.For SDII,RX1day,RX5day and R95,the proportion of stations with positive trends for these indices are 57%,58%,53% and 44%,respectively,and the proportion of stations with negative trends for these indices are 29%,42%,47% and 23%,respectively.Thus,there is a tendency towards positive trends dominating,consistent with the intensification of the hydrological cycle in Xinjiang.Stations in southern and northwestern Xinjiang have larger trend magnitudes while stations in northern and northeastern Xinjiang have lower trend magnitudes,which is in accordance with the spatial distribution of PRCPTOT trends.Changes in CDD further reinforce this pattern,with only 34% of stations having an increasing trend(mostly in southern Xinjiang) and 50% of stations (mainly in northern Xinjiang) having decreasing trends in CDD.
For Xinjiang as a whole,the trend in PRCPTOT is weak and non-significant,and shows an increase (3.21 mm/decade)consistent with other precipitation indices.Most of the change occurred during the late 1980s and 1990s.Four other regional indices also show increasing trends:average wet days precipitation (SDII),maximum 1-day precipitation(RX1day),maximum 5-day precipitation (RX5day) and total precipitation on extreme wet days (R95),although only R95 shows a statistically significant increasing trend (4.06 mm/decade).
The spatial distributions of trends and the regional annual series of precipitation indices are presented in Figures 7 and 8.From Figures 7 and 8,we find most precipitation indices suggest that both the amount and intensity of precipitation are increasing.Figure 7 shows that 95% of stations have increasing trends in annual total precipitation,mostly occurring in southwestern and northwestern Xinjiang.The 5% of stations with decreasing trends are situated in northeastern Xinjiang.For SDII,RX1day,RX5day and R95,the proportion of stations with positive trends for these indices are 82%,71%,79% and 92%,respectively,and the proportion of stations with negative trends for these indices are 18%,29%,21% and 8%,respectively.Changes in CDD further reinforce this pattern,with only 47% of stations having an increasing trend,mostly in eastern Xinjiang and 53%of stations (mainly in middle and northwestern Xinjiang)having decreasing trends in CDD.
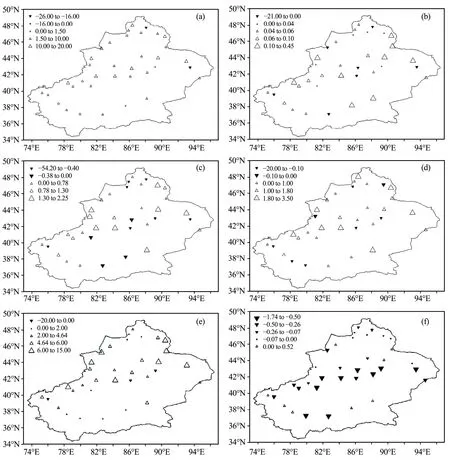
Figure 7 Spatial patterns of trends per decade during 1961-2008 in China for precipitation indices (a:PRCPTOT;b:SDII;c:RX1day;d:RX5day;e:R95 and f:CDD).Positive/negative trends are shown as up/down triangles
In Figure 8,the trend in PRCPTOT shows an increase(8.55 mm/decade) consistent with other precipitation indices.Four other regional indices also show increasing trends:average wet days precipitation (SDII),maximum 1-day precipitation (RX1day),maximum 5-day precipitation(RX5day) and total precipitation on extreme wet days (R95),although only R95 shows a statistically significant increasing trend (50.7 mm/decade).
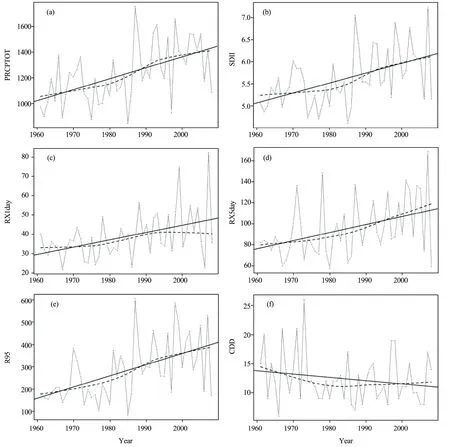
Figure 8 Regional annual series for precipitation indices (a:PRCPTOT;b:SDII;c:RX1day;d:RX5day;e:R95;f:CDD)
4 Conclusions
We have examined the spatial and temporal distribution of trends in climate extremes for 38 stations in Xinjiang over the period 1961-2008.We selected twelve indices of extreme temperature and six of extreme precipitation developed by the joint CC1/CLIVAR/JCOMM Expert Team on Climate Change Detection and Indices.
(1) All temperature-based indices show patterns consistent with a general warming trend (annual mean temperature has warmed by 0.8 °C/decade) and these changes are consistent with previous studies in other parts of the world.For the majority of stations,significant increases in warm nights/days and significant decreases in cold nights/days are observed during 1961-2008.Stations in northwestern Xinjiang have larger trend magnitudes,which are accordance with the more rapid mean warming in these regions.The mean trends for cold days and nights have decreased by-0.86 and-2.45 d/decade,respectively,and warm days and nights have increased by 1.62 and 4.85 d/decade,respectively.Over the same period,the number of frost days shows a statistically significant decreasing trend of-2.54 d/decade.The growing season length and number of summer days exhibit significant increasing trends at rates of 2.62 and 2.86 d/decade,respectively.The diurnal temperature range has decreased by-0.28 °C/decade.Both the annual extreme lowest and highest temperatures exhibit significant increasing trend,the former warming is faster than the latter.
(2) Some significant changes in Xinjiang precipitation that could be identified include regions that show increases and decreases in annual precipitation.Average wet day precipitation,maximum 1-day and 5-day precipitation,and heavy precipitation days show increasing trends,but only the last is statistically significant.A decreasing trend is found for consecutive dry days.
(3) This paper is first to use twelve temperature indices and six precipitation indices to report the extreme climate in Xinjiang.It is believed that the current study is very necessary to understand extreme climate index changes and possible implications for flood and drought changes in Xinjiang.
This work was supported by a special scientific research project (GYHY200706008) in the public welfare industry(meteorology);the "Western Light" Project (RCPY200902)of the Chinese Academy of Sciences;and the Oasis Scholar"Doctor" Talent Training Program (0771021) of Xinjiang Institute of Ecology and Geography.The authors would like to thank the reviewers for their invaluable suggestions.
Alexander LV,Zhang X,Peterson TC,Caesar J,Gleason B,Klein A,Haylockg M,Collins D,Trewin D,Rahimzadeh F,Tagipour A,Ambenje P,Rupa K,Revadekar J,Griffiths G,Vincent L,Stephenson D,Burn J,Aguilar E,Brunetd M,Taylorp M,Newf M,Zhai P,Rusticuccii M,Vazquez-Aguirre JL,2006.Global observed changes in daily climate extremes of temperature and precipitation.J.Geophys.Res.Atmos.,111:D05109.
Colombo A,Etkin D,Karney B,1999.Climate variability and the frequency of extreme temperature events for nine sites across Canada:implications for power usage.J.Climate,12:2490-2502.
Easterling DR,Evans JL,Groisman PY,Karl TR,Kunkel KE,Ambenje P,2000.Observed variability and trends in extreme climate events:A brief review.Bulletin of the American Meteorological Society,81:417-425.
Goldstein J,Mirza M,Etkin D,Milton J,2003.Hydrologic assessment:application of extreme value theory for climate extreme scenarios construction.In:14th Symposium on Global Change and Climate Variations.American Meteorological Society 83rd Annual Meeting,Long Beach,pp.9-13.
Hyung E,Slobodan P,2012.Assessment on variability of extreme climate events for the Upper Thames River Basin in Canada.Hydrological Processes,26:485-499.
IPCC,2001.Climate change 2001:impacts,adaptation,and vulnerability.In:McCarthy JJ,Canziani OF,Leary NA,Dokken DJ,White KS (eds.).Contribution of Working Group II to the Third Assessment Report of the Intergovernmental Panel on Climate Change.Cambridge University Press,Cambridge,UK.
IPCC,2007.Climate change 2007:impacts,adaptation,and vulnerability.In:Parry ML,Canziani OF,Palutikof JP,van der Linden PJ,Hanson CE(eds.).Contribution of Working Group II to the Third Assessment Report of the Intergovernmental Panel on Climate Change.Cambridge University Press,Cambridge,UK.
Jiang FQ,Hu RJ,Yang YH,2004.Abrupt change in the time sequences of flood disasters in Xinjiang and its possible climatic reasons.Journal of Glaciology and Geocryology,26:674-681.
Jiang FQ,Yang YH,2004.Potential links of flood and drought disasters in Xinjiang to some larger-scale climatic driving forces.Arid Land Geography,27:148-153.
Jiang FQ,Zhu C,Hu RJ,2002b.Statistical and fractal features of the flood and drought disasters in Xinjiang from 1950 to 1997.Journal of Natural Disasters,11:96-100.
Jiang FQ,Zhu C,Mu GJ,Hu RJ,Meng QX,2005.Magnification of flood disasters and its relation to regional precipitation and local human activities since the 1980s in Xinjiang,Northwestern China.Natural Hazard,36:307-330.
Jiang FQ,Zhu C,Mu GJ,Hu RJ,2002a.Recent magnification of flood and drought calamities in Xinjiang:An analysis of anthropogenefic effects.Acta Geographica Sinica,57:57-66.
Karl T,Knight R,Easterling D,Quayle R,1996.Indices of climate change for the United States.Bull.Am.Meteorol.Soc.,77:279-292.
Kharin V,Zwiers F,2000.Changes in the extremes in an ensemble of transient climate simulations with a coupled atmosphere-ocean GCM.J.Climate,13:3760-3788.
Kruger AC,2006.Observed trends in daily precipitation indices South Africa:1910-2004.Int.J.Climatol.,26:2275-2285.
Peterson TC,Manton MJ,2008.Monitoring changes in climate extremes—A tale of international collaboration.Bull.Am.Meteorol.Soc.,89:1266-1271.
Shi YF,Shen YP,Li DL,Zhang GW,Ding YJ,Hu RJ,Kang ES,2003.Discussion on the present climate change from warm-dry to warm-wet in Northwest China.Quaternary Sciences,23:152-164.
Wang L,Swail V,2001.Changes of extreme wave heights in Northern Hemisphere oceans and related atmospheric circulation regimes.Journal of Climate,14:2204-2221.
Xie ZQ,Du Y,Jiang AJ,Ding YG,2005.Climatic trends of different intensity heavy precipitation events concentration in China.Journal of Geographical Sciences,4:459-466.
Xu GH,1997.Global climate warm up bring what on Sinkiang economic construction and sustainable development? Xinjiang Weather,20:1-3.
You QL,Kang SC,Aguilar E,Pepin N,Flugel W,Yan Y,Xu Y,Zhang Y,Huang J,2011.Changes in daily climate extremes in China and their connection to the large scale atmospheric circulation during 1961-2003.Clim.Dyn.,36:2399-2417.
Zhang Q,Tao J,Chen YQ,Chen XH,2010.Changing properties of hydrological extremes in south China:natural variations or human influences?Hydrological Processes,24(11):1421-1432.doi:10.1002/hyp.7599.
Zhang Q,Xu CY,Gemmer M,Chen YQ,2009.Changing properties of precipitation concentration in the Pearl River Basin,China.Stochastic Environmental Research and Risk Assessment,23(3):377-385.
Zhang Q,Xu CY,Zhang ZX,Chen YQ,Liu CL,2008.Spatial and temporal variability of precipitation maxima during 1960-2005 in the Yangtze River Basin and possible association with large-scale circulation.Journal of Hydrology,353:215-227.
 Sciences in Cold and Arid Regions2013年2期
- Sciences in Cold and Arid Regions的其它文章
- Amount and temperature effects responsible for precipitation isotope variation in the southern slope of Himalayas
- Seasonal changes in the relationship between species richness and community biomass in grassland under grazing and exclosure,Horqin Sandy Land,northern China
- Afforestation effects on soil microbial abundance,microbial biomass carbon and enzyme activity in dunes of Horqin Sandy Land,northeastern China
- The effects of extreme rainfall events on carbon release from biological soil crusts covered soil in fixed sand dunes in the Tengger Desert,northern China
- Probabilistic modeling of soil moisture dynamics in a revegetated desert area
- Effects of shrubs and precipitation on spatial-temporal variability of soil temperature in microhabitats induced by desert shrubs