Amount and temperature effects responsible for precipitation isotope variation in the southern slope of Himalayas
Tek Bahadur Chhetri ,TanDong Yao ,LiDe Tian ,XinPing Zhang
1.Institute of Tibetan Plateau Research,Chinese Academy of Sciences,Beijing 100101,China
2.University of Chinese Academy of Sciences,Beijing 100049,China
3.Central Dept.of Hydrology and Meteorology,Tribhuvan University,TU,Kathmandu,Nepal
4.College of Resources and Environmental Sciences,Hunan Normal University,Changsha,Hunan 410081,China
1 Introduction
Isotopic composition of precipitation changes with the amount of condensation or evaporation was found by Harmon Craig (Craig,1961).Later,the global meteoric water lines (GMWL:δD=8δ18O+10) and local meteoric water line(LMWL:δD=b(δ18O)+c) were defined,which can be used to know the detail of the meteorological condition of precipitation and its dependency with various atmospheric elements (Dansgaard,1964;Gonfiantini,1978;Araguaset al.,1998;IAEA,2001).From a detail investigation of spatial and temporal variations of stable isotopes of heavy precipitation in Indian Summer Monsoon (ISM) precipitation (Tian and Yaoet al.,2001;Kanget al.,2009;Yaoet al.,2009;Liet al.,2011),many LMWL relationships for different parts of China were established.The results show that the local meteoric water lines in precipitation spatially differ on the southern slope of Himalaya (SSH),depending on many factors such as moisture sources,their origins and seasonality.
Araguaset al.(1998) reported that the variations of isotopic depletions in precipitation of different moisture systems are related to their original source compared to local factors such as evaporation,air temperature and so on.In addition,Gatet al.(2001),Wuet al.(2009),Liet al.(2012) and Zhanget al.(2012) reported that,various amount of local precipitations produce variability in stable isotope which are attributed to local meteoric water lines under different atmospheric conditions and seasons.For example,the precipitation amount due to low or high moisture condensation in high altitude areas of southern slope of Himalayas (SSH) reveals different amount effect in stable isotopes.
Many studies such as Yaoet al.(1995,1999),Tian and Messon-Delmotteet al.(2001),Liuet al.(2008),and Yanget al.(2009),observed large values of depletions of stable isotopes in summer precipitation in many parts of China just after the onset of ISM,and reported that the seasonal change of δ18O in precipitation is due to the amount effect.The authors (Zhanget al.,1998,2002,2004;Garzioneet al.,2000;Rowleyet al.,2001) carried out some theoretical outlines of thermo-dynamical studies of stable isotopes in precipitation of Langtang and Kaligandaki areas of Nepal,however,it was a basic study on both amount and temperature effects in stable isotopes of monsoon precipitations.Therefore,on the basis of samples measured and global network in precipitation (GNIP) isotope data (IAEA,2001),"iso-his.iaea.org",the diurnal and seasonal variation are carried out to study the main controlling features of amount and temperature effects on the temporal trends of stable isotopes of precipitation at Kathmandu Valley,Nepal in the SSH.
In addition to this,an additional primary purpose of this study is the long-term temporal variation of isotopic depletions of the selected area to compare with the estimated,lab measurements and with GNIP δ18O data to understand consistency for their variation range during different seasons.Meanwhile,the relations of δ18O and δD values with event precipitations and meteoric water lines are determined to know the general climatic condition,amount effect and temperature effect in local of precipitation of selected study area.This study estimates new isotope data series in modern precipitation on the southern slope of Himalaya,where various moisture transports affect the stable isotopes,using very simple method which can be applied for various studies of environmental change,moisture systems and Paleo-climatic conditions of glacier ice cores.
2 Study area
2.1 Precipitation sampling area and lab estimation
Kathmandu Valley,the capital city of Nepal,was selected as the precipitation sampling area for this analysis.The valley is located at the middle part of mountainous region of Nepal at about mean latitude and longitude position(27.54°N-27.82°N and 85.2°E-85.5°E),at an altitude of 1,340 m a.s.l.(Figure 1),and at distance of about 1,000 km away from the nearest coastal area of Bay of Bengal (BOB).The main purpose of this paper is to study the temporal variation of δ18O and δD in precipitation and how the amount effect changes due to different climatic and seasonal conditions.For the location of sampling,Kathmandu in the southern slope of Himalaya can represent the mid-point between the BOB region and Tibetan Plateau (TP).Large values of moisture transport from the southerly oceans like BOB,IO(Indian Ocean) and SCS (South China Sea),influences the regional precipitation both in summer and winter.Therefore,the estimation of isotopes in precipitation of Kathmandu can reflect the mean trends of SSH under different meteorological conditions of high mountainous area.
Air temperature and precipitation (1968 to 2010) data(100 years CRU data:climatexp.knmi.nl) and precipitation isotope (GNIP isotopes:www.waterisotope.org) data are used to study the long term climatic condition of selected area.Precipitation sampling collection was started in the summer rainy season of 2010,and 32 precipitation samples were collected with the cooperation of Central Department of Hydrology and Meteorology,Tribhuvan University,Nepal.Stable isotopes in precipitation were measured using relation δ18O=1000(Rs-Ro)/Ro;where,Rs andRo are the ratios of referenced sample and Vienna Standard,in unit of ‰ in the laboratory.Lab isotopes data were also compared with GNIP stable isotopes downloaded from the wave page data base (IAEA,2001).The detail of laboratory measurement procedures are also found in Yanget al.(2011).The correlation of lab-measured and estimated δ18O values in 2010 are also derived to see the consistency between them.
2.2 General climatology of Kathmandu Valley
The general climate of Kathmandu Valley is Meso-thermal type of climate similar to the climate of north end boundary of sub-tropical region.The location (1,340 m) of Kathmandu Valley in the SSH,divides the hot climate toward the low mountains or plains in the south and cold climate toward the high mountainous area to the north.Regionally,the valley receives high amount of annual precipitation from the combination of moistures of Bay of Bengal(BOB),Indian Ocean (IO),Arabian Sea (AS) and South China Sea (SCS) associated with various seasonal circulations from South Asia.During summer time,the valley receives more than 80% of total annual rainfall and the mean monthly value is greater than about 150 mm.Compared to summer,it receives very low precipitation in winter due to continental anti-cyclonic air mass from the surrounding region like Mediterranean continents (Westerly) and north-westerly across the Himalayas and around from the Tibetan Plateau.During winter precipitation,surrounding vapor mass are circulated to this valley from the high mountainous areas of Himalayas,Tibetan Plateau,western continents,Gangetic Plain and South China Sea,and contribute relatively low moisture for precipitation compared to summer.The high mountainous geography at the north of this valley insists the convergence of cyclonic maritime circulations in hot summer and causes heavy rainfalls over the region.Because of various transport system of moisture circulations and high altitude geography of the region,a diverse pattern of precipitation characteristics are found.Both summer and winter air masses contribute precipitations,that is why,SSH is known as dominated by the monsoonal climate in the region.The north-south altitude gradients,orientations of mountains and geomorphologic structure of different valleys have great role to change the characteristics of atmospheric circulations,precipitation amount and climatic systems around and in this valley.
Daily maximum and minimum temperature range of the valley is found between 33 °C to 5 °C and annual peak minimum temperature remains over 0 °C in the coldest month of recent years.The mean monthly temperature is generally found about 18 °C.The geographical coverage associating with large variety of topography and altitudes varying as from 60 m in the southern Terai plain to 8,848 m high mountain area of SSH at the north,makes an obviously high temperature gradient (-10 °C/km),is assumed to be the main reason for diversity of precipitation,short term weather and long term climatic condition of the region.In general,monsoonal circulations transport moisture from IO,AS and BOB and SCS and make various precipitation amounts according to the regional climatic conditions.In addition to these,atmospheric,surface and glacier activities are also most important recycling phenomena of local water circulations within the valleys,mountains and across the SSH in dry winter periods.All these circulations systems in the SSH are directly or indirectly influenced by the high altitude geography of Himalaya and Tibetan Plateau,and due to this fact,the temperature gradient contributes a great role for development of regional precipitation systems in South Asia and in the SSH.As for reference,the general climatic condition of the valley,the long term station observed mean temperature and precipitation from 1968 to 2011 has been shown in Figures 6a and 6b in later discussion section.
3 Lab-measured and estimated δ18O values
The event precipitation,estimated and lab-measured isotopes (δ18O) values of 2010 are shown in Figure 2,which shows a gradual decreasing daily cycles of δ18O values with daily total precipitation from the beginning of winter months January to mid-June,the values are obtained as higher (-3‰ to-10‰) comparing to summer values(-7‰ to-13‰),and thereafter,the depletions trend increased to lower values in major rainy period until the first week of October,in 2010.Moreover,depletion trend is obtained proportional with the increasing amount of summer precipitation and this result shows higher daily values of isotopes of range for δ18O (-3.5‰) and δD (-32‰)during winter months January to June,which should be due to high rate of evaporation due to gradual increasing of temperature after January.Other possible fact is considered as the influence of underground water evaporation due to large human activities in Kathmandu Valley.According to report of underground water use in Kathmandu Valley(Shrestha,2006),Nepal Water Supply Corporation,extracts more than 100 million L/d underground water for public use,which should be one of fact for heavier isotopic compositions in winter precipitation.In addition to this,the winter moisture from surrounding areas of Himalayas and Mediterranean sources can be assumed to be the contributors of relatively higher stable isotopes in precipitations of the selected area during the winter time.

Figure 2 Daily variation of stable isotopes estimated and measured from precipitation samples of Kathmandu in 2010
The range of monthly mean estimated values of δ18O is found from-6‰ to-8.2‰.For winter and summer periods,the estimated values of 2010 were compared with the peak values of 2011,from February to June,it showed high peaks of heavy isotopes of 12‰ and 63.6‰ for δ18O,δD respectively,similarly,the minimum values-21.4‰and-156.0‰ were found in August respectively,which are very large values compared to the estimated δ18O values of both winter and summer periods in 2010.However,higher depletions are found from monsoon onset period to major rainy period due to high amount of precipitation,which should be the precipitations resulting from large moisture from IO or BOB.This dependency of stable isotopes to high values of condensation is attributed to amount effect in precipitation,which is found mostly large in summer and continues until the supply of moisture stops at the end of September to first week of October.The δ18O value was further decreased when the temperature decreased from September in high rainfall events (Figure 2).During the late rainy season in September to October,the depletions shows the impact of altitude effect in condensation of vapors under high moisture which was found reduced after only mid-September,the moisture transport from IO is found ending in early October,this is generally known as the retreat of monsoon in the region.The general weather of Kathmandu is found humid during the period of frequently rainfall events both in winter and summer,however,summer period of 2010 provide heavier precipitation compared to winter,which is responsible for the large depletion of stable isotopes and hence high amount effect in major rainy period.
Figure 3 shows the comparison of monthly mean values(δ18O) between lab-measured and calculated values of δ18O from different climatic data and sources.Regression analysis showed good correlation only in rainy season with GNIP data and lacks the consistency in winter time in the selected area (Figure is not shown),which is the main discrepancy found in this analysis.

Figure 3 Comparison of monthly mean δ18O data estimated from observed and CRU precipitation,the estimated values are of summer period only (May to August) including GNIP and lab-measured monthly isotopes of 2011
To compare the δ18O values,calculation of δ18O was also carried out from CRU and observed precipitation for summer period,on comparison with the monthly isotope data (Tianet al.,1998),showed close relation with the lab-measured isotope data (Figure 3) from April to September.Higher depleted values are found in late rainy months compared to isotope data (Tianet al.,1998),which should be due to progressively recycled precipitation from multiple evaporations.Thus,from this comparison,we found no good correlation between GNIP and measured isotopes data before the onset of regional monsoon in this study area,it could be due to higher temperature effect in stable isotopes of recent precipitations.
Estimated mean values of δ18O (‰) for different months are shown in Table 1.Higher δ18O values are obtained in April and May,which is indicative for large vapor mass transport and consequently the high depletions are found in monsoon precipitation.Thus,large depletions of δ18O are related to large fractionation of high values of moisture in monsoon period.The depletion of δ18O or δD values is proportional with amount of rainfall and mostly,the high depletion was found on the day just after heavy precipitation events of winter or summer.This should be due to the precipitation of remaining cloud mass after the primary depletion in the previous events.All estimated δ18O values from April to September show a mean value of-6.5‰.The relations between the measured stable isotopes and event precipitation between July 16 to August 17 are as δ18O=-0.041P-8.22 and δD=-0.332P-62.99,asR2≈0.6 in 2010 and δ18O=-0.115P-3.635 and δD=-0.925P-22.7 withR2≈0.2 in 2011 (shown in Figures 10a and 10b discussed in later section) respectively,both of which show a moderate correlation (R2=0.2 to 0.6) with high amount of precipitation for δ18O and δD values.
The variation character of δ18O values in summer responds the change of seasonal air mass very quickly through their depletion magnitudes,this feature of stable isotopes in regional air mass is relatively larger at Kathmandu than found at other various parts of SSH.The depletions of δ18O with precipitation amount are seen in Figures 2 and 3,which is supportive with the results (Rowleyet al.,2001;Tian and meson-Delmotteet al.,2001;Liuet al.,2008;Yanget al.,2009;Yaoet al.,2009).
Figure 4 shows the correlation relationship between the lab δ18O and estimated δ18O values in 2011.The regression parameters in fitted equation [y=a(-3.69±1.28)+b(0.56±0.14)x]are found asR=-0.611,standard deviation is 1.155 for numberN=28 with probabilityp<0.0006 values in Figure 4 and a 1:1 line shows the close relation.Similarly,Figure 5 shows the evolution of δ18O using precipitation of 2010 for 2011.From this evolution range of δ18O,it is very clear that the values are nearly comparable with the values range of lab-measured isotope (δ18O) in 2011.
Thus,this comparison result provides the possible methodology to determine the δ18O values in precipitation from precipitation and other related environmental information itself in local precipitations of SSH.

Table 1 Estimated mean values of δ18O (‰) from various data and sources

Figure 4 The correlation relationship between lab δ18O and estimated δ18O values in 2011

Figure 5 The comparison of the calculated values [δ18O=-1.16Ln(P)-6.14 ] on the basis of observation precipitation in 2010 with the estimated values [δ18O=1.5-4.14Ln(P)] on the basis of lab-measured data for 2011
4 Discussions
4.1 Observed climatic condition and monsoon circulation
The mean monthly and annual variations of precipitation and temperature in Kathmandu for period of about 40 years(data source:Department of Hydrology and Meteorology,Government of Nepal) are shown in Figures 6a and 6b.We can see both long term mean values of monthly precipitation and temperature are high in July (Figure 6a),whereas,from Figure 6b,the annual variation of monthly precipitation are obtained as decreasing by about 40% recently after 1995.
Zhanget al.(2002) reported,the southern slope of Himalayas is said to be in a transition zone between southern monsoon and Tibetan moisture,where a dynamic trough forms during winter time under the influence of southern component of westerlys.Consequently,the winter precipitation over some western parts of Nepal and south Tibet are sometimes larger than that in summer.These types of effects are seen up to Gangetic plain near the BOB extending through the central part of India to high mountainous area at the north from Kathmandu Valley.These findings support views shared by other researchers,as we can see some outline features of recent circulations in Figures 7a and 7b,which show the major seasonal circulations in winter and summer of 2011,plotted using NCEP/reanalysis data (source:www.esrl.noaa.gov/psd/cgi-bin/reanalysis).These figures show wind trajectories (m/s),moisture mass (g/kg) and the average conditions of oceanic circulations near or around the BOB and SCS areas both in winter and summer periods.
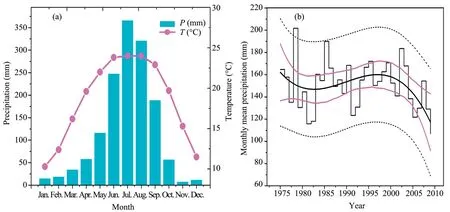
Figure 6 (a) Mean monthly values and (b) annual variations of precipitation and temperature at Kathmandu for about 40 years until 2010
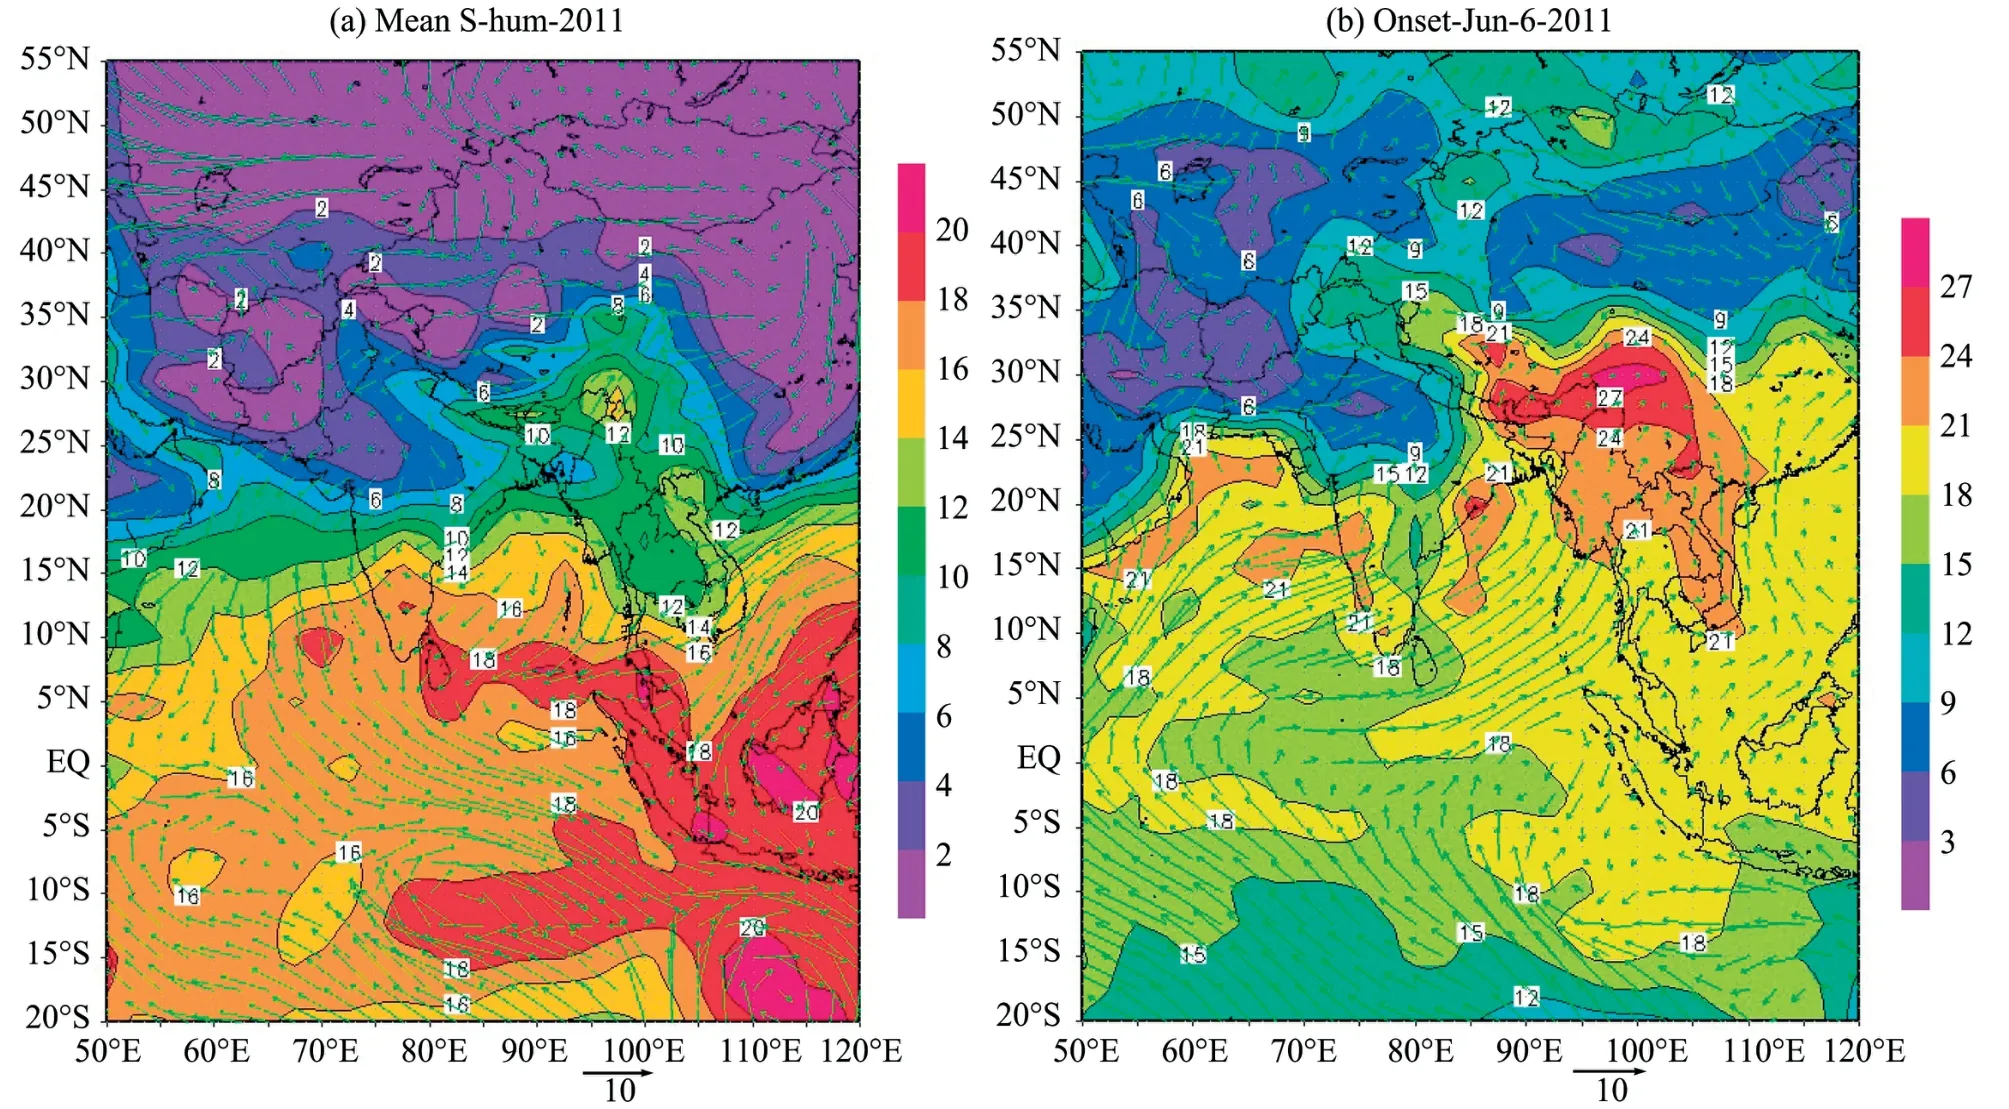
Figure 7 (a) Wind circulations during cold or dry period in winter and (b) moisture circulation from CSC and BOB near to onset date of monsoon precipitation in hot summer showing transport of specific humidity of about from 25 to 30 g/kg
Wind trajectory shows sometime the SCS monsoons circulate to SSH introducing heavy precipitation in winter,but,summer time (Easterly) wind becomes stronger only after mid-June,which modifies the circulations of SCS or BOB into anti clockwise direction in convective precipitations and helps to form heavy rainfall in east Tibet and its adjacent areas,and this covers all parts of SSH to the west in about 30 days or more,as seen in Figure 7b.This shows moisture movement prior to onset date of SCS monsoons,which has been found one week sooner compared to onset from the BOB in 2011.Thus from these circulation patterns,some new circulations phenomena of moisture transport are found to be active near the SCS in the regional precipitations recently.
4.2 Meteoric water lines in winter and summer season
Various slopes and intercepts values of local meteoric water lines are possible from each month and season indicating various amount of moistures their sources in monsoon period of 2010 to 2011,diurnal study of which will be one of future work,therefore,here two meteoric lines of major seasons are established (Figures 8a and 8b),which are different for both periods,particularly,Figure 8a shows LMWL or δD=(4.36±0.30)δ18O+(15.66±1.22),with values ofR=0.93,SD=6.18,N=34 andp<0.0001 for period before the regional monsoon onset date (June 15,2011),whereas Figure 8b shows δD=(6.91±0.21)δ18O-(7.92±2.26),withR=0.98,SD=7.2,N=57 andp<0.0001,showing the LMWL for rainy period after onset of monsoon from the BOB or IO sources.
4.3 Variation cycle of stable isotope,temperature anomaly and precipitation
The anomalies of observed temperature from 1968 to 2010,precipitation deviations and GNIP isotopes are studied to know the amount and temperature effects of stable isotopes in a yearly cycle of precipitation,which is plotted in Figure 9a,and shows that amount and temperature effects are the main causes of monthly variation of stable isotopes.Similarly,the annual trends of same parameters are shown in Figure 9b,which shows a precipitation deviation of about 30% while the temperature raised by about 1.5 °C within the same period.In Figure 9a,the monthly δ18O values from January to December are proportional with seasonal temperature and precipitation trends.On a yearly basis,the temperature are 5 months below and 7 months above normal mean(18.5 °C),whereas,the precipitation is above for 5 months(May to September) and below for other 7 months in winter(the mean is about 120 mm).However,change of δ18O values are controlled by the change of both temperature and precipitation in the same period,two peaks values one from October to February and other smaller cycles from March to May are related to temperature rise from-8 to 6 °C,at time when anomalies are above the mean (18.5 °C) for 7 months from April to October and below for 4 months from November to March.The maximum precipitation are about 2.5% in summer and below the normal in winter.The magnitude of isotopes deviations shows range of ±3 for each 6 months of year indicating high value in winter and depletion in summer with the mean value approximately-8.5‰.
During winter,precipitation deviates negatively when stable isotope increases from October to May with increasing temperature,shows a short-term depletion in March due to pre-monsoon precipitation,this increasing trend of stable isotope is known due to temperature effect in winter evaporation under low moisture,thus temperature effect enforces to change lower valued isotopes into higher values.Further in June while the temperature attains to its higher value,the onset of monsoon is set and the gradual depletion of δ18O are seen from May or June,and this rate becomes quickly larger in the major rainy months from July to August,which is due to high rate of fractionation of stable isotopes under high moisture condensation.In general,SSH receives high amount of precipitation from June to August in BOB or IO regions,and the higher depletion in stable isotopes with high amount of rainfall is known as amount effect (Zhanget al.,2001,2002).This depletion of δ18O depends on the total amount of precipitation and its intensity in summer,which is strongly supportive from this analysis.
The depletion continues toward the rainy summer months until October and reduces when the temperature becomes negative on November in late rainy period (Figure 9a).This is known as altitude effect which continues under low moisture and temperature,enhancing further depletion until October,at the same moment,the isotopic curve returns backward due to local or atmospheric evaporation itself.This process initiates increasing of heavy isotopic composition in atmospheric moisture,and continues recycling toward the summer months.Thus,the decreasing trend of temperature from August invites the altitude effect and just deviates negatively in November with further depletions at monsoon retreat time in the SSH.Increasing rate of isotopes is seen proportional with lowering humidity and temperature for three months(November to January),thereafter,it shows both cycles of amount and temperature effects in pre-monsoon.Thus,from these it is clear that the temporal variation of stable isotopes are controlled by both amount and temperature effects in summer or winter and high values of stable isotopes during winter are controlled by the temperature effect which are supportive from both Figures 9a and 9b.
4.4 Long term variation of amount effect in precipitation
The amount effect relationship (Figures 10a and 10b)between δ18O and δD values and event precipitation for different periods are strongly related to quantity of precipitation in events,with correlation value ofR2=0.6 (Figure 10a) in high depletion season of 2010,however,a comparison of both isotopes with the event precipitations of same period in 2011 did not correlate δD values of both years (Figure 10b).Interestingly,only δD values show weak correlation with precipitation amount,this discrepancy between oxygen and deuterium isotopes should be due to different moistures,however,depletions of δ18O values do correlate for both periods,therefore,we can conclude that the deuterium isotopes are highly sensible for distinguishing the source mass of precipitation.
Distribution of δD values from the same data are found larger implying lower level unsaturated condensation of vapor mass,particularly,in the precipitation process of 2011.Moreover,amount effect relation shows both isotopes are seen closely in two groups of daily precipitation amount below and above about 35 mm,which apparently,differentiate the precipitation amount with winter or summer isotopes values,and low amount are believed to be due to regional recycling of vapors.Heavy δD values are also considered to be produced through atmospheric evaporation,thus,permanent local (continental),regional (oceanic) and transported source (atmospheric) of moistures all are responsible to produce high amount of δD values in precipitation of SSH.
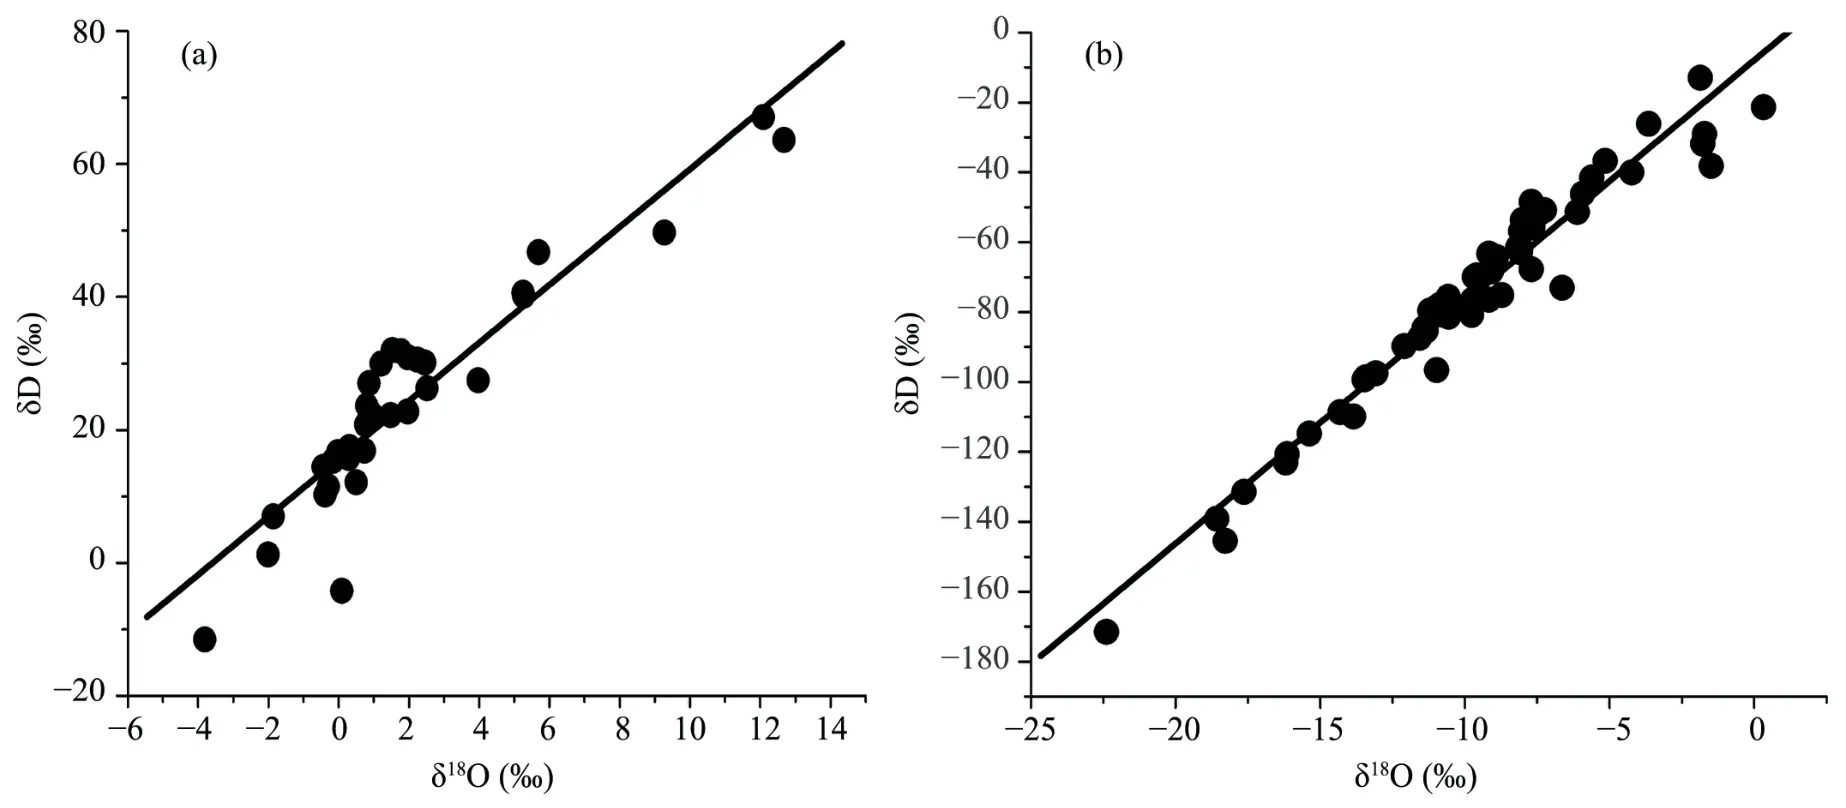
Figure 8 (a) The meteoric water line in winter season using measured isotopes data (34 daily precipitation samples) before onset of monsoon and (b) meteoric water line in summer season using isotopes data (57 daily precipitation samples) after the onset of monsoon at Kathmandu Valley,the onset date is June 15,2011
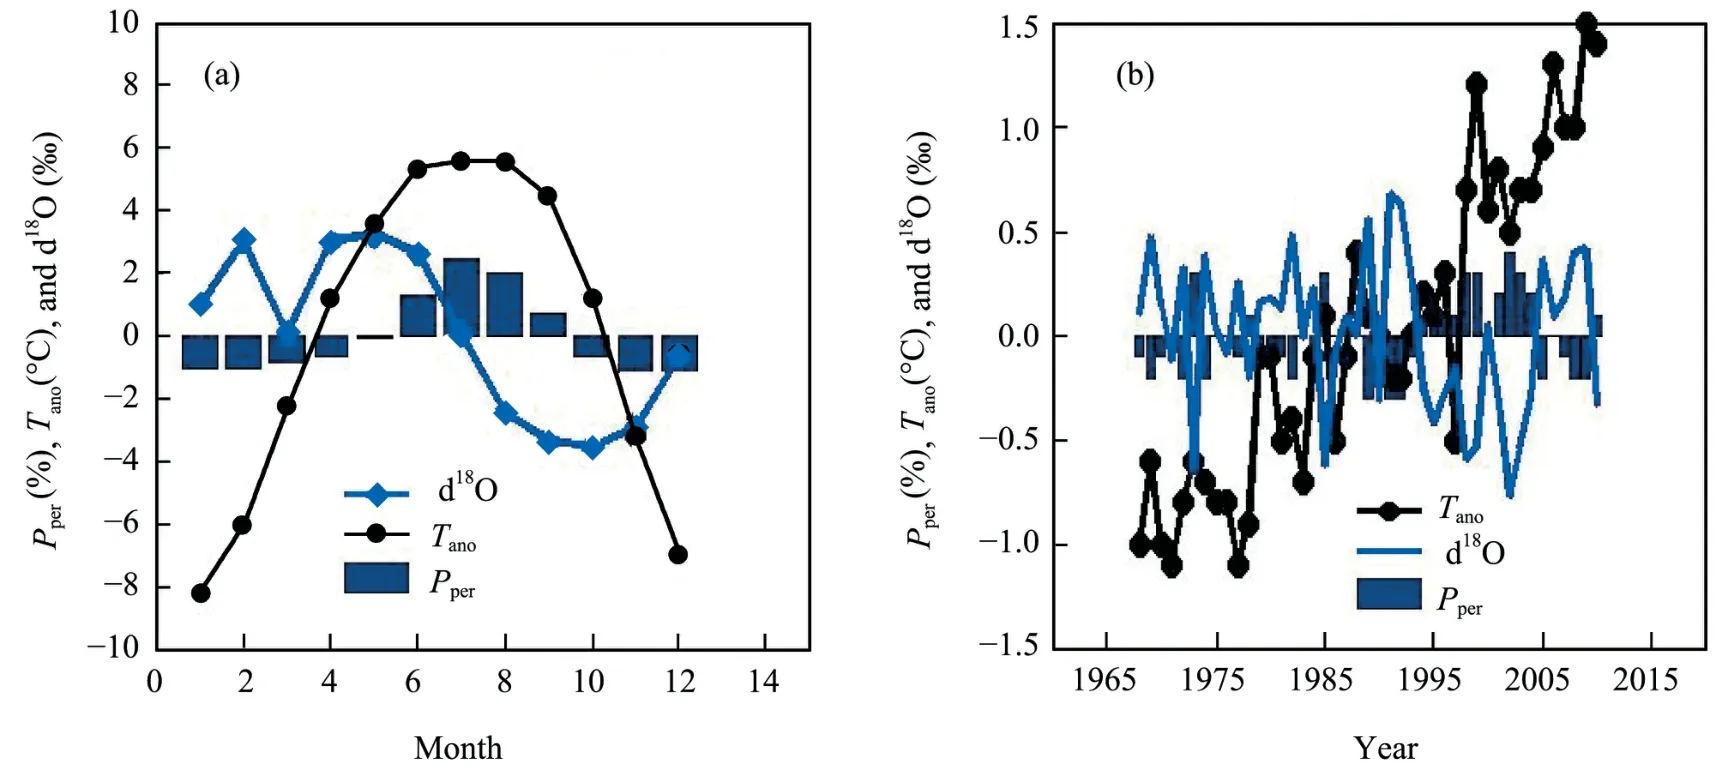
Figure 9 (a) The long term mean monthly data of stable isotope deviation (d18O),temperature anomaly (Tano) and percentage of precipitation (Pper) in annual cycle from GNIP and CRU data and (b) same from station observed data for the yearly cycles
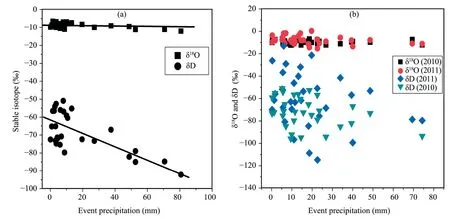
Figure 10 (a) Amount effect relationship between δ18O and event precipitation in monsoon period from July 16 to August 17 of 2010;(b) comparison of δ18O and δD values with the same period of 2010 and values with event precipitation of 2011 in summer monsoon
The δ18O values,calculated from amount effect relation(δ18O=-0.45P-2.3) derived from GNIP isotopes and CRU precipitation,are also examined for seasonal dependency of amount effect as in Figure 11,which shows the plot of stable isotopes during the summer season with annual values of precipitation from 1901 to 2009.Higher depletions relate to high precipitations,however,the highest depletion does not correspond to the highest annual precipitation in 1948.This is due to the amount effect of δ18O values depending not only on amount of precipitation but also on seasons (or an additional factor),for example the highest depletion(-12.74‰) is recorded in 1954 but precipitation amount is seen the highest in 1948.
The anomalies and deviation values of the same parameters in Figure 12 show high deviations between the period 1940-1960 and abrupt decreasing event in 1948,and thereafter lower amount of precipitations shows decreasing amount effects.The δ18O values after 1970 show increasing trend with annual increasing temperature.Thus,deviation δ18O values determined on the basis of 12 months mean data picks up well to corresponding the highest value of precipitation of 1948 as seen from Figure 12,thus deviation values of isotope give the peak values information very well for the annual variation of amount effect rather than summer mean values including the general fluctuation of isotopes trends in yearly cycles.

Figure 11 Long term annual precipitation (CRU) and the estimated δ18O values in summer period (May to August),showing dependency between the depletion and total annual precipitation from 1901 to 2009
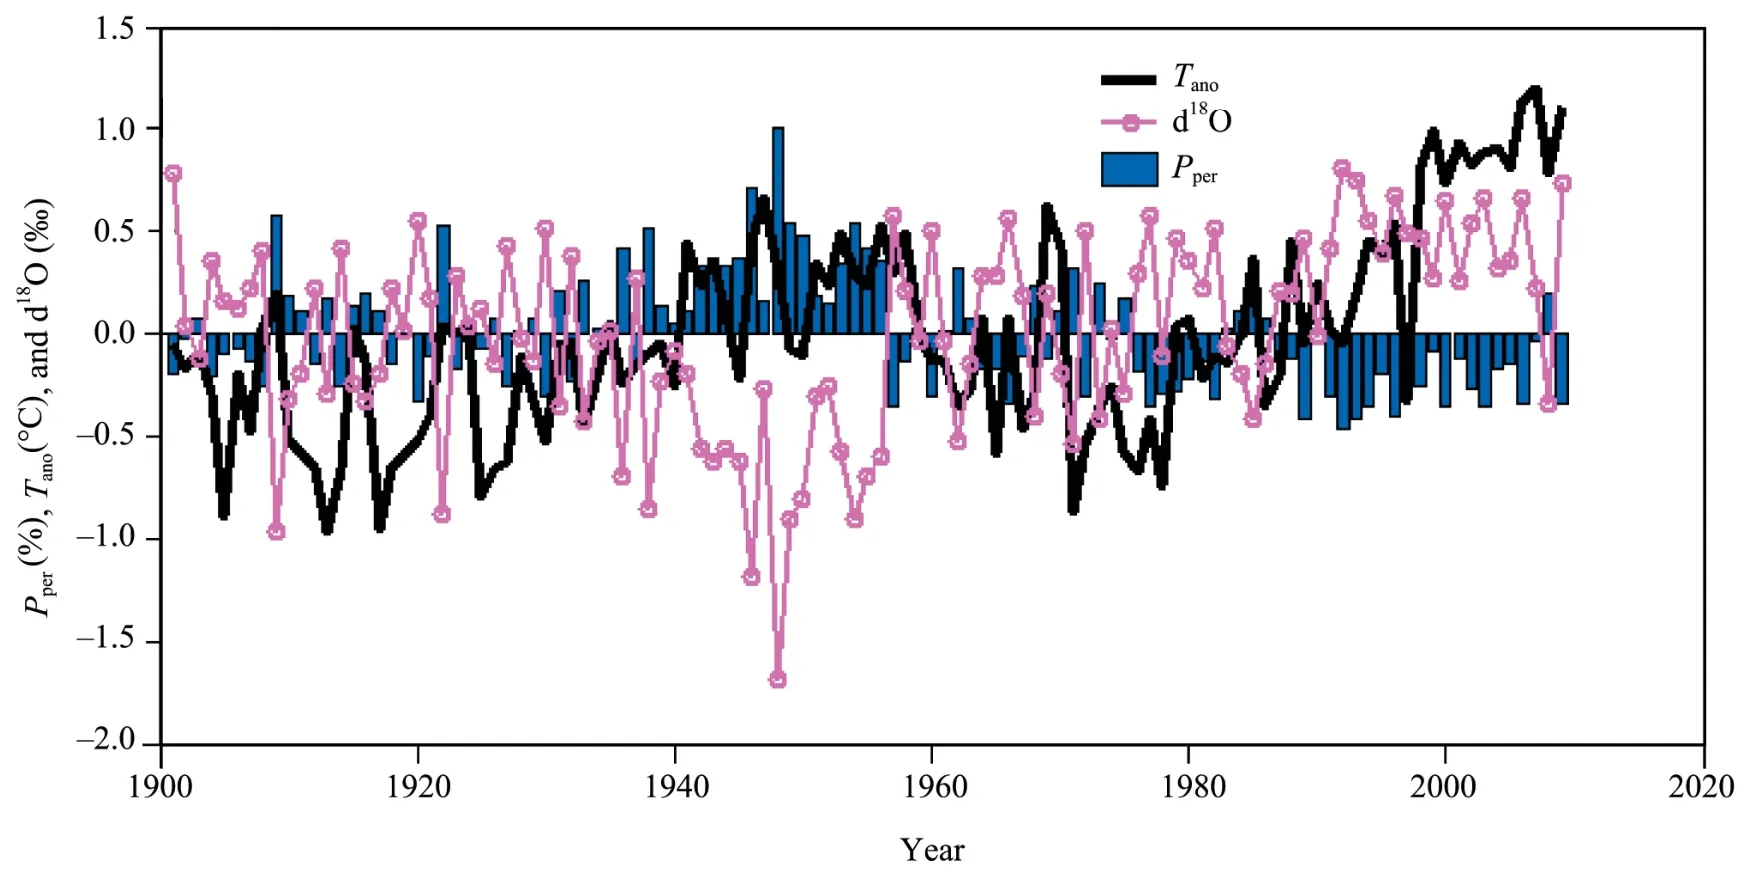
Figure 12 Long term trends of precipitation percentage (Pper),estimated δ18O deviation (d18O)and temperature (CRU) anomaly (Tano) in summer period (May to August)
The estimation of stable isotopes at Kathmandu shows higher values (≈-4‰) in winter and lower values in summer(≈-8‰),depends on the direction of regional air circulations.The summer provides higher rainfall from south to north,but,winter provides higher precipitation from north to south with decreasing moisture in Westerly.This is one important characteristic of winter precipitation at Kathmandu,showing large variation of isotopes in precipitation depending on wind shift of southern slope of Himalayas.However,the higher value of stable isotope after 1970 is found due to the increasing temperature (temperature effect) in annual variation trend (Figure 13a).The correlation between isotope and temperature anomalies is δ18O=(0.371±0.08)T+(0.156±0.05)withR=0.6±0.28 forN=37 years,probability (p) is less than 0.0001 in the period from 1970 to 2007.This relation provides a positive annual slope of 0.45;that is,δ18O/T=0.45‰/°C(deviation values) as the increasing rate of δ18O per unit rise of temperature in Figure 13b,which is slightly lower with similar result (0.65) found in Tibet by Yaoet al.(2011)from the northern part of SSH,and from one of analysis of past 100 years CRU data,the temporal rate of increasing annual mean temperature is about 0.02 °C/a to 1 °C/a at SSH,thus on the basis of these two rates the annual rate of increasing δ18O values in the SSH are determined in range of a minimum to maximum value of 0.01‰/a to 0.45‰/a,yielding a mean value of 0.23‰/a.Furthermore,taking the regional rate of temperature increase (0.06 °C/a) as the same rate becomes about 0.027‰/a.This is actually a dry signal of atmospheric condition for both moisture and condensation process compared to period 40 years before.Thus,increasing temperature effect of stable isotopes in recent precipitation should be responsible for the impact on amount effect (low amount) in recent precipitation in the southern slope of Himalayas.
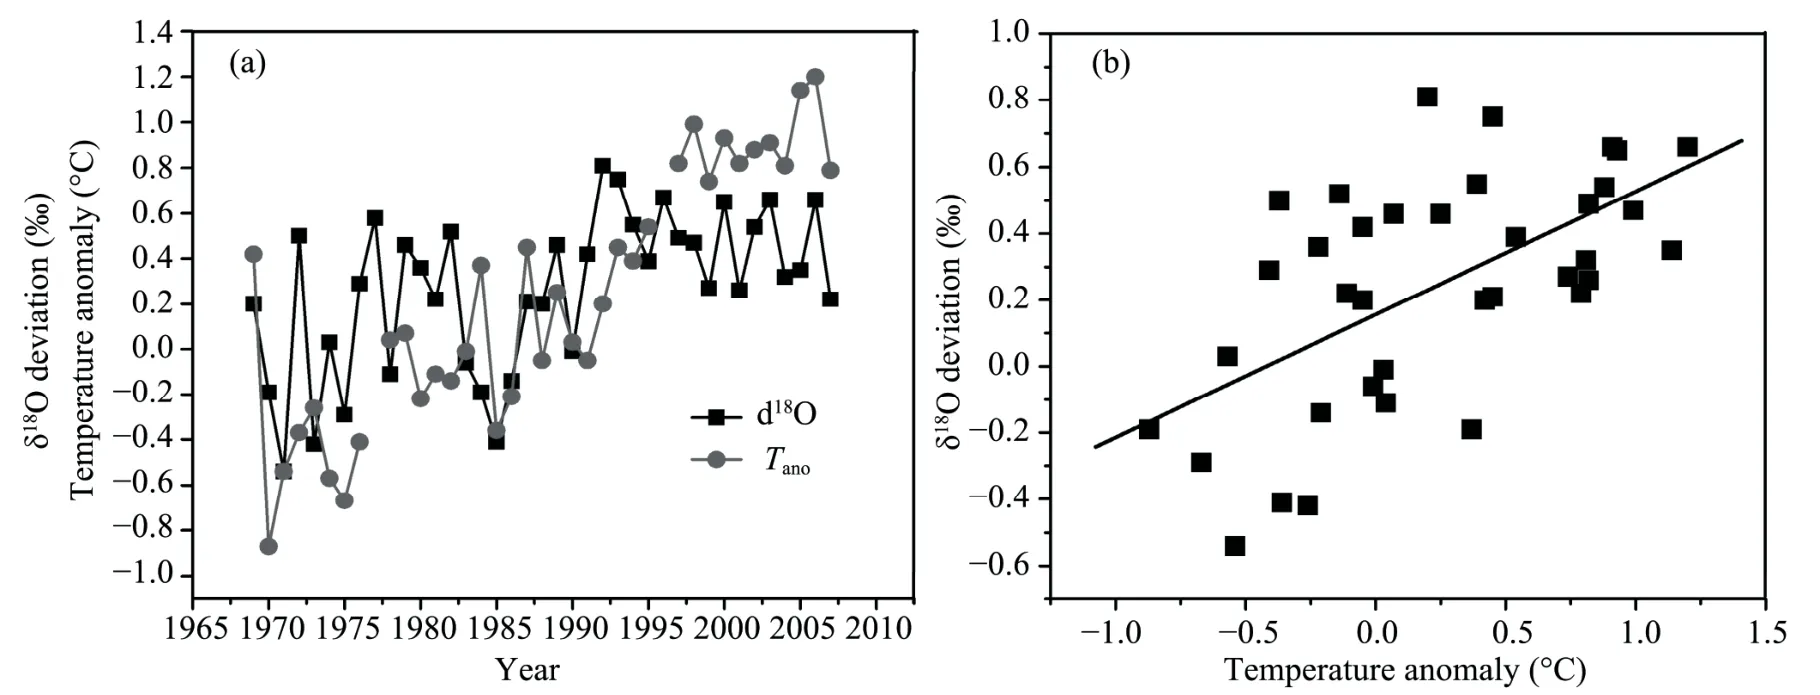
Figure 13 (a) The dependencies of annual variation of stable isotopes (deviation) and temperature from 1970 to 2007 of Kathmandu showing as temporal variation and (b) the relationship of δ18O values with annual temperature anomalies
5 Concluding summary
Recent precipitations in SSH possess higher δ18O and δD values during winter compared to low values in summer precipitation.Sudden high depletion of isotope values in June indicates the onset of monsoon precipitation by replacement of winter air mass with southerly at Kathmandu.High depletion of isotopes are characteristic of monsoonal of precipitation resulting the high amount effect in summer,whereas,higher positive values in winter are signals of regional vapors mass recycling.The minimum δ18O values appear near the retreat time of monsoon either in late September or October.
Variability in stable isotopes are the result of various transport phenomena of moisture in regional precipitation,generally,mean δ18O values (>-5‰) are obtained from winter precipitation and low values (<-5‰) in summer precipitation.High values of isotopes are indicators of vapor mass input at Kathmandu either from local (ground water contribution) or regional sources of vapor mass.Summer season shows high amount effect with event precipitation relating to/for same type of moisture mass,transports and origins,otherwise weak relations are obtained for different conditions.
Long term temporal variation of isotopes shows both temperature and precipitation control the amount and temperature effects in precipitations.Large depletions before 1960 and increasing trend after 1970 are the direct example of high amount effect and temperature effects in Kathmandu which signifies the annual climatic cycles of study area.Present rate of isotope deviation at Kathmandu varies from 0.01‰/a to 0.45‰/a yielding a regional mean of 0.24‰/a in SSH,which is believed as the direct impact of regional temperature raise for low amount effect in recent precipitations.
Two major seasons meteoric water lines (LMWL) of 2011 are established as δD=(4.36±0.30)δ18O+15.66 and δD=(6.91±0.21)δ18O-7.92 for winter and summer from this analysis,which indicates a drier winter season compared to the monsoon season.The GNIP data meteoric lines are derived as δD=9.2δ18O+11.7,δD=8.5δ18O+16.65,and the lapse rates of both compositions are obtained as-0.002‰/m and-0.015‰/m,representing for the geographical effect of SSH on the local precipitation.
Variation of precipitation isotopes are controlled by the amount effect in summer and by the temperature effect in winter,which are the most general features of precipitation of regional monsoons in the SSH.Temporal trends of stable isotopes in precipitation correspond to both amount and temperature effects according to recent climatic change under various seasonal moisture conditions on the southern slope of Himalayas.
This study is supported by the Ph.D.program of Institute of Tibetan Plateau Research,ITPCAS;Graduate University of Chinese Academy of Sciences GUCAS,China.The precipitation sampling and climatic data centers such as DHM;NEPAL,GNIP;IAEA,NCEP/NCAR;NOAA,USA;CRU-ECA &D Explorer;Netherlands are also the sincere parts for this acknowledgement.We also thank to William A.Jefferson,Ph.D.Scholar,Environmental Engineering Research Centre for Eco-Environmental Sciences,Chinese Academy of Sciences,CAS,Beijing,China,for the English correction of this manuscript.
Araguás LA,Froehlich K,Rozanski K,1998.Stable isotope composition of precipitation over southeast Asia.Journal of Geophysical Research,103(D22):721-742.
Craig H,1961.Isotopic variations in meteoric waters.Science,133:1702-1703.
Dansgaard W,1964.Stable isotopes in precipitation.Tellus,16(4):436-468.
Garzione CN,Quade J,DeCelles PG,Nathan BE,2000.Predicting paleoelevation of Tibet and the Himalaya from δ18O verses altitude gradients in meteoric water across the Nepal Himalaya.Earth and Planetary Science Letter,183:215-229.
Gat JR,Mook WG,Meijer AJ,2001.Atmospheric water environmental isotopes in the hydrological cycle-principles and applications.Technical Document,IHP-V,UNESCO,Paris,2(39):113.
Gonfiantiny R,1977.Standard for stable isotope measurements in natural compounds.Nature,271:534-536.
International Atomic Energy Agency,2001.New approaches for stable isotope ratio measurements.IAEA,Technical Document,1247,IAEA,Vienna,Austria (wave page:isohis.iaea.org).
Kang CJ,Jouzel J,Stievenard M,Qin DH,Liu LB,Wang DL,Li ZQ,Li J,2009.Variation of stable isotopes in surface snow along a traverse from coast to plateau’s interior in East Antarctica and its climatic significance.Sciences in Cold and Arid Regions,1(1):14-24.
Li YF,Shi XL,Wang NL,Pu JC,Yao TD,2011.Concentration of trace elements and their sources in a snow pit from Yuzhu Peak,north-east Qinghai-Tibetan Plateau.Sciences in Cold and Arid Regions,3(3):216-222.
Li YJ,Zhang MJ,Wang SJ,Li ZQ,Wang FT,2012.Stable isotope in precipitation in China:A review.Sciences in Cold and Arid Regions,4(1):83-90.
Liu J,Song X,Yuan G,Sun X,Liu X,Wang Z,Wang S,2008.Stable isotopes of summer monsoonal precipitation in southern China and the moisture sources evidence from δ18O signature.Journal of Geographical Science,18:155-165.
Rowley DB,Pierrehumbert RT,Currie BS,2001.A new approach to stable isotope-based paleoaltimetry:implications for paleoaltimetry and paleohypsometry of the High Himalaya since the Late Miocene.Earth and Planetary Science Letters,188:253-268.
Shrestha MN,2006.Assessment of the effect of land-use change on groundwater storage in Kathmandu Valley.Journal of Society of Hydrologists and Meteorologists,Nepal,3(1):27-33.
Tian LD,Messon-Delmotte V,Stievenard M,Yao TD,Zoujel J,2001.Tibetan Plateau summer monsoon northward extent revealed by measurement of water stable isotopes.Journal of Geophysics Research,106:28081-28088.
Tian LD,Yao TD,Numagoti A,Sun W,2001.Stable isotope variation in monsoon precipitation on the Tibetan Plateau.Journal of Meteorological Society of Japan,79(5):959-966.
Tian LD,Yao TD,Yang Z,Pu J,1997.A 4-years study of stable isotope in precipitation on the Tibetan Plateau.Cryosphere,3:32-36.
Wu KJ,Ding YJ,Ye BS,Yang QY,Wei Z,2009.Important progress on the use of isotope techniques and methods in catchment hydrology.Sciences in Cold and Arid Regions,1(3):207-214.
Yang XX,Xu BQ,Yang W,Qu DM,Lin PN,2009.Study of altitudinal lapse rates of δ18O in precipitation/river water with seasons on the southeast Tibetan Plateau.Chinese Science Bulletin,54:2742-2750.
Yang XX,Yao TD,Yang W,Xu B,He Y,Qu D,2011.Isotope signal of earlier summer monsoon onset in the bay of Bengal.Journal of Climate,25(7):2509-2516.doi:10.1175/JCL-D-11-00180.1.
Yao TD,Thompson LG,Jiao KQ,1995.Recent warming as recorded in the Qinghai-Tibetan cryosphere.Annals of Glaciology,21:196-200.
Yao TD,Thompson LG,Qin DH,1999.Variations in temperature and precipitation in the past 2000 a on the Xizang (Tibet) Plateau Guliya ice core records.Science in China Series,39:425-433.
Yao TD,Zhang YS,Pu JC,Tian LD,Ageta Y,Ohata T,2011.Hydrological and climatological glaciers observation 20 years on Tangula Pass of Tibetan Plateau:its significance and contribution.Sciences in Cold and Arid Regions,3(3):187-196.
Yao TD,Zhou H,Yang XX,2009.Indian monsoon influences altitude effect of δ18O in precipitation/river water on the Tibetan Plateau.Chinese Science Bulletin,54:2724-2731.
Zhang XP,Liu J,Tian LD,He Y,Yao TD,2004.Variations of δ18O in Precipitation along vapor transport path.Advances in Atmospheric Sciences,21(4):562-572.
Zhang XP,Nakawo M,Fujita K,Yao TD,Han J,2001.The variation of precipitation18O in Langtang Valley,Himalayas.Science in China (Series D),44(9):769-778.
Zhang XP,Nakawo M,Yao TD,Han J,Xie Z,2002.Variations of stable isotopic compositions in precipitation on the Tibetan Plateau and its adjacent regions.Science in China (Series D),45(6):482-493.
Zhang XP,Sun ZA,Guan HD,Zhang XZ,2012.Intercomparison of stable isotopes in precipitation simulated by GCMs with GNIP survey over East Asia.Sciences in Cold and Arid Regions,4(4):330-341.
Zhang XP,Xie ZC,Yao TD,1998.Mathematical modeling of variations on stable isotopic ratios in falling raindrops.Acta Meteorological Sinica,12:213-220.
 Sciences in Cold and Arid Regions2013年2期
- Sciences in Cold and Arid Regions的其它文章
- Seasonal changes in the relationship between species richness and community biomass in grassland under grazing and exclosure,Horqin Sandy Land,northern China
- Afforestation effects on soil microbial abundance,microbial biomass carbon and enzyme activity in dunes of Horqin Sandy Land,northeastern China
- The effects of extreme rainfall events on carbon release from biological soil crusts covered soil in fixed sand dunes in the Tengger Desert,northern China
- Probabilistic modeling of soil moisture dynamics in a revegetated desert area
- Effects of shrubs and precipitation on spatial-temporal variability of soil temperature in microhabitats induced by desert shrubs
- OSL chronology and paleoclimatic implications of paleodunes in the middle and southwestern Qaidam Basin,Qinghai-Tibetan Plateau
