
Acoustic emission monitoring of rockbursts during TBM-excavated headrace tunneling at Jinping II hydropower station
2013-10-19 06:57WuweiChengWenyouWangShiqiangHuangPengMa
Wuwei Cheng, Wenyou Wang, Shiqiang Huang, Peng Ma
aHydroChina Huadong Engineering Corporation, Hangzhou 310014, China
bZhejiang Huadong Engineering Safety Technology Co., Ltd., Hangzhou 310014, China
cChemical Process Equipment, Beijing University of Chemical Technology, Beijing 100029, China
1. Introduction
Acoustic emission (AE) is quick release of energy at a local source in a material and in a form of transient elastic waves, which is also known as stress wave emission (Katsuyama, 1996). In a natural state, any point in rocks is basically in the state of force equilibrium. However, stress redistribution occurs after rock excavation,and new stress fields are regenerated in the surrounding rocks.Thus stress adjustment makes rocks more discontinuous and heterogeneous. This process is accompanied with rock energy release,during which AE signals are produced (Drouillard, 1979; Lockner,1993).
For deep and long tunnels excavated by tunnel boring machine(TBM), rock excavation is a hot issue, where fault zone, rockburst, water inrush, karst cave-in, water-eroded cave, and swelling rocks may be involved. Through AE monitoring during TBM tunneling in the marble of Jinping II headrace tunnels, the location and frequency of micro-fractures are investigated, which are helpful for optimization design of support parameters. The AE monitoring is also helpful for analyzing in situ stresses of rocks, and for understanding mechanical properties of brittle marbles and support mechanism. According to the intensity and activity of AE signals, early-warning prediction of geological hazards during tunnel excavation can be carried out (Li et al., 2004; Wu and Wang,2011).
In AE monitoring, the measuring points are arranged in various boreholes in the experimental sub-tunnel #2-1, and threedimensional (3D) positioning is conducted to locate the AE events.Therefore the variation characteristics and relaxation depth of surrounding rocks before and after TBM excavation can be well captured. This paper aims to locate the region of micro-fractures occurrence during stress adjustment on the cross-section of the headrace tunnels, and to determine the relaxation depth and relaxation time of the stress in the surrounding rocks of the headrace tunnel #3 excavated by TBM.
With careful consideration, the AE monitoring is implemented under the site-specific geological conditions in combination of TBM and D&B tunnels. It should be convenient for us to design, assemble and retract the equipment, especially for installing and recovering the AE sensors in deep holes. Using this instrument, the AE events in rock masses were successfully captured and analyzed on the basis of complex geological conditions in deep brittle rocks (Zhao et al.,2012).
2. Settings of AE monitoring
Due to the high in situ stresses in the deep tunnels of Jinping II hydropower station, the mechanical responses of rocks in the deep tunnels are significantly different before and after excavation.To better understand the failure mechanism of deep brittle marbles such as rockburst, rib spalling and yield damage, deformation and stress of surrounding rocks are measured using comprehensive monitoring technique including AE, fiber grating, borehole TV,and borehole acoustic wave.
2.1. Scopes and advantages of AE monitoring
Generally, the scopes of AE monitoring include (1) positioning AE sources, (2) analyzing the activity of AE sources in order to perform rock failure analysis or to predict rock failure, (3) determining the time when AE events occur, and (4) evaluating the AE sources.
AE technique has been widely used in many fields at present.Since 1980s, AE has been widely applied to monitoring rockbursts in Canada and USA. Ge (2005) summarized these monitoring experiences. AE was also utilized for tunneling monitoring. As presented in Talebi and Young (1992), a full-scale AE monitoring was implemented during whole TBM tunnel construction, characterized by large scale, long time, massive data and complex geological background.
As is known, the geological condition in Jinping II hydropower station has challenging issues. To ensure that the AE monitoring can be well performed, the SHII-SRM 24 h AE monitoring system, developed by USA Physical Acoustics Corporation (PAC), with 16-channel and R.45IC-LP-AST-type sensors, is carefully chosen.Theoretically, the built-in magnifier can receive AE signals with frequency ranging from 1 kHz to 1 MHz. The sensors are located exactly in a borehole full of water and by means of specially developed installing and fixing devices. The boreholes are drilled 30 m in depth and 95 mm in diameter. This newly invented technique can successfully address the issues such as coupling between sensors and borehole wall. The free retract or release of sensors can be well conducted. Fig. 1 shows the field testing and instrumentation
installation.
2.2. Description of rocks readily for AE installation
The stratum in the experimental section is mainly of thick gray white marble of Yantang formation (T52y) of Middle Triassic. The surrounding rocks exposed in this section are slightly weathered to fresh, and rock quality varies from poor to relatively good. Accordingly, the surrounding rocks are classified into grade III according to Standard for Engineering Classification of Rock Masses (GB 50218-94).The cracks in local structural surface are highly developed.
Two tensional fracture zones, inclining N10°WN∠75°, are developed with a width of 10-40 cm, filled with clay and mixture of iron and manganese. Collapse in 10-20 cm depth due to tectonic stress frequently occurs on the shoulder and roof of the tunnel in this

Fig. 1. Pictures of field testing and instrumentation installation.
region. Pictures for the AE sensors hole at some sections in different depths are shown in Fig. 2.
2.3. Layout of AE sensors monitoring
The experimental sub-tunnel #2-1 is considered for AE monitoring. It is a crossing hole between the headrace tunnels #2 and #3.Thus, by adopting various monitoring instruments embedded, the AE sensors can be deployed to monitor rock performances of the headrace tunnel #3 excavated by TBM. After optimization design,the layout of AE sensors for field monitoring of the headrace tunnel#2 is shown in Fig. 3.
The AE sensors are amounted on the cross-sections 11-11 and 12-12. The stake number of the cross-section 11-11 is Y(3)13+425,and monitoring boreholes are correspondingly numbered from top to bottom, A11-11, B11-11 and C11-11. The cross-section 12-12 is located at the stake of Y(3)13+428 with monitoring boreholes numbered A12-12, B12-12 and C12-12, from top to bottom. There are two sensors arranged in each monitoring borehole and the spacing between them is 3.05 m.
Positive direction of the X-axis in the monitoring system is considered as the direction of TBM advancing. The coordinates of cross-sections 12-12 and 11-11 in the X-axis are 0 mm and 3000 mm, respectively. The Y-axis represents the vertical direction,and the Z-axis is the direction of hole-depth. Sensors 1, 3, 5, 7, 9 and 11 are located in the vicinity of the headrace tunnel #3. The 3D relations of the sensors in the operation system are shown in

Fig. 2. Photographs for the AE sensors hole at some sections in different depths(unit: m).

Fig. 3. Layout and installation of AE monitoring sensors.

Fig. 4. Location of sensors in the operation system.

Fig. 5. Spatial location of AE monitoring zone.
Fig. 4. The relative positions of the sensors and the headrace tunnel#3 after geodetic coordinate transformation are illustrated in Fig. 5(Ge, 2012).
2.4. Frequency of the AE monitoring system
The SH-II-SRM AE monitoring system developed by PAC and the sensors of the R.45IC-LP-AST type employed in this study can receive AE burst signals with frequency ranging from 1 Hz to 1 MHz,and the frequency of valid signals range from 1 kHz to 50 kHz. In total, this monitoring system can mainly receive rockburst signals with higher frequency ranging from 1 kHz to 50 kHz theoretically.
3. Characteristics of AE signals
3.1. Determination of AE velocity
The P-wave velocity of rock masses in the experimental subtunnel ranges from 3100 m/s to 6300 m/s, averaging 4800 m/s. The single-hole acoustic wave velocity in this area is 4600-6700 m/s,averaging 6100 m/s.
Considering that the scope detected by the sound waves from a single hole is smaller than that the seismic waves do, it is wise to select the seismic wave as the AE wave. Moreover, the maximum distance of AE sensor detection can reach over 10 m. The AE wave velocity in rock masses in the monitoring region is higher than that on the surface of rocks. Thus, after calculating and testing, the velocity of seismic wave with 5% increment (i.e. velocity of approximately 5 km/s) is used for AE signals. This velocity is adopted in the experimental sub-tunnel #2-1. Although simulation results and analyses of observed AE data illustrate that a little error is induced and location error will be produced when using one value of velocity because of the rock heterogeneity in the studied area, the velocity employed is basically acceptable.
3.2. Screening of effective AE signals
The AE signal sources during TBM tunneling would be inevitably disturbed by rock mass rupture, rock broken by cutter head,mainframe vibration, bolt drilling, blasting vibration and electromechanical interference, etc. Except for the short-term blasting vibration and random electromechanical interference, other interferences make the sensors self-oscillated, and their vibration energies are basically great, thus filtering the frequency noise is not an easy task associated with present technology because the frequency ranges of noise are surprisingly wide. During TBM excavation, the AE signals coming from rocks in the vicinity of monitoring regions are very strong. For instance, rocks under forced continuous process can produce 2 × 106kB signals every 10-30 min, and each signal accounts for 2-3 kB. Therefore, twelve sets of sensors can receive approximately 1 × 10⁵signals in one minute at the same time. It is an impossible mission to filter the huge number of signals artificially, although we have received over 1 × 10⁸AE signals (about 300 GB) in total. At present, time- filtering is the most effective way to get rid of the pseudo-AE signals that come from the self-vibration of AE sensors. Thus, it will be used in the paper, and the signals from TBM or bolt disturbance can be analyzed after filtering. The limits of this method are that most of effective signals with enriched information will be lost, only the AE signals in relatively quiet state can be used, which can lead to an illusion at different times.
3.3. Waveform characteristics of burst AE signals
Waveforms of various types of AE signals received from burst sensors are captured. However, it is not easy to analyze each signal individually and to illustrate all characteristics of waveforms of AE signals associated with complex patterns. Thus, we present two typical AE signals, as shown in Fig. 6. In order to achieve a 3D location, one signal should be received by three or more sensors at the same time and those signals received by different sensors should be identical as possible.

Table 1Schedule of TBM construction.
4. AE monitoring process
When the working face advanced 50 m before the monitoring area, AE monitoring began to work till the working face was 150 m away from the monitoring system. Basically, AE monitoring will last for approximately 20 days. For the headrace tunnels with a diameter of 12.4 m, the AE monitoring process can be divided into three stages, nine steps in total according to the relation between TBM excavation distance and tunnel diameter. The three stages are:
(1) Before the working face arrived at the center of the monitoring area (from -3.5D to -0.5D, where D is the tunnel diameter).
(2) The working face arrived at the center of the monitoring area(-0.5D to 0.5D).
(3) After the working face left the center of the monitoring area(0.5D-3.5D).
The construction schedule in nine steps is shown in Table 1.
4.1. Signal characteristics before excavation
Before the working face arrived at the center of the monitoring area, few shock signals were captured, which means that valid positioning events could not be captured. It indicates that the TBM has no effect on the rocks in the monitoring area before the first stage.In this process, the rocks were stable, and there were no evident fracture signals.
4.2. Signal characteristics when excavation approached monitoring area
Before the first and second stages (about 6.2 m away from the center of the monitoring area), rockbursts occurred in the monitoring area. The rockbursts were observed at the front of the working face and the top-right tunnel, basically within the distance of 7 m. In addition, more and more burst events were recorded when the working face advanced closer to the monitoring system.However, the regularity of the general distribution of rockbursts was not significantly reasonable, which showed that there were some micro-fractures in rocks without excavation unloading effect before the headrace tunnel #3 was excavated and, moreover, more random events were recorded. Distribution of the burst signals in this period of time is shown in Fig. 7.
4.3. Signal characteristics when excavation was near the monitoring section
When the TBM passed through the monitoring center, i.e. ±0.5D(about ±6.2 m), the monitoring lasted for about 20 h, of which 12 h signals are valid for analysis. In this process, the headrace tunnel#3 approached gradually and excavation unloading began to have a strong effect on the stability of surrounding rocks. The burst signals were observed to concentrate on the right spandrel, which means that spandrel part of the tunnel suffered the largest deformation during a short period of time after completion of the tunneling.During monitoring, rockbursts were observed in a concentrated area 1-3 m away from the tunnel wall at the right middle part of the tunnel. The results showed that the surrounding rocks in this region were unexpected fragile, where a structural plane was located. Distribution of the burst signal in this period of time is shown in Fig. 8.
4.4. Signal characteristics after TBM left monitoring center
In this process, the stresses of surrounding rocks of the tunnels were redistributed and adjusted, and thus the rockburst signals were distributed in the area centered around the tunnel axis. Distribution of the burst signals in this period is shown in Fig. 9.
5. Analyses of AE monitoring results

Fig. 6. Typical waveforms of burst signal from AE monitoring.
5.1. Distribution characteristics analysis of rockburst AE signals
After the tunnel was completed, the rockburst AE signals were represented by the stress adjustment itself. The long axis-direction of the signal distribution was approximately consistent with the direction of the maximum principal stress. The AE signals were mostly concentrated in the range of 1.5-5 m away from the borehole wall, and mainly concentrated in the range of 2-4 m away from the borehole wall. For this reason, we hereby divided the monitoring ranges into three regions: (1) fully relaxed region of rocks, 0-1.5 m away from the borehole wall; (2) disturbed region of rocks, 1.5-5 m away from the borehole wall; and (3) primary region of rocks, 5 m away from the borehole wall. The rocks might possibly become parts of relaxed region, or restore to primary rocks as a result of stress adjustment for a long period of time after being disturbed. This understanding accords with the average relaxation depth, 3-4 m, of surrounding rocks detected by the AE method. The comprehensive distribution characteristics of the AE signals, long after completion of excavation, are shown in
Fig. 10.

Fig. 8. Distribution characteristics of burst signals when excavation was near the monitoring section.

Fig. 9. Distribution characteristics of burst signals when excavation was far away from the monitoring section.
5.2. Analysis of rockburst AE signals
5.2.1. Energy distribution of characteristics of rockburst AE signals
The AE monitoring started on 1 December 2009 and ended on 31 December 2009. The number of valid signals captured for analysis is 19,605; the maximum energy value of all the signals is 65,535,the average energy value is 386, and the sum of average energy value is 8,941,389. Before arriving at the monitoring location (12 h before tunneling), the maximum energy value, the average energy value and the average energy value monitored are comparatively low. These data clearly illustrate that in situ stresses endured by rocks are limited, and the in situ stresses have a little effect on the stability of rocks. The AE signal intensity was weak before the TBM passed through the central monitoring location (in 20 h before and after tunneling). When the rocks were suddenly unloaded locally,the signal energy rapidly increased to a higher level and the signal intensity was very strong. After the working face passed through the monitoring section 0.5 times the tunnel diameter, the signal energy gradually reduced, and on the whole the AE signals intensity was weakened. The average energy value firstly decreased, then increased and finally decreased again, in the range 7.5 times the tunnel diameter in one week after tunneling. It illustrates that the rocks can endure great stress adjustment locally long after tunneling. The average energy distribution characteristics of the burst signal from AE monitoring in different phases are shown in Fig. 11.

Fig. 10. Comprehensive distribution characteristic of AE signals long after completion of excavation.
5.2.2. Penetration distance and amplitude of the burst signal from AE monitoring
The average time difference, ΔT, of the positional signal away from some sensors was 0-1200 μs, averaging 483 μs. It means that the valid distance of the positional signal away from some sensors is 0-6 m and the valid average distance is 2.4 m. The amplitude of the burst signal monitored ranges from 20 dB to 99 dB, averaging 46 dB.
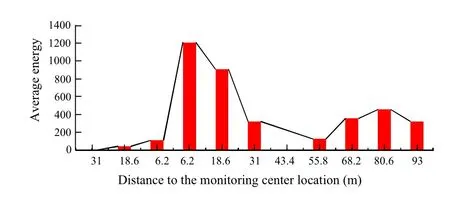
Fig. 11. Average energy distribution characteristics of the burst signals from AE monitoring.
5.2.3. Variation characteristics of AE events captured from rockburst in the monitoring area
During the whole process of AE monitoring for rockburst, 4633 valid positioning events were recorded. In the whole process of AE monitoring, the frequency of the burst signals was relatively high when the tunnel advanced away from the monitoring center,i.e. -1.5D to -0.5D and -0.5D to 0.5D away from the monitoring center. In the range of -0.5D to 0.5D, the huge pushing force of the TBM had significant effects on the rock structure and stability. Local damage was observed and the rockburst was few. In the range of 0.5D-2.5D, the headrace tunnel #3 was formed and the amount of rockburst was relatively great. In the range of 3.5D or more, the stress in rocks was adjusted and the amount of rockburst was reduced with rock stress adjustment and elapsed time (Fig. 12).
6. Discussion
This paper has employed the AE to study the burst characteristics and distribution in the rock before and after excavation of TBM tunnel. But there are still some problems and deficiencies for the monitoring results:
(1) TBM excavation is a continuous and dynamic process, so the rockburst signal and various noises should occur in a continuous process, too. These make it very difficult to locate, recognize and choose the AE signal. In other similar monitoring, the program should be optimized to make the monitoring fit for the excavating progress, and to ensure the monitoring progress is easy to be controlled, or the experiment should be conducted in the section constructed by D&B or other methods directly.
(2) The strong and continuous interference makes most of the AE signals stack with the white noise. This increases the difficulty in analyzing the AE data, making us have to give up a lot of
effective signals.
(3) Due to the limitation in technology, AE signals are not analyzed in detail. Some aspects such as frequency analysis, power analysis, signal stack, etc. are not considered, and in-depth analysis should be conducted for the relationship between AE signal and rock stress change.
(4) Limited by monitoring conditions, the range of this location test is a little small. This induces that a large number of concentrated or random AE signals of rockburst cannot be collected or are missed, making monitoring results significantly affected.For other similar tests, we should enlarge the monitoring zone,and increase the number of AE sensors, in order to detect the distribution regularities of rockburst AE signal more easily, and to reduce the errors caused by local factors (Barton, 2012).

Fig. 12. Number of events captured from AE monitoring with elapsed time (in 2009).
7. Conclusions
Through the AE monitoring in Jinping II hydropower station,the rockburst AE signals in different stages were captured. The recorded data provide helpful information for optimization design of support parameters. Some conclusions can be drawn as follows:
(1) According to the relationship among monitoring location, TBM advancing, and distribution of AE rupture, the process of AE signals can be divided into four stages. At first, before the TBM approached the position -1.5D away from the monitoring center, the great driving force of the TBM has significant effects on rock structure and stability, especially on locally damaged rocks. However, no or minor deformation happened in rocks in this stage. Secondly, when the distance between the TBM tunnel face and monitoring center is -1.5D to -0.5D or -0.5D to 0.5D, significant deformations of rocks were observed, and high and intensive frequency of AE signals occurred during the process of stress adjustment. Next, in the range of 0.5D-2.5D,the stress was adjusted and the rock deformed continuously.Sudden rupture signals still existed but the number and distribution range of signals were reduced. Finally, in the range of 3.5D or more, the ability of stress adjustment of rocks was reduced, and the number and frequency of burst signals were reduced significantly (Liu et al., 2006).
(2) After the headrace tunnel #3 was constructed, AE signals monitored were mainly caused by the rupture of rock mass and stress adjustment, and the long-axis orientation of burst signals was generally in line with the maximum principal stress direction. The rockburst signals distributed radically around tunnels along the axis center of tunnel.
(3) The rupture signals monitored were mainly distributed in the range of 1.5-5 m away from the borehole wall. The signals were concentrated at the depth of 2-4 m inside the tunnel wall.Therefore, complete relaxation of rock zones was located in the range of 0-1.5 m inside the tunnel wall. The EDZ of rocks was 1.5-5 m deep inside the tunnel wall. The region behind those areas can be considered as original status, where the property of disturbed rocks was close to the nature state of original rocks after stress adjustment (Liu et al., 2011).
(4) Before the tunnel was completed, rockburst was induced by the in situ stresses, which have minor impact on the stability of rocks. At that time, the rupture signals were weak. In the process of TBM passing through the monitoring center(within 20 h before and after excavation), the tunnel was completed and local rocks were suddenly unloaded. At the same time, each energy index of AE signals rapidly reached a higher level and the energy of signals was great. When the working face passed through the monitoring section 0.5D, the AE signals were reduced generally. It showed that average energy of signals decreased firstly, then increased and finally decreased,when the excavation was completed. It also demonstrated that stress adjustment of local rocks might still exist in a long period of time after construction of tunnel (Fu, 2005).
Since energy, signal strength and absolute energy are not directly convertible to physical unit in applications, it is better to treat them dimensionless.
The characteristics of rock AE signals are related to the mechanical properties of marble in the studied area. However, the regularity and representativeness still of AE signals need further verification.
Acknowledgements
Helps from relevant experts in East China Investigation and Design Institute and USA Physical Acoustics Corporation (Beijing)are highly appreciated.
Barton N. Reducing risk in long deep tunnels by using TBM and drill-and-blast methods in the same project—the hybrid solution. Journal of Rock Mechanics and Geotechnical Engineering 2012;4(2):115-26.
Drouillard T. Acoustic Emission: A Bibliography with Abstracts. New York: IFI Plenum Data Company; 1979.
Fu XM. Experimental study on uniaxial compression deformation and acoustic emission property of typical rocks. Journal of Chengdu University of Technology(Science and Technology Edition) 2005;32(1):17-21 (in Chinese).
Ge M. Efficient mine microseismic monitoring. International Journal of Coal Geology 2005;64(1-2):44-56.
Ge M. Source location error analysis and optimization methods. Journal of Rock Mechanics and Geotechnical Engineering 2012;4(1):1-10.
Katsuyama T. Application of Acoustic Emission Technique. Beijing: China Metallurgical Industry Press; 1996 (in Chinese).
Li SL, Yin XG, Wang YJ, Fang HY. Studies of acoustic emission characteristics of uniaxial compressive rock failure, vol. 23. Chinese Journal of Rock Mechanics and Engineering; 2004. p. 2499-503 (in Chinese).
Liu DM, Cai MF, Zhou YB, Chen ZY. Dynamic monitoring on developing process of rock cracks. Chinese Journal of Rock Mechanics and Engineering 2006;25(3):467-72 (in Chinese).
Liu LP, Wang XG, Zhang YH, Jia ZX, Duan QG. Tempo-spatial characteristics and influential factors of rockburst: a case study of transportation and drainage tunnels in Jinping II hydropower station. Journal of Rock Mechanics and Geotechnical Engineering 2011;3(2):179-85.
Lockner D. The role of acoustic emission in the study of rock failure. International Journal of Rock Mechanics and Mining Sciences and Geomechanics Abstracts 1993;30(7):883-99.
Talebi S, Young RP. Microseismic monitoring in highly stressed granite: relation between shaft-wall cracking and in situ stress. International Journal of Rock Mechanics and Mining Sciences and Geomechanics Abstracts
1992;29(1):25-34.
Wu SY, Wang G. Rock mechanical problems and optimization for the long and deep diversion tunnels at Jinping II hydropower station. Journal of Rock Mechanics and Geotechnical Engineering 2011;3(4):314-28.
 Journal of Rock Mechanics and Geotechnical Engineering2013年6期
- Journal of Rock Mechanics and Geotechnical Engineering的其它文章
- Stability analysis of back filling in subsiding area and optimization of the stoping sequence
- Numerical evaluation of strength and deformability of fractured rocks
- Feasibility evaluation for excavation of Naghshe Jahan Square subway station by underground methods
- Dam foundation excavation techniques in China: A review
- Prevention and treatment technologies of railway tunnel water inrush and mud gushing in China
- Afteruse development of former landfill sites in Hong Kong