
Stability analysis of back filling in subsiding area and optimization of the stoping sequence
2013-10-19 06:57PingWngHuiqingLiYnLiBoCheng
Ping Wng, Huiqing Li, Yn Li, Bo Cheng
aSchool of Civil Engineering & Mechanics, Huazhong University of Science and Technology, Wuhan 430074, China
bSchool of Resource and Environmental Engineering, Wuhan University of Science and Technology, Wuhan 430081, China cChenzhou Mining Group Co., Ltd., Huaihua 419607, China
1. Introduction
Caving methods of mining basically rely on the goaf to release ground pressures, which helps pressure mitigation in underground mining (Li, 2011). However, it may also cause the overlying rocks to subside and eventually collapse (Song et al., 1995; Wu et al.,2009), which can affect large areas around underground mining areas and pose a serious threat to human activities or natural habitats at the surface (Li et al., 2010). In this regard, we take the Zhangfushan section in the Jinshandian iron mine as an example to study back filling and optimization of the stoping sequence. The Zhangfushan section in the Jinshandian iron mine is divided into east and west wings by the exploration line 25. At present, nonpillar sublevel caving, with a level of 70 m and a sublevel of 14 m,is used to exploit the ore body in the west wing. The length of the ore block is basically 80 m along the strike of the ore body and the annual production capacity of the Zhangfushan section is about 2.5 million tons. Each year nearly 0.5 million tons of waste rocks are used to back fill the subsiding area according to environmental protection and safety production requirements. Newly formed goaf can affect the stability of the back filling body, and may enlarge the area subsidence, ultimately causing damage to the haulage road used for back filling. In addition, looseness of the back filling body contributes to the instability of the goaf. Currently,there is no full proof scheme of back filling, therefore, studies on the relations of surface subsidence and underground mining, the stability of the back filling body, the optimization of the stoping sequence, and the safety of the back filling trucks, are apparently needed.
Presently, there are many studies on the relationship of surface subsidence and underground mining, and prediction methods regarding the area of subsidence. For example, Zhao et al. (2012)simulated the surface subsidence induced by underground mining.Yang and Chen (2011) adopted FLAC3Dto simulate the surface displacement in underground mining. Numerical methods are becoming a major and effective research tool (Yue and Guo, 2008;Chen et al., 2010). The back filling body is practically treated as solid bulk and the rest of the rock body is considered continuous and elastic. Thus, model simplifications are needed to satisfy engineering requirements. In this paper, we treat the solid bulk as a continuous medium, and use imaginary rather than actual forces and the strength at failure to model mechanical properties(Huang, 1993). We employ ANSYS to simulate the stability of the back filling body in the Zhangfushan section. The relation between surface subsidence and underground mining is analyzed and the stoping sequence is optimized consequently.
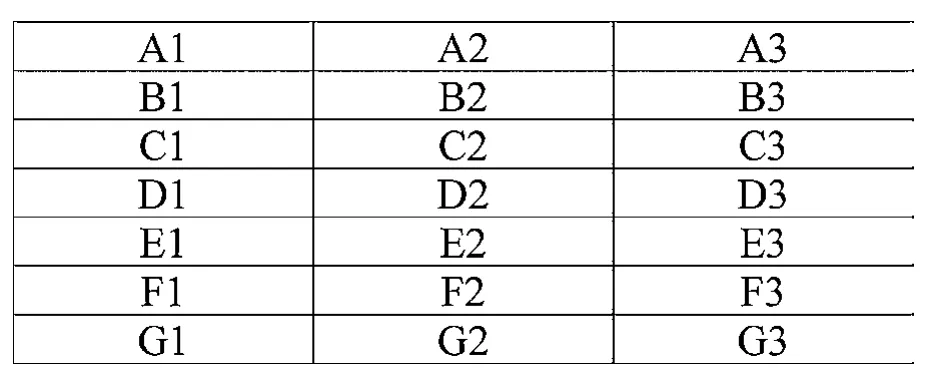
Fig. 1. Sequentially numbered ore body sections.
2. Design of the stoping process
The stoping of the ore body is located between -312 m and-410 m in the west wing, including seven segments from A to G (from top to bottom). Each segment is subdivided into three stoping subsections (#1, #2, and #3), considering the long strike,work strength, and project layout. The segments are subsequently marked as A1, A2, A3, B1, B2, B3, . . ., as illustrated in Fig. 1.
Basically, the first or last stoping of the central ore body can easily lead to large deformations in the tunnel, which will cause great stress on the tunnel structure. Subsequently, other stoping sequences are adopted instead of the central-to-two-wings stoping sequence and the two-wings-to-central stoping sequence according to the site-specific conditions in the west wing. Continuous stoping in various sections is required to maintain targeted production. Upper segment stoping should be earlier than underlying segments. The two proposed schemes are listed in Figs. 2 and 3.

Fig. 2. Stoping sequence of Scheme 1 (numbers are mining steps).

Fig. 3. Stoping sequence of Scheme 2 (numbers are mining steps).
3. Numerical modeling
In the simulations, the assumptions are the same as those employed in Pu (2010). We ignore the influence of the pressure of groundwater seepage on rock stability, and regard the rocks as continuous media; the contacts between various rock strata are considered conformable. The physico-mechanical parameters reflecting the jointed geological formations are used, but the influence of tectonic stress is not considered. In this paper, the gravitational stress is regarded as the original rock stress fields.The upper boundary of the model is free and the lower boundary is fully constrained. The pre-boundary in the left of Fig. 4 is Y-axis constraint and the post-boundary in the right of Fig. 4 is X-axis constraint. The collapse and back filling bodies are considered as loose media and the corresponding mechanical parameters(Zhang, 1999; Zhang et al., 2010) are taken by engineering analogs.The parameters used in the simulation are listed in Table 1.
With the assumptions mentioned above, a three-dimensional model using ANSYS can be established according to the characteristics of ore body and related mining methods. The model dimensions are 8000 m × 5000 m × 1770 m. Figs. 4 and 5 show the grid and the model of the Jinshandian mine, respectively.
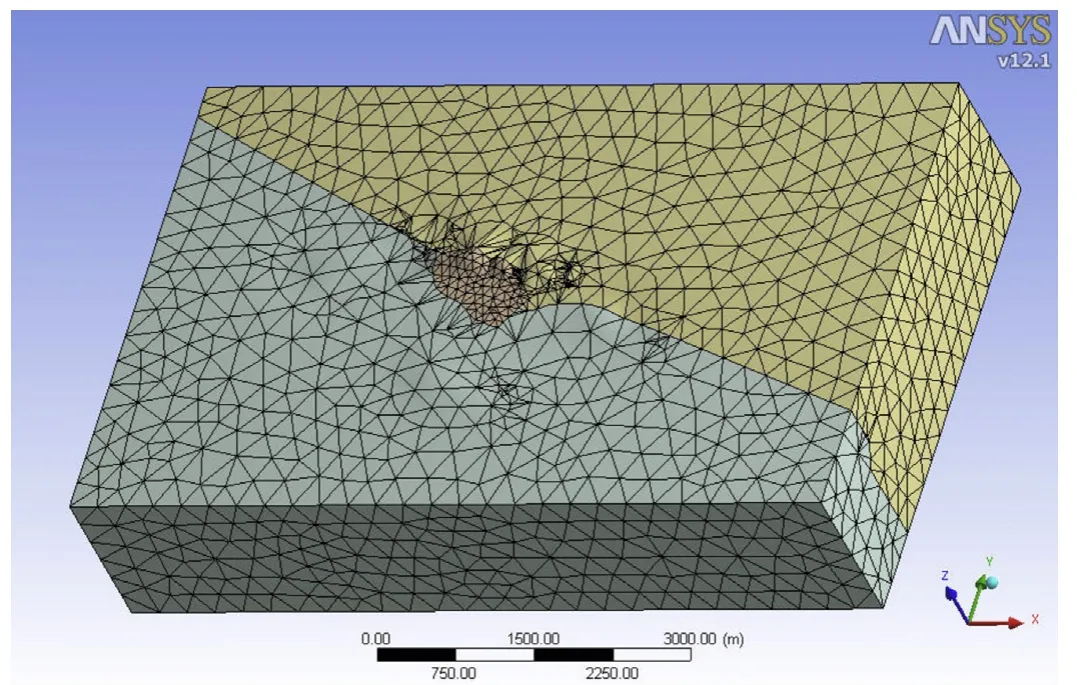
Fig. 4. Grid model.

Fig. 5. Model of the Jinshandian mine.
4. Stability analysis of back filling body and mining stope
To model the surface subsidence, it is noted that a profile analysis in a typical direction that is based on mining conditions, mining techniques, and subsidence area conditions should be conducted.Thus, the subsidence area associated with engineering geological and mining conditions should be considered in combination with the complex site-specific ore body. Accordingly, we select profile#23 in the eastern edge of the western area as a typical case (see
Fig. 6), and use three measuring points to monitor the field displacements and stresses (Zhang et al., 2010). Monitoring point 1 is the contact point at the surface of the back filling body and surrounding rocks; monitoring point 2 is located at the middle and upper level of the back filling body, which is in the hanging wall.The practical mining process and the back fill sedimentation can be numerically analyzed, compared to the actual mining conditions.

Fig. 6. Pro file #23 in the eastern edge of the western area.
4.1. Initial stage of actual mining
In the actual mining conditions, the ore body higher than-312 m in the western area has already been stoped. The collapse body extends downward to this level and the back filling body is above the collapse body up to the ground surface.
4.1.1. Analysis of back filling body displacement
Fig. 7 shows the X-, Y-, and Z-displacements, respectively, of the back filling body in meter. The long-axis direction of the backfilling body is close to the western ore body with a NWW-SEE trend. The X-displacement of the surface of the back filling body is 0.095-0.193 m and decreases along the long-axis direction from west to east and the area around it. The X-displacement of the west side is higher than that in the east side; furthermore, the maximum displacement can be observed at the end of west side.

Fig. 7. The X-, Y- and Z-displacements of the profile #23.
In profile #23, the X-displacement of the surface of the backfilling body is the largest in the hanging wall and decreases horizontally and vertically, as in a shape of circular arc. The Y-displacement keeps constant in the middle of the back filling body in the east of the mining area surface, whereas it is significantly varied in parts of the western area. In general, the Y-displacement is much larger in the west and the middle parts, but is the smallest at the contact zone of the hanging and foot walls. The curves of the X- and Y-displacements are similar. The displacement along the Z-direction is mainly caused by gravity and larger than the X- and Y-displacements. The Z-displacement is the largest in a small hill near the foot wall of the surface of the back filling body, approximately along the long-axis direction, and decreases toward the hanging wall in a form of circle arc. The Z-displacement of the backfilling body surface is 1.8-2.3 m. In profile #23, the distribution of Z-displacement sector decreases toward the hanging wall; the displacement of the shallow parts is larger than that of the deep parts.

Table 1Physico-mechanical parameters of rocks.
The horizontal displacement of the area is the largest in the middle part along the long-axis of the back filling body and decreases like an arc downward. In the north, the horizontal displacement in the long-axis direction changes from NNE to WE, suggesting that the horizontal movement of the back filling is normal, and the movement is the largest in the middle and decreases toward the wings. The vertical displacement of the back filling body surface is evenly distributed, and the Z-displacement of the area in vicinity of the foot wall is the largest and decreases toward the hanging wall.The profile #23 shows that the vertical displacement decreases from the foot wall to the hanging wall and from the surface to the bottom.
Thus, it is believed that the back filling body moves from the hanging wall to the foot wall, which causes stress imbalance and has the same trend as the vertical displacement. Conversely, the vertical displacement of loose rocks moves from the hanging wall to the foot wall, contributing to the increase in the horizontal displacement. During the sedimentation of the back filling body, a stress balance is reached, thus the displacements are compatible.The sedimentation in the middle of the back filling body is funnelshaped, whilst in the profile #23 it looks like a V-shape. Thus, the movement of the back filling body and the surrounding rocks at the contact zone causes landslides. The result agrees with the field measurements in the -298 m subsidence area of the Zhangfushan iron mine.
4.1.2. Principal stress analysis of the -312 m mining stope
In the initial stage of mining, there is no tensile stress on the-312 m mining stope and the surrounding area. Fig. 8 shows that the compressive stress is the smallest at the contact zone of the western ore body and the hanging wall of the surrounding rocks,increasing toward the wings. It reaches to 1 MPa gradually at the contact zone of the western ore body and the foot wall. The compressive stress concentrates at the surrounding rocks near the foot wall. The maximum principal stress σ1of the western ore body is significantly high in vicinity of the hanging wall and the wings of the surrounding rocks near the hanging wall. There is no disturbance in the eastern ore body, thus the stress distribution in the ore body and surrounding rocks is constant.
Fig. 9 shows the mined-out area filled with rock blocks and the considerable stress changes after the actual mining of the ore body above -312 m are observed. The compressive stress concentration is high at the contact area of the western ore body and the foot wall.The maximum compressive stress in the west side of the surrounding rocks is 13.71 MPa and decreases along the direction of the foot wall. The compressive stress at the contact zone of the western ore body and the hanging wall is relatively small, whereas it increases toward the hanging wall. In the stable (balanced) stress field, the western ore body is highly compressed at the foot wall.

Fig. 8. The maximum principal stress σ1of the -312 m stope at the initial stages of mining.
4.2. Simulation results of actual mining
As mentioned in Section 4.1.2, in the initial stage of mining, there is no tensile stress effect on the -312 m mining stope. However, as the ore body is long and extremely narrow, the compressive stress in the mining section is significantly high; therefore, it is necessary to analyze the minimum principal stress of the mining stope and to monitor the displacement of the back filling body.

Fig. 9. The minimum principal stress σ3of the -312 m stope at the initial stages of mining.
4.2.1. Analysis of the minimum principal stress in typical mining steps
(1) Stress analysis of steps 4 and 9 in Scheme 1
Scheme 1 has 4 steps and represents actual mining at the-354 m level of the C1 west side. Fig. 10 shows the minimum principal stress of the -354 m mining area. Due to the support in the C1 region, the ore body and the surrounding rocks of the next sublevel will have to withstand the gravity of the unconsolidated layers above. The maximum compressive stress at the contact zone of the C1 mined-out area and the foot wall is 21.43 MPa. The compressive stress is largest in the west side of the mined-out area. The maximum compressive stress is lower than the allowable maximum compressive strength of the ore body and surrounding rocks, therefore, the mining stope is basically stable. Furthermore, the compressive stress is high at a small area of the foot wall. When the partial compressive stress is higher than the limit compressive strength, the drifts in the mining stope will probably fail. As a result, the drifts should be reinforced.

Fig. 10. The minimum principal stress σ3of the -354 m level at step 4 of Scheme 1.
After step 9 of the actual mining, the caving rocks are used to fill the mined-out F1 and F2 areas. Fig. 11 shows the minimum principal stress σ3distribution of the -396 m level, where the maximum compressive stress is 20.54 MPa and concentrates on the west side of the F3 area of the ore body. Two slivers in the foot wall of the surrounding rocks near the F1 and F2 mined-out areas have a compressive stress of about 39.0 MPa.It is apparent that the compressive stress is high at the contact zone of the mined-out area and the foot wall of the surrounding rock, ore body, and the roof of the goaf. The eastern part of the ore body experiences compressive stresses, approaching the compressive strength limit.

Fig. 11. The minimum principal stress σ3of the -396 m level at step 9 of Scheme 1.
(2) Stress analysis of steps 4 and 9 in Scheme 2
Considering the actual condition of level -340 m above by inverse sequence mining, C3 ore body of -340 m to -354 m at east side is mined out. Fig. 12 shows the minimum principal stress distribution in the -354 m mining area, like that of Scheme 1. In the C3 mined-out area, high compressive stress is observed at the contact area of the west area and the foot wall of the surrounding rocks. The high compressive stress is widely distributed at the contact area readily for mining and the foot wall of the ore body. The maximum compressive stress is about 20.28 MPa. In the foot wall of C1 and C2 areas, an area of high compressive stress is observed.

Fig. 12. The minimum principal stress σ3of the -354 m area at step 4 of Scheme 2.
In Fig. 13, the pillar of -396 m in vicinity of the mined-out area has a maximum compressive stress of about 20.05 MPa.Compared to step 4, the compressive stress range of the mined out area is 5-10 MPa in step 9. The maximum compressive stress of the mined-out area is observed in the middle of F2 near the foot wall and the west area of F3. The surrounding rocks of the mined-out area experience high compressive stresses,except in the west and middle areas of the hanging wall in F2.In the F1 area, the stress distribution is similar to that in step 4. Only the stress at the wings of the mined-out area increases significantly. The low rocks in the mined-out areas of F1 and F2 near the foot wall are observed with a compressive stress of about 39.0 MPa.
4.2.2. Displacement in Schemes 1 and 2
In the Schemes 1 and 2, the X-, Y-, and Z-displacements of the three monitoring points are close to those in the initial stage of the actual mining. In each mining step, the X-displacements of monitoring points 1 and 3 are nearly the same (0.106-0.107 m), and that of monitoring point 2 is 0.014 m. However, the Y-displacements of the three monitoring points are quite different. The minimum Y-displacement of monitoring point 1 is 0.243-0.244 m, and the maximum Y-displacement of monitoring point 2 is 0.310-0.314 m,whilst the maximum Y-displacement of monitoring point 3 is 0.288-0.289 m. The Z-displacement of monitoring point 2 is the largest, basically 2.125-2.127 m. The Z-displacement of monitoring point 2 is 1.790-1.792 m, and that of monitoring point 3 is about 1.787 m. It shows that the surface of the back filling body and the displacements in three dimensions are relatively stabilized after the surface is back filled.

Fig. 13. The minimum principal stress σ3of -396 m at step 4 of Scheme 2.
5. Optimization of the stoping sequence
In the mining process, the maximum and minimum principal stresses of the mining schemes are displayed in Fig. 14. The maximum value of σ1in steps 6 and 8 of Scheme 1 is 0.34 MPa larger than those of Scheme 2. The other mining steps are relatively stable at a lower level. In Scheme 2, the maximum value of σ1is considerably large in step 3, and those in most steps are of high stress.

Fig. 14. The maximum and minimum principal stresses of Schemes 1 and 2.
In contrast to the minimum principal stress σ3in the two mining schemes, the maximum compressive stress in Scheme 1 is significantly increased after mining section A1, and is decreased to 18.95 MPa after mining sections A3-B2. In the other steps,it maintains at 20-22 MPa and the changes are observed from sharp to slow. In Scheme 2, mining proceeds from east to west.After mining section A1, the maximum compressive stress is about 3 MPa less than that in Scheme 1. After that, it increases to 22.75 MPa with a relatively slow speed. The maximum compressive stress is basically located in the ore body or the foot wall and it does not exceed the ultimate compressive strength of the rock mass. The optimized mining scheme is the one in which the stress changes at a relatively slow speed and then remains at a low stress value. Therefore, Scheme 1 is prior to Scheme 2. In addition, the stresses in Scheme 1 are smaller with a slight fluctuation. As a result, the safety of the back filling body is good.
6. Conclusions
(1) The displacements of the early-back filling body in the mining process are analyzed. The surface of the central back filling body looks like a V-shape funnel. Thus the contact of the surrounding rocks is observed with easy sliding.Simulation results show the reliability of the mining is good.
(2) In the mining process, part of the stress of the goaf is transferred to the surrounding rocks. However, the compressive stresses are large at the contact of the low goaf and the foot wall, the contact of the mined-out area and the ore body, the roof of goaf,etc. Therefore, the stabilities of stope drift and caving should be carefully considered, for which the effective reinforcement measures for the safety of stoping operations should be focused on.
(3) The west-to-east subsection as the optimum mining sequence is selected by numerical analysis. The two schemes, using rock strength in the stoping area, can effectively minimize the stress distribution in the stope, and increase the safety of the back filling body. Therefore, mining program optimization is technically feasible.
(4) To perform static analysis using three-dimensional numerical models in the dynamic mining process, future studies are needed where dynamic analysis and solid-liquid coupling in stress analysis should be considered.
Chen Q, Yang C, Wang S, Zhang D, Zhang G. Investigation on moving and deformation principle of stratum with caving in eastern zone of Jinshandian Iron Mine. Metal Mine 2010;7:1-4 [in Chinese].
Huang S. Granular mechanics. Beijing: China Machine Press; 1993 [in Chinese].
Li J. Metal deposits underground mining. Beijing: China Metallurgical Industry Press;2011 [in Chinese].
Li W, Wen L, Liu X. Ground movements caused by deep underground mining in Guan-Zhuang iron mine, Luzhong, China. International Journal of Applied Earth Observation and Geoinformation 2010;12(3):175-82.
Pu G. ANSYS 12: fundamental course and examples. Beijing: China Water Power Press; 2010 [in Chinese].
Song Z, Chen L, Wang C. Knowledge on face working conditions in mechanized sublevel caving workface. Journal of China Coal Society 1995;20(4):256-360 [in Chinese].
Wu K, Li L, Wang X, Zhang L, Wang Z, Sun X. Research of ground cracks caused by fully mechanized sublevel caving mining based on field survey. In: Proceedings of the International Conference on Mining Science & Technology (ICMST2009);2009. p. 1095-100, http://dx.doi.org/10.1016/j.proeps.2009.09.168.
Yang F, Chen S. Numerical simulations of compound media coupling mechanism of deep mining overburden strata. Transactions of Nonferrous Metals Society of China 2011;21(Suppl. 3):631-6.
Yue B, Guo Z. Application of numerical simulations to mining engineering. Mining Engineering 2008;6(6):5-7 [in Chinese].
Zhang Q. Discussion on quantitative engineering geological analogy to parameter values of geotechnical engineering. In: National geotechnical engineering of computerization use and seminar. Beijing: China Architecture and Building Press; 1999. p. 96-102 [in Chinese].
Zhang Y, Xu M, Wang P, Cheng B. Numerical simulation of cross-regional depressurized mining. China Mining Magazine 2010;19:157-60 [in Chinese].
Zhao H, Ma F, Xu J. In situ stress field inversion and its application in mining-induced rock mass movement. International Journal of Rock Mechanics and Mining Sciences 2012;53:120-8.
 Journal of Rock Mechanics and Geotechnical Engineering2013年6期
- Journal of Rock Mechanics and Geotechnical Engineering的其它文章
- Acoustic emission monitoring of rockbursts during TBM-excavated headrace tunneling at Jinping II hydropower station
- Numerical evaluation of strength and deformability of fractured rocks
- Feasibility evaluation for excavation of Naghshe Jahan Square subway station by underground methods
- Dam foundation excavation techniques in China: A review
- Prevention and treatment technologies of railway tunnel water inrush and mud gushing in China
- Afteruse development of former landfill sites in Hong Kong