
Effects of physical properties on electrical conductivity of compacted lateritic soil
2013-07-10 12:23:42WeiBaiLingweiKongAiguoGuo
Wei Bai, Lingwei Kong, Aiguo Guo
StateKeyLaboratoryofGeomechanicsandGeotechnicalEngineering,InstituteofRockandSoilMechanics,ChineseAcademyofSciences,Wuhan430071,China
Effects of physical properties on electrical conductivity of compacted lateritic soil
Wei Bai∗, Lingwei Kong, Aiguo Guo
StateKeyLaboratoryofGeomechanicsandGeotechnicalEngineering,InstituteofRockandSoilMechanics,ChineseAcademyofSciences,Wuhan430071,China
A R T I C L E I N F O
Articlehistory:
Received 22 November 2012
Received in revised form 28 April 2013
Accepted 3 June 2013
Lateritic soil
Electrical conductivity
Water content
Dry density
Temperature
Natural soils of various types have different electrical properties due to the composition, structure, water content, and temperature. In order to investigate the electrical properties of lateritic soil, electrical conductivity experiments have been conducted on a self-developed testing device. Test results show that the electrical conductivity of laterite increases with the increase of water content, degree of saturation and dry density. When the water content is below the optimum water content, the electrical conductivity of soils increases nonlinearly and the variation rate increases dramatically. However, when the water content, degree of saturation, or dry density increases to a certain value, the electrical conductivity tends to be a constant. In addition, soil electrical conductivity increases with the increase of temperature, and it is observed that the electrical conductivity decreases with the increase of the number of wetting–drying cycles.
© 2013 Institute of Rock and Soil Mechanics, Chinese Academy of Sciences. Production and hosting by Elsevier B.V. All rights reserved.
1. Introduction
The electrical conductivity is one of soil properties, which are associated with the nature of soil composition (particle size distribution, mineralogy), structure (porosity, pore size distribution, connectivity), water content, and temperature. Archie (1942) proposed an empirical relationship (the Archie’s law) based on laboratory measurements of clean sand stone samples. Nevertheless, the Archie’s law is only suitable for saturated rock or sandy soil. In clayey soil, the electrical conductivity is related to the particle size distribution, where the electric charge density is basically located at the surface of the clay particles. Electrical current in soils mainly depends on the amount of water remained in the pores. McCarter (1984) and Fukue et al. (1999) observed through laboratory tests that the electrical resistivity of soils decreases when water content increases. The structures, i.e. the void distribution, geometry of pores, connectivity, and porosity, determine the proportion of air to water according to the water potential. Robain et al. (1996) linked resistivity variations with the structure of pedological materials, identifying that the high and low resistivity values were related to macro- and mesoporosity, respectively. Temperature can excite and change the viscosity of a fluid and thereafter influence the electrical conductivity (Campbell et al., 1949). By conducting laboratory experiments on 30 samples of saline and alkaline soils, Campbell et al. (1949) showed that conductivity increased by 2.02% per°C (in the range of 15–35°C). However, the studies on problematic unsaturated soils such as expansive soil, lateritic soil, and loess, are rarely reported.
Lateritic soil is widely distributed in several southwestern provinces of China such as Hunan, Guizhou, Yunnan, and Guangxi. Lateritic soil is usually considered as a good natural foundation and building material. However, the lateritic soil has many unfavorable properties, such as shrinkage, cracks, water sensitivity and uneven distribution. Thus, usage of lateritic soil as a building material leads to various challenging issues in constructions of highway and high speed railway in these southwestern provinces in China. In those projects, the crack depth, water content and distribution are approximately obtained by borehole surveying, exploration holes, trenching exploration, and pit test. These geotechnical investigations involved extensive workload, time-consuming and low effect. Electrical conductivity experiment offers an attractive tool for describing the subsurface properties without digging, and thus much time and effort can be saved.
In this paper, a self-developed testing device and a digital electrical system are used to understand the relationships between the electrical conductivity (or resistivity) and the characteristics of lateritic soil in Hunan Province, China. The effects of water content, saturation, dry density, temperature, and soil structure on the electrical conductivity of lateritic soil are analyzed as well.

Table 1 The particles size distribution of lateritic soil samples.
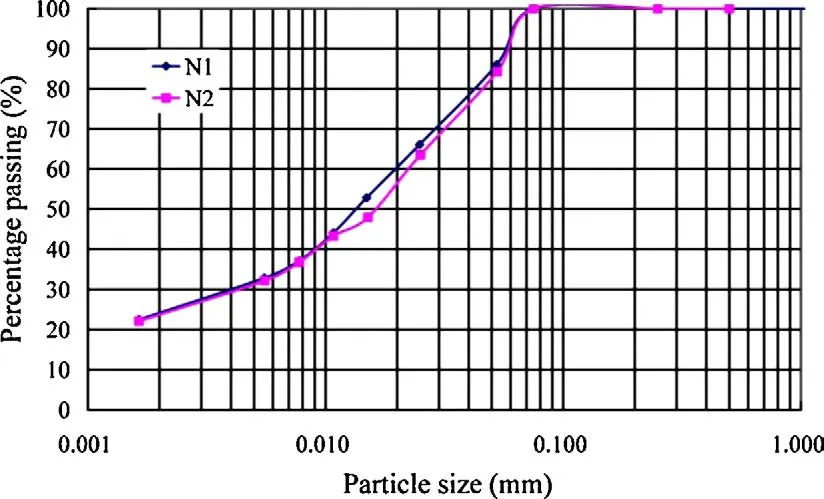
Fig. 1. The grading curve of lateritic soil samples.
2. Test materials
The lateritic soil samples were taken from the Chenzhou section of Xiamen–Chengdu Expressway (depth of 0.8–1.5 m). Test results of the particles size distribution are listed in Table 1, and the grading curve is shown in Fig. 1.
The basic physical indices, such as natural water contentw, bulk density ρ, speci fic gravityGs, liquid limitwL, plastic limitwP, plasticity indexIP, and free swelling ratio (FSR), are listed in Table 2. The compaction curve obtained by the standard Proctor test is shown in Fig. 2. From the curve, the optimum water content (wopt= 23.2%) and the maximum dry density (1.66 g/cm3) are obtained.
The lateritic soils before testing were air-dried, crushed, and sieved through a 2 mm sieve. Hydraulic jack and steel mold (inner diameter of 61.8 mm) were used when preparing for the specimens.
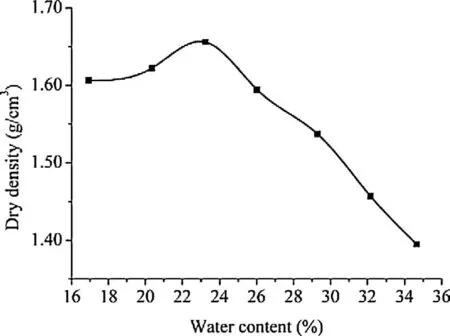
Fig. 2. Compaction curve of dry density and water content.
3. Test methods
Contact conditions between the electrodes and the specimens may affect the measurement accuracy of electrical conductivity. Therefore, contact resistance should be first calibrated. The cylinder specimens with the same diameter (61.8 mm), dry density (1.58 g/cm3), and water content (20%) but different heights (20–125 mm) are tested for determination of electrical resistance under temperature of 20°C. A self-developed testing device (see Fig. 3) and a digital electrical system are used to measure the electrical conductivity (accuracy of measured voltage and current: ±1%).
Temperature and humidity chamber (accuracy of temperature measurement: ±0.5°C) is used to analyze the relationship between temperature and electrical conductivity. The lateritic specimens are sealed by plastic membrane and then are placed in the chamber, where different temperatures (10–45°C) are considered. After three hours, the temperature of the specimens is stable, and then the specimens are picked out for electrical conductivity tests.
Electrical conductivities of different soil specimens (diameter of 61.8 mm and height of 20 mm) with five dry densities (1.30 g/cm3, 1.38 g/cm3, 1.46 g/cm3, 1.54 g/cm3, and 1.58 g/cm3) and four watercontents (14.7%, 19.1%, 23.4%, and 30.8%) are measured. The influences of the water content, degree of saturation and dry density on theelectricalconductivityareanalyzed.
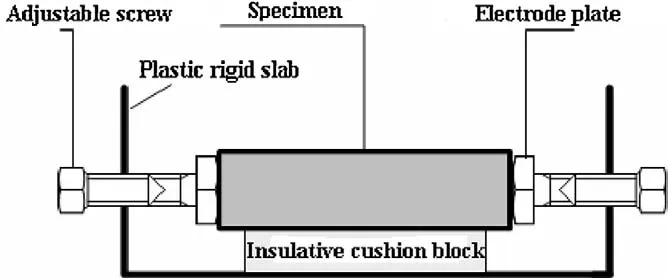
Fig. 3. Schematic drawing of testing device.

Table 2 The physical indices of lateritic soil samples.
Wetting–drying cycles will change the inner structure of the lateritic soil. A lateritic soil specimen with initial dry density 1.58 g/cm3and water content 20% is dried at constant room temperature (20 ± 1°C) until the weight of the specimen is stabilized. And then, vacuum-pumping method is used to saturate the specimen. After this wetting process, the specimen is dried at room and then electrical conductivity is measured until the water content reduces to 20%. This process is the first wetting–drying cycle and a total of four cycles are applied.
Table 3 shows the preparation of specimens for each test. After completion of compaction, all the specimens were wrapped with thin plastic film and stored in the curing boxes (20 ± 1°C) until tested.
4. Results and discussions
4.1.Electricalresistanceofcontactconditionsbetweenspecimen andelectrodeplate
Five soil specimens with different heights are tested for determining electrical resistance. The relationship between electrical resistance and the height of specimen is shown in Fig. 4. According to curve- fitting (coef ficient of correlation,R2= 0.9908), the intercept on the axis of electrical resistance can be obtained, which is regarded as the contact resistanceR0(R0= 116.99 Ω). To get the real electrical resistances, all the tested electrical resistances should subtractR0.
4.2.Effectoftemperatureonelectricalconductivity
The electrical conductivity increases when the temperature increases (see Fig. 5). On the contrary, the electrical resistivity decreases when the temperature decreases (see Fig. 6). This is consistent with the results of Campbell et al. (1949). But the electrical conductivity of lateritic soil is different, and it increases nonlinearly with increasing temperature. As shown in Fig. 5, the electrical conductivity changes rapidly when the temperature is above 30°C. Fig. 6 reveals that the electrical resistivity decreases slowly when the temperature is above 40°C.
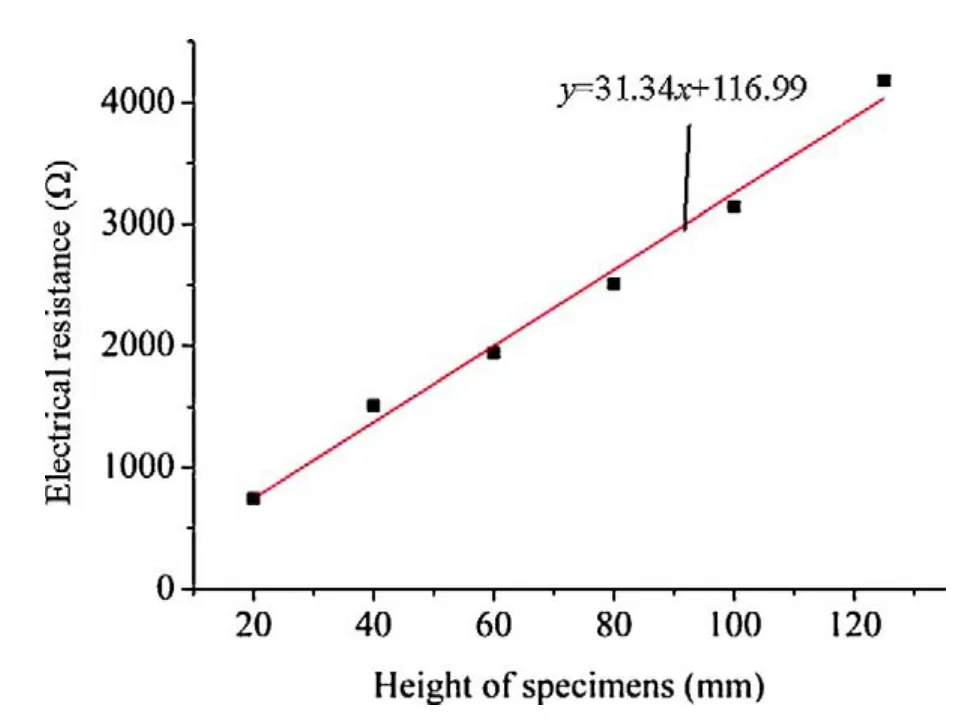
Fig. 4. Relationship between electrical resistance and the height of specimen.
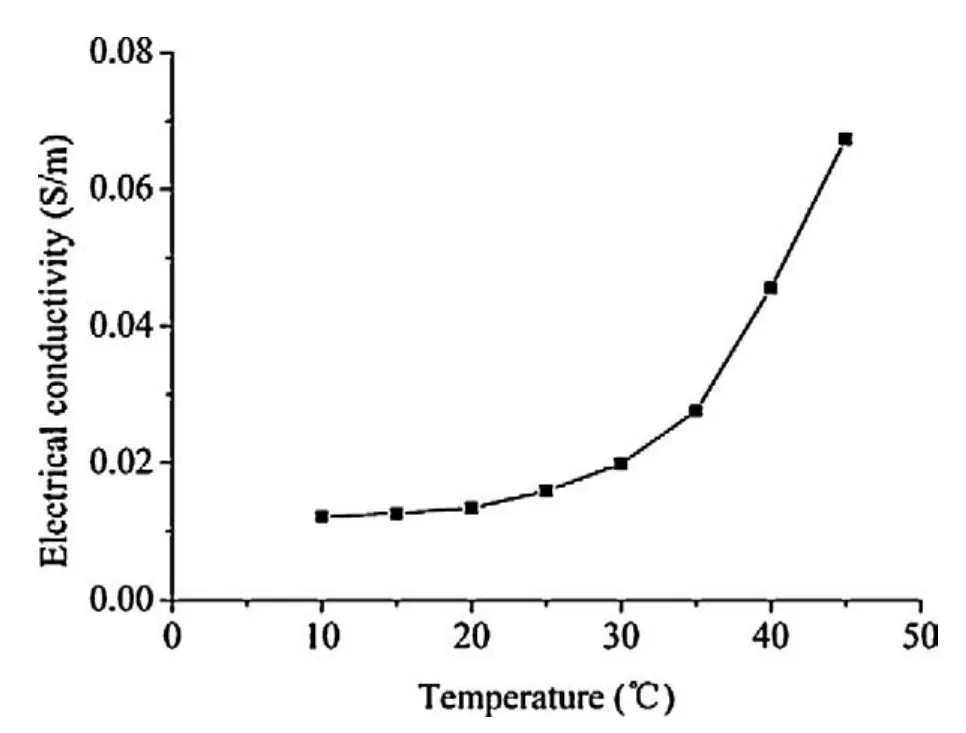
Fig. 5. Relationship between electrical conductivity and temperature.
Room temperature is kept at 20 ± 1°C by air-conditioner, thus 20°C is regarded as the standard temperature. In Fig. 5, the relationship between the conductivity σT(Tis the tested temperature) and σ20can be described by

Electrical resistivity is the reciprocal of the conductivity, thus the relationship between the resistivity ρTand ρ20can be described by
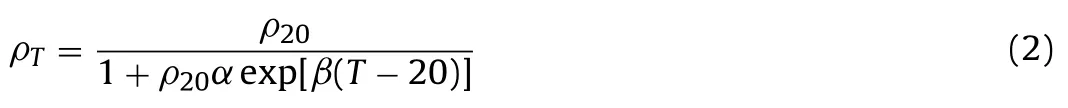
where σTand ρTare the conductivity and resistivity respectively at testing temperatureT; σ20and ρ20are the conductivity and resistivity respectively at 20°C; α and β are the tested constants, and α = 0.0012, β = 0.1562. It should be noted that the range of test temperature in Eqs. (1) and (2) is 10–45°C. Thus all the conductivitiesand resistivities mentioned above should be revised to the standard room temperature (20°C).
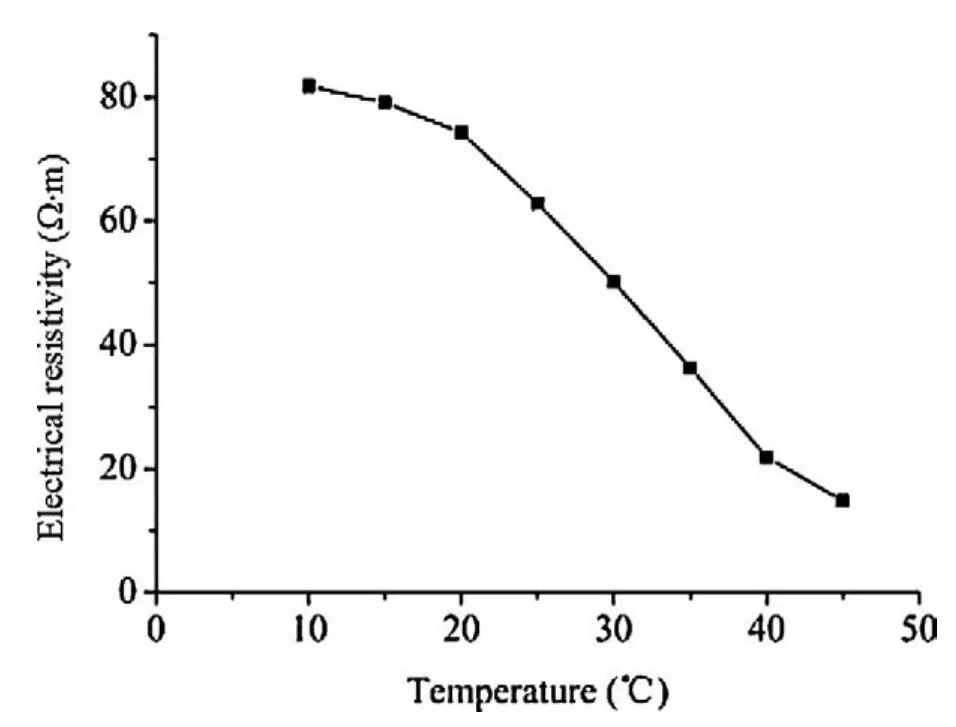
Fig. 6. Relationship between electrical resistivity and temperature.

Table 3 Preparation of specimens for different tests.

Fig. 7. Relationship between water content and electrical conductivity at different dry densities.
4.3.Effectofwatercontentonelectricalconductivity
Fig. 7 demonstrates that the electrical conductivity of lateritic soil increases when the water content increases. The results in Figs. 7 and 8 indicate that the electrical conductivity and resistivity are significantly influenced by water content, but minor influence is observed when the water content is above 23.4%. Taking the specimen with dry density 1.38 g/cm3as an example, the electrical conductivities of specimens with different water contents of 19.1%, 23.4%, and 30.8% increase by 63.9%, 143.9%, and 238.1%, respectively, compared with the specimen with water content of 14.7%. The gradient of electrical resistivity decreases to 40.5% when the water content increases from 23.4% to 30.8% (see Fig. 8).
Fig. 8. Relationship between water content and electrical resistivity at different dry densities.
Degree of saturation, a physical index, can be obtained by
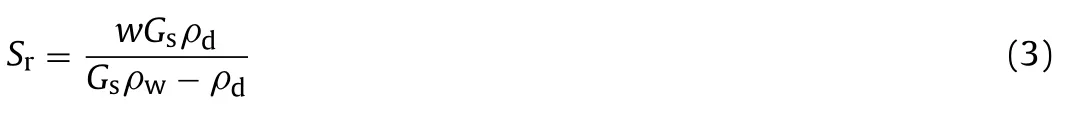
whereSris the degree of saturation, ρdis the dry density, and ρwis the density of water.
Fig. 9 demonstrates that the electrical conductivity of lateritic soil increases when the degree of saturation increases. Fig. 10 indicates that the electrical resistivity decreases when the degree of saturation increases and the electrical resistivity decreases evidently after the water content is above 23.4%.
Three pathways of current flow contribute to the electrical conductivity (Rhoades et al., 1989, 1999). As shown in Fig. 11, the path 2 is the primarily contribution (Rhoades et al., 1999). When the water occupies the larger pores and are connected, the electrical conductivity will increase dramatically, suggesting that the electrical conductivity of lateritic soil increases when the water content and degree of saturation increase. When the water content is above 23.4%, the increment rate of electrical conductivity slows down due to that the water content is close to saturation.
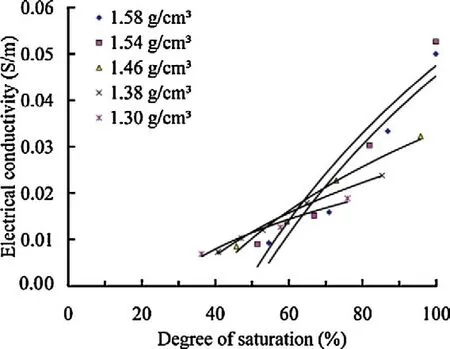
Fig. 9. Relationship between degree of saturation and electrical conductivity.
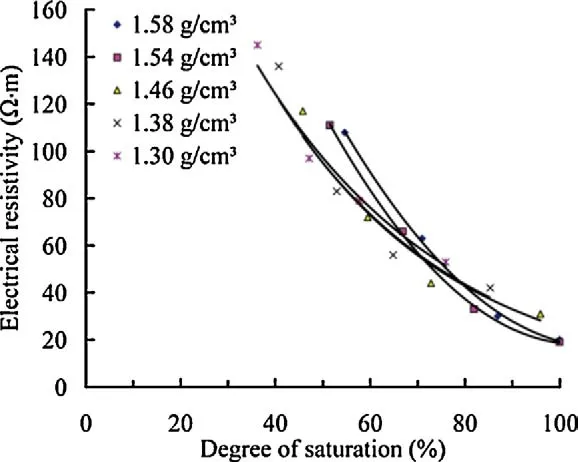
Fig. 10. Relationship between degree of saturation and electrical resistivity at different dry densities.
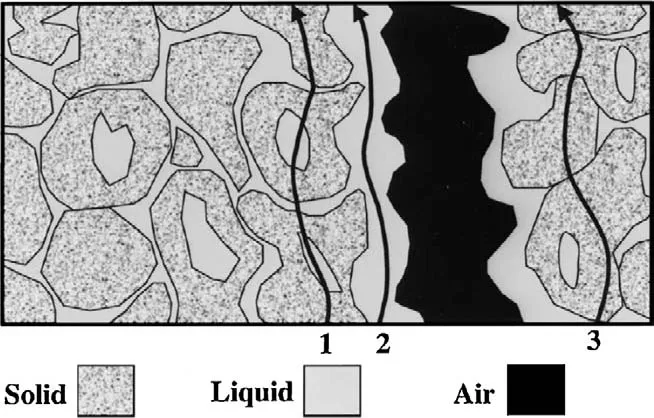
Fig. 11. Soil electrical conductance pathways (modified after Rhoades et al., 1989).
4.4.Effectofdrydensityonelectricalresistivity
The relationship between electrical resistivity and density is shown in Fig. 12, which demonstrates that the electrical resistivity of lateritic soil decreases when the dry density increases.
Taking the specimens with water content of 23.4% as an example, the electrical resistivity of specimens with increasing dry densities (1.38 g/cm3, 1.46 g/cm3, 1.54 g/cm3, and 1.58 g/cm3) is decreased by 29.1%, 44.3%, 58.2%, and 62.0%, respectively, compared to the electrical resistivity of specimen with the dry density of 1.30 g/cm3. The increment rate of the electrical resistivity slows down and tends to be constant. It can be described by the contact conditions of the soil particles: the more densely the lateritic soil is compacted, the better the conductive performance is. When the density of soil approaches the maximum dry density, soil particles are packed to the closest state, therefore, the electrical resistivity changes indistinctively approaching the maximum dry density.
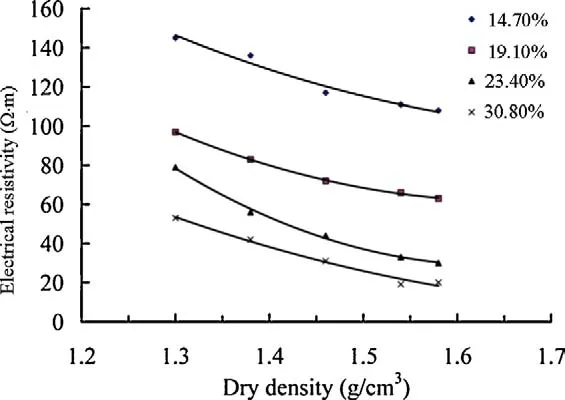
Fig. 12. Relationship between dry density and electrical resistivity at different water contents.

Fig. 13. Relationship between wetting–drying cycle and electrical conductivity.
4.5.Effectofinnerstructureonelectricalconductivity
Previous studies indicate that cracking occurs when the tensile stress induced by the developed suction exceeds the tensile strength of the specimen (Morris et al., 1992; Miller et al., 1998; Pèron et al., 2009). During wetting–drying cycles, volume shrinkage and cracking evolution would change soil fabric and destroy the integrity of lateritic soil. Thus, the tensile strength of specimen is further reduced, and more cracks are generated. The changes of soil inner structure will affect the electrical conductivity of the specimens. Fig. 13 shows the changes of electrical conductivity during wetting–drying cycles. It indicates that the electrical conductivity decreases rapidly during the first three wetting–drying cycles, and no major change is observed in the fourth wetting–drying cycle. Fig. 14 shows the changes of electrical resistivity during wetting–drying cycles, and a similar trend is observed. For instance, in the first three cycles the electrical resistivity is increased by 199.3% compared to the specimen without wetting–drying cycle, whereas it only accounts for 4.9% (in the fourth wetting–drying cycle) higher than that in the third wetting–drying cycle.
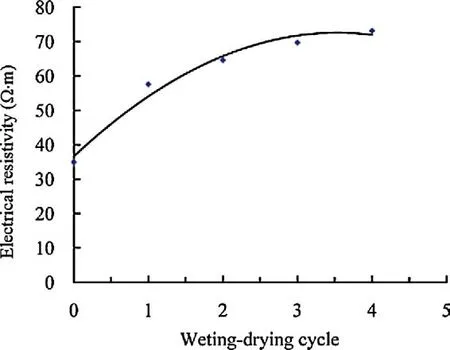
Fig. 14. Relationship between wetting–drying cycle and electrical resistivity.
In fact, wetting–drying cyclic process caused by alternating climates is far more than four cycles. It can be consider as repeated unloading and reloading cycles of matric suction. Previous studies (Lu et al., 2009; Fang et al., 2011; Tang and Shi, 2011) show that the strength parameters and deformation of expansive soil tend to be smooth after 3–5 wetting–drying cycles. The test results in present work indicate that the electrical conductivity of lateritic soil presents a similar tendency during wetting–drying cyclic process. However, the variation of inner structure is influenced by many factors, such as initial water content, the rate and amplitude of suction, and stress state. Therefore, the effect of inner structure on electrical conductivity may be much more complex, and further study is needed.
5. Conclusions
Summarizing the effects of physical properties on electrical conductivity of compacted lateritic soil is the first step to use the electrical conductivity to describe the state of density, the generation and developmental degrees of cracks. In this paper, the contact resistance is first obtained, and then standard temperature revised equation is estimated. Moreover, the relationship between physical properties of lateritic soil (water content, saturation, dry density, and soil structure) and the electrical conductivity is analyzed. The following conclusions can be drawn:
(1) The electrical conductivity of lateritic soil increases nonlinearly with increases of temperature, which is different from the results of saline and alkaline soils. The electrical conductivity and resistivity are signi ficantly in fluenced by water content, but it decreases after the water content is above 23.4%, which is close to the optimum water content. The phenomenon can be explained by the theory of the soil electrical conductance pathways.
(2) The dry density re flects the soil particle compactness to some degree: the bigger the dry density is, the better the connectivity of Rhoades’ solid pathway is (Rhoades et al., 1989), which is the reason that the electrical resistivity decreases with increasing dry density. However, once the dry density approaches the maximum one, the decrement rate of the resistivity slows down and tends to be stable.
(3) The change of electrical conductivity of soils during wetting–drying cycles indicates that electrical conductivity decreases rapidly during the first three wetting–drying cycles, and no signi ficant change is observed during the fourth wetting–drying cycle. It is because that, in the first three wetting–drying cycles, the volume shrinkage and cracking evolution are developed rapidly, which results in the change of soil fabric and the destruction of the soil integrity.
(4) In this paper, all the results are obtained by single factor analysis method. However, effects of physical properties on electrical conductivity are actually working in a combined pattern. How to describe the soil structure quanti ficationally and to describe the relationship between shear strength, deformation and electrical conductivity is still a challenging issue, which needs further study.
Acknowledgements
The financial supports from the National Natural Science Foundation of China (Grant No. 51209196) and the Science and Technology Project of Ministry of Transport of China (Grant No. 20113184931700) are gratefully acknowledged.
Archie GE. The electrical resistivity log as an aid in determining some reservoir characteristics. Transactions of the American Institute of Mining and Metallurgical Engineers 1942;146(1):54–62.
Campbell RB, Bower CA, Richards LA. Change of electrical conductivity with temperature and the relation of osmotic pressure to electrical conductivity and ion concentration for soil extracts. Soil Science Society of America Journal 1949;13:66–9.
Fang QJ, Hong BN, Lin LX, Liu SQ. Study on the different compression characteristic of high liquid limit clay and high liquid limit silt on wetting–drying cycles. Journal of Sichuan University (Engineering Science) 2011(Suppl. 1):73–7 [in Chinese].
Fukue M, Minatoa T, Horibe H, Taya N. The micro-structure of clay given by resistivity measurements. Engineering Geology 1999;54(1–2):43–53.
Lu HB, Zeng ZT, Zhao YL, Lu H. Experimental studies of strength of expansive soil in drying and wetting cycle. Rock and Soil Mechanics 2009;30(12):3797–802 [in Chinese].
McCarter WJ. The electrical resistivity characteristics of compacted clays. Geotechnique 1984;34(2):263–7.
Miller CJ, Mi H, Yesiller N. Experimental analysis of desiccation crack propagation in clay liners. Journal of the American Water Resources Association 1998;34(3):677–86.
Morris PH, Graham J, Williams DJ. Cracking in drying soils. Canadian Geotechnical Journal 1992;29(2):263–77.
Pèron H, Hueckel T, Laloui L, Hu LB. Fundamentals of desiccation cracking of finegrained soils: experimental characterizations and mechanisms identification. Canadian Geotechnical Journal 2009;46(10):1177–201.
Rhoades JD, Manteghi NA, Shouse PJ, Alves WJ. Soil electrical conductivity and soil salinity: new formulations and calibrations. Soil Science Society of America Journal 1989;53(2):433–9.
Rhoades JD, Corwin DL, Lesch SM. Geospatial measurements of soil electrical conductivity to assess soil salinity and diffuse salt loading from irrigation. In: Corwin DL, Loague K, Ellsworth TR, editors. Assessment of non-point source pollution in the Vadose zone. Geophysical Monograph, vol. 108. Washington, DC: AGU; 1999. p. 197–215.
Robain H, Descloitres M, Ritz M, Atangana QY. A multiscale electrical survey of a lateritic soil system in the rain forest of Cameroon. Journal of Applied Geophysics 1996;34(4):237–53.
Tang CS, Shi B. Swelling and shrinkage behaviour of expansive soil during wetting–drying cycles. Chinese Journal of Geotechnical Engineering 2011;33(9):1376–84 [in Chinese].
Bai Weiwas born and grew up in Tianmen, Hubei Province in China. He got Bachelor and Master degrees in civil engineering and geotechnical engineering from Three Gorges University in 2005 and 2008, respectively. In 2011, he obtained Ph.D. in engineering mechanics from Institute of Rock and Soil Mechanics (IRSM), Chinese Academy of Sciences (CAS), under the supervision of Prof. Lingwei Kong. Now he is working at IRSM as an Assistant Professor. His research interests include engineering and mechanical characteristics of problematic soil and disaster prevention. Until now he has taken part in various research programs, including “Effect of moisture migration rate on engineering characteristics of expansive soil and instability mechanics of cut slope” (National Natural Science Foundation of China, No. 10872210); “Mechanical response and subgrade stability of lime-treated expansive soil under traffic loading” (National Natural Science Foundation of China, No. 40772185); “Mechanical response and disaster mechanism of fissured subgrade under high-speed traffic loading” (Knowledge Innovation Program of CAS, No. kzcx2-yw-150) and “Macro-mechanical and mesomechanical characters of fissured laterite under the dry–wet cycles” (National Natural Science Foundation of China, No. 51209196).
∗Corresponding author. Tel.: +86 15171456249.
E-mail address: wbai@whrsm.ac.cn (W. Bai).
Peer review under responsibility of Institute of Rock and Soil Mechanics, Chinese Academy of Sciences.
1674-7755 © 2013 Institute of Rock and Soil Mechanics, Chinese Academy of Sciences. Production and hosting by Elsevier B.V. All rights reserved.
http://dx.doi.org/10.1016/j.jrmge.2013.07.003
 Journal of Rock Mechanics and Geotechnical Engineering2013年5期
- Journal of Rock Mechanics and Geotechnical Engineering的其它文章
- Easy profit maximization method for open-pit mining
- A discontinuum-based model to simulate compressive and tensile failure in sedimentary rock
- Landslide disaster prevention and mitigation through works in Hong Kong
- Easy profit maximization method for open-pit mining
- Reply to Discussion on “A generalized three-dimensional failure criterion for rock masses”
- Discussion on “A generalized three-dimensional failure criterion for rock masses”