
Behaviour of layered sandstone under Brazilian test conditions: Layer orientation and shape effects
2013-07-10 12:23:42AbbassTavallaliAndrVervoort
Abbass Tavallali, André Vervoort
DepartmentofCivilEngineering,UniversityofLeuven,KasteelparkArenberg40,3001Leuven,Belgium
Behaviour of layered sandstone under Brazilian test conditions: Layer orientation and shape effects
Abbass Tavallali∗, André Vervoort
DepartmentofCivilEngineering,UniversityofLeuven,KasteelparkArenberg40,3001Leuven,Belgium
A R T I C L E I N F O
Articlehistory:
Received 3 July 2012
Received in revised form 6 November 2012
Accepted 2 January 2013
Layered sandstone
Brazilian test
Fracture pattern
Layer activation
Shape effect
The experimental study in this paper focuses on the effects of the layer orientation and sample shape on failure strength and fracture pattern of samples tested under Brazilian test conditions (i.e. diametrical loading of cylindrical discs) for one particular layered sandstone which is from Modave in the south of Belgium. The variations of the strength in combination with the failure patterns are examined as a function of the inclination angle between the layer plane and the loading direction. The experimental, results clearly show that the induced fracture patterns are a combination of tensile and/or shear fractures. In shape effect experiments the layer thickness and the number of layer boundaries are investigated. Different blocks of Modave sandstone are used to prepare samples. The layer thickness is different among the various blocks, but the layer thickness in each studied rock block can be considered to be constant; hence, the number of layer boundaries changes according to the sample diameter for samples of the same block. The experimental study shows that the layer thickness plays a more important role than the number of layer boundaries per sample.
© 2013 Institute of Rock and Soil Mechanics, Chinese Academy of Sciences. Production and hosting by Elsevier B.V. All rights reserved.
1. Introduction
The knowledge of the anisotropic properties of rock material is required in the fields of civil, mining, geoenvironmental and petroleum engineering, as in general, rock material near the earth’s surface is anisotropic. Material properties of anisotropic rock are directionally dependent, as opposed to isotropic rock that implies identical properties in all directions. An additional characteristic of rock material is the large spatial variation of its properties, even at small distance, which makes a rock mechanical study even more difficult. More and more this anisotropy is taken into account when testing the rock material, as input for design and for numerical modelling. The engineering applications without considering the rock anisotropic behaviour produce errors of different magnitudes, depending on the extent of rock anisotropy (Amadei, 1996; Cho et al., 2012).
Experimental methods are the most important and reliable way to study rock properties and rock failure mechanisms. The failure mechanism of rock materials due to their mineralogical texture is complex and it is more problematic for anisotropic rock.
In rock mechanics, the uniaxial (unconfined) compressive strength (UCS) test and Brazilian tensile strength (BTS) test are the most widely used methods to obtain rock strength properties. Change in rock strength properties (e.g. UCS and BTS) with sample size is referred to as scale effect. In this context, the so-called scale effect is divided into two categories: size effect and shape effect (Thuro et al., 2001; Pan et al., 2009). The size effect can be studied by comparing the rock strength values from specimens with the same shape but different sizes (the same length/diameter ratio but with different diameters). The shape effect can be studied by comparing the rock strength values from specimens with the same diameter (or length) but a variation in length/diameter ratio (see further, Thuro et al., 2001; Pan et al., 2009).
In this study, the focus is on stratified rock material as one specific form of anisotropy that is often present in geological material. Transverse isotropy (as a form of anisotropy) is a characteristic of intact foliated metamorphic rocks (slates, gneisses, phyllites, schists) and intact laminated, stratified or bedded sedimentary rocks (shales, sandstones, siltstones, limestones, coal, etc.) (Chen et al., 1998).
The tests are conducted on hard and brittle stratified sandstone (psammite) and the Brazilian method (diametrical loading of cylindrical discs) is applied. The stratified (layered or banded) rock material is sometimes called transversely isotropic rock material (Ye et al., 2009), i.e. rocks with one dominant direction of planaranisotropy. The effects of the layer orientation and sample shape are investigated in detail for 123 samples from three blocks taken from the same quarry.
The experimental research in this paper focuses on the effect of the layer orientation on both the failure strength and the failure pattern of this layered sandstone under Brazilian test conditions. The research shows clearly that the induced fracture patterns are a combination of tensile and/or shear fractures. Or in other words, the failure in transversally isotropic rock material is not necessarily a pure tensile failure; even in some cases it can be pure shear failure, but often it is a combination of tensile and shear failure (Debecker and Vervoort, 2009; Cho et al., 2012; Vervoort et al., 2012). Hence, one should rather talk about failure strength or peak load than about tensile strength. The effect of the layer orientation is investigated in detail for 89 samples from three blocks taken from the same quarry. This investigation concentrates on the strength and fracture pattern of the tested samples.
In Section 4, the effect of sample shape on the failure behaviour of (disc-shaped) samples after conducting a Brazilian test is investigated for the same material. In shape effect experiments, the layer thickness (the distance between the layer boundaries) and the number of layer boundaries are taken into account. Similar to Section 3, shape effect on the strength and fracture pattern of the tested samples is investigated. It should be noted that in the literature one mostly focuses on the sample strength (Rocco et al., 1999; Thuro et al., 2001; Yoshinaka et al., 2008; Pan et al., 2009). Recently, effort has been made to shed light on correlation of strength and fracture pattern (Debecker and Vervoort, 2009; Tavallali and Vervoort, 2010a,b).
Three blocks of layered sandstone are taken from a quarry in Modave in the south of Belgium. These blocks are taken at very short distance (from 1 m to 10 m) from each other. Visual inspection (hand samples) would normally lead to the conclusion that they are all similar material. This sandstone is also known as “Psammite of Condroz” (Poty and Chevalier, 2004). This sandstone is characterised by numerous thin and parallel layers. The plane of anisotropy (transverse isotropy) is assumed to be parallel to the apparent direction of rock layer.
The sandstone studied is stratified and massive, and belongs to the Famennian stage. The Famennian stage is one of the two stages in the Late Devonian epoch. It lasted from 374.5 ± 2.6 million years to 359.2 ± 2.5 million years ago (Gradstein et al., 2004). The name of Famennian stage originated in the 19th century from the Famenne region in the southern part of Belgium.
The number of layer boundaries on hand samples from each block is counted. The number of layer boundaries over 1 cm of three blocks is not the same; therefore, the three blocks are further called the three sandstone sub-types a, b and c. The number of layer boundaries over 1 cm is 5.4, 2.6 and 1.4 for the three subtypes. Graded bedding of shallow-water environments is generally composed of thin layers from a few millimetres to 1 cm or 2 cm, and seldom makes sequences more than 10 cm or 20 cm thick (Reineck and Singh, 1986). It can be concluded that all the blocks are from shallow-water environments as their layer thicknesses are 1.8 mm, 3.5 mm and 6.4 mm for sandstone sub-types a, b and c, respectively.
In sub-type c, ripples are observed (Tavallali and Vervoort, 2008). It should be noted that ripples are not considered as the layer boundary. The reason is that ripples are not in the main direction of sedimentation and that they are dispersed between layer boundaries.
The rock is cored in the laboratory by using a 50 mm diameter drill bit for layer orientation effect. For shape effect investigation, drill bits with different diameters from 30 mm to 115 mm are used. The direction of coring is parallel to the layers. For all samples a constant thickness of 25 mm is taken. All tests are carried out by using a loading machine with a loading capacity of 100 kN, at a constant displacement rate of 1 mm/min. The disc-shaped samples are positioned as in Fig. 1 and compressed vertically till failure.
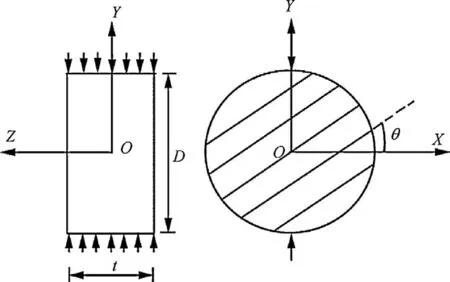
Fig. 1. Disc-shaped sample and configuration of layers in Brazilian tests. θ varies between 0°and 90°. Set of inclined parallel lines symbolises average layer direction (bedding).
The indirect tensile strength, σt, perpendicular to the loaded diameter, based on linear elastic calculations for homogeneous and isotropic rock can be written as

whereFis the applied load when the sample fails; andDandtare the diameter and thickness of the disc-shaped sample. Of course this formula is considered for the loaded diameter in the condition of a typical vertical splitting or extension type of fracture occurring, which is often not the case for transversally isotropic rock material (see further, Figs. 4 and 7). However, it is even not straightforward to judge that the failure through an inclined fracture or through a layer boundary is in tension or shear (Vervoort et al., 2012). Therefore, this formula is used just for comparison purposes and the results from Eq. (1) do not necessarily present the tensile strength of the samples (further explanations are presented in Section 3).
2. Material properties
2.1.Physicalproperties
The dry density and effective porosity of the Modave sandstone blocks are determined by saturation and buoyancy techniques. For each block (sub-type) of sandstone, five samples are prepared (see Table 1). The variation in dry density is relatively small, i.e. from 2.57 g/cm3for sub-type b to 2.63 g/cm3for sub-type a. The variation in the effective porosity is from 2.0% for sub-type a to 3.2% for subtype b.
Also two disc-shaped samples from each sub-type are prepared for P-wave velocity measurements. P-wave velocity is measured parallel to layer direction and in the direction perpendicular to the layers. In different con figurations, slight differences of wave velocity are recorded. However, the minimum and the maximumwave velocities are always measured perpendicular and parallel to the layers, respectively (see Table 1). The minimum difference of wave velocities is measured in samples of sub-type b. In this subtype, wave velocity perpendicular to the layers is from 4.3 km/s to 4.4 km/s while in direction parallel to the layers it is from 4.5 km/s to 4.6 km/s.

Table 1 Physical properties of the three sub-types of layered Modave sandstone.
2.2.Petrographicalstudyofuntestedsamples
For petrographical purpose, thin sections with a thickness of 30 μm from an untested sandstone sample from each sub-type are prepared and analysed. Thin section observation is done by petrographical microscope with transmitted polarised light. In all samples, quartz, carbonate and mica are observed. Pores, organic material, clay minerals and feldspar are also observed, although in very small quantities. Clays are found usually mixed with microscopic crystals of carbonates, feldspars, micas and quartz. These minerals are very common in fine grain sedimentary rocks such as the studied sandstone. Determining precisely the clay mineral by means of X-ray analysis and some spectroscopic methods is possible. By referring to some studies, it is understood that the clay minerals in the studied sandstone are dominated by illite (Thorez et al., 1988; Han et al., 2000).
To quantify the relative amount of minerals, the point-counting method is applied (Chayes, 1956; Prˇikryl, 2001). The thin section is put in the point-counting apparatus which is attached to the petrographical microscope. Above-mentioned apparatus moves the thin section with a given interval. After each movement, the mineral in the centre of the microscopic view is observed. For example, if in 100 steps of movement 75 times a quartz grain is observed in the centre of microscopic view, it is concluded that quartz content in that rock material is 75%.
In this study, 500 points in each thin section are counted in a regular pattern with a fixed interval of 400 μm between the points. Direction of counting is perpendicular to the layers. The distance of 800 μm is taken between the lines of point-counting. Fig. 2 presents the percentage of different minerals in each sub-type.
In the three Modave sandstone sub-types, the main constitutive mineral is quartz (from 72% to 88%). The shape and roundness of the quartz grains are the same in all the sub-types. For roundness of sand grains, Powers (1953) and Shepard (1963) distinguished six groups (Reineck and Singh, 1986). The grains of the three sub-types are in the class of subangular.

Fig. 2. Observed mineral percentage in different sandstone sub-types by 500 counted points. Category ‘Others’ corresponds to pores, organic material and clay minerals.
For quartz grain size measurements, the point-counting method is applied too. Three hundred points in each thin section are counted in a similar pattern to the composition quantification. Similar to sieving analysis the smallest dimension of the grain is considered as the grain size. The average (and minimum, maximum) values (in μm) of the quartz grains size in sub-types a, b and c are 69 (22, 141), 107 (42, 218), and 82 (29, 146), respectively. The grain size calculation is done by arithmetic method. By considering the British Standards (Craig, 1990), the grains of studied sub-types are in the size range of fine sand. The measurements are in agreement with the study of Thorez et al. (2006) of the sandstone in the same area. They have mentioned that the sandstone of Famennian stage in the south of Belgium is fine grained with the average grain size of 45–120 μm.
The nature of minerals suggests that the presence of strong elements such as quartz increases the rock strength and, on the other hand, the abundance of weak minerals such as mica and carbonate decreases the rock strength. It is widely accepted that for higher quartz content, rock strength increases. Contrary to quartz, the abundance of easily cleavable minerals would result in lowering the strength values (Tavallali, 2010). It should be noted that sub-type a has the highest weak minerals percentage (23.5%) and sub-type b has the lowest weak minerals percentage (7.9%).
3. Brazilian test results
The rock layers are inclined at different angles (see Fig. 1) ranging between 0°(perpendicular to the loading direction) and 90°(parallel to the loading direction). It should be highlighted that the orientation of the layers with respect to loading direction is evaluated. As the loading direction in this study is always vertical, changing the layer orientation implies that the angle between the layer direction and the loading direction changes. Seven different values are considered: 0°, 20°, 45°, 60°, 70°, 80°and 90°. Since one sample is not necessarily representative for the failure behaviour corresponding to a specific inclination angle, four to six samples are tested per inclination angle value per sub-type. The number of tested samples for the sub-types a, b and c is 29, 30 and 30, respectively (89 samples in total).

Fig. 3. Variation in average failure strength as a function of the inclination angle θ for sandstone sub-types a, b and c.
The variation in the average failure strength with the inclination angle θ for the sub-types is presented in Fig. 3. All the curves show asmall downwards trend. The largest average failure strength corresponds mostly to the samples of sub-type b which varies between 15.1 MPa and 11.3 MPa, while the lowest corresponds mostly to the samples of sub-type a which varies between 14.2 MPa and 5.3 MPa.
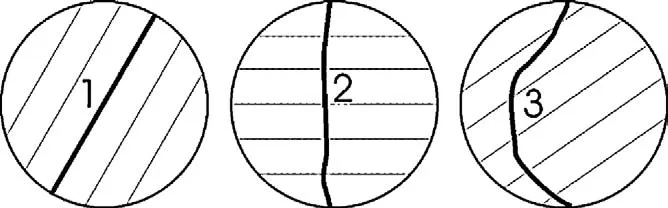
Fig. 4. Schematic representation of different fracture types in Brazilian test. (1) Layer activation, (2) central fracture, and (3) non-central fracture.
However, it is important to note that when θ = 0°the average failure strength corresponds to the tensile strength of the “intact”material. For θ = 90°, the average failure strength should rather correspond to the tensile strength of the “layers”. For other angles, one can probably not talk about a pure tensile or extension type of failure, and hence about a tensile strength. One should rather consider it as failure strength.
Similar to the idea introduced by Szwedzicki (2007) for UCS tests, different failure modes are suggested. By considering the samples after failure, different types of fractures are observed (see Fig. 4):
(1) Some fractures are parallel to the isotropic layers which are further called “layer activation”.
(2) Some fractures are roughly parallel to the loading direction and they are located in the central part of the sample between the two loading lines. The central part is arbitrarily de fined as 10% of the diameter on both sides of the central line. These fractures are further called “central fractures”.
(3) Fractures outside the central part are also observed. If they do not correspond to layer activation, they are further called “noncentral fractures”. The latter are often curved lines, starting at or around the loading platens.
In most cases, two or three different fracture types occur in the same experiment (Tavallali et al., 2007; Vervoort et al., 2012). It is good to note that in case of θ = 90°and when a straight fracture parallel to the layers between both loading platens is induced, this is classi fied as layer activation and not as central fracture. However, if in that case (θ = 90°) a fracture is situated in the central part but does not follow the layer direction, it is classi fied as central fracture.
The fracture length within the various rock samples is estimated and used as a tool to distinguish between the different failure modes. First, the lengths of all fractures in the sample are measured. Second, the length corresponding to the various fracture types is considered. When a fracture is classi fied as layer activation, the entire length including the part within the central zone is put into the total sum of layer activation. In a similar way, if the major part of a curved shape fracture (e.g. the non-central fracture in Fig. 4) is outside the central zone, the entire length including the small portion in the central zone is put into the total sum of non-central fractures.
The fracture pattern in most of the samples is similar on both sides (i.e. front and back; however they are not exactly the same). It means that the fracture pattern can mostly be considered as twodimensional. Therefore, all the fracture lengths in these cases are measured on one side. The fracture pattern in a few samples is truely three-dimensional and on both sides of the sample, the fracture pattern is signi ficantly different. In such cases, averages of the fracture lengths on both sides are considered.
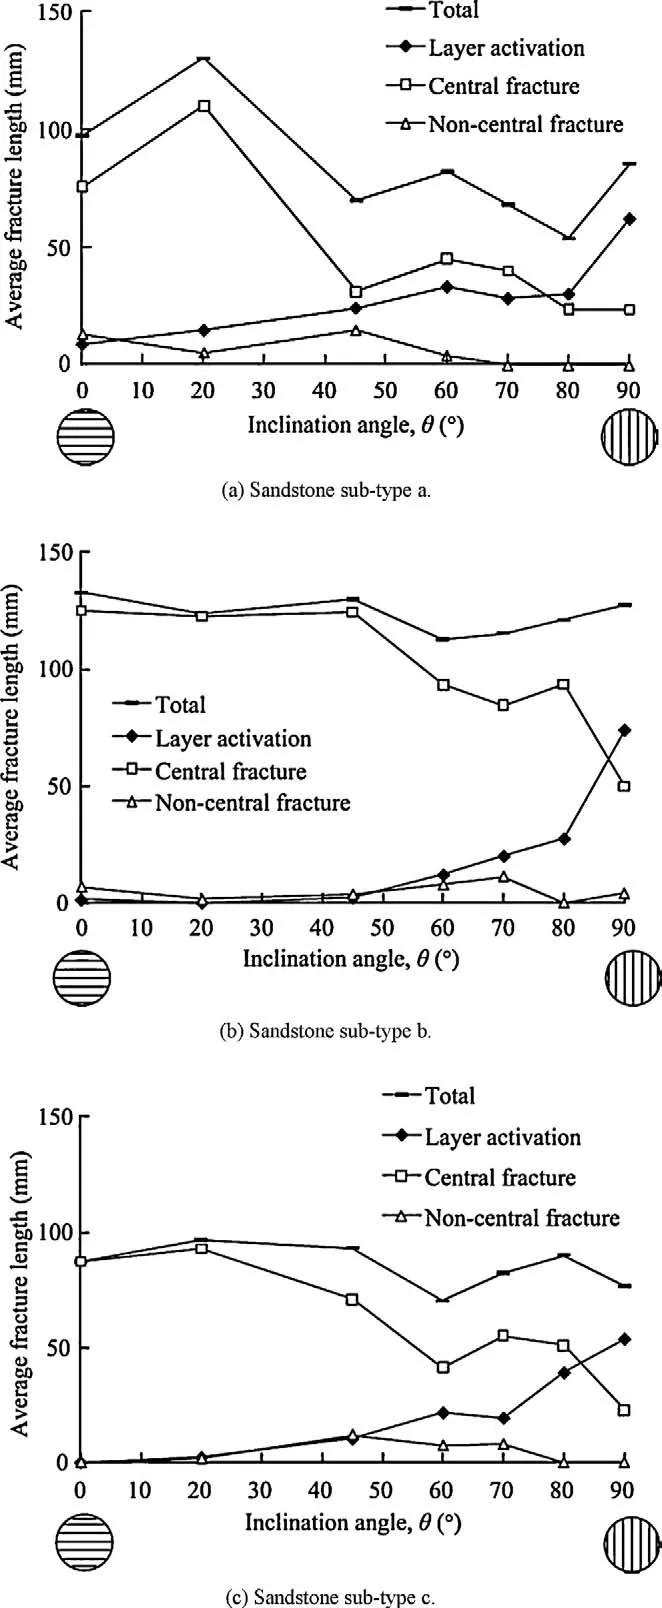
Fig. 5. Variation in average fracture length as a function of the inclination angle θ, for Modave sandstone sub-types a, b and c.
For all samples corresponding to a single angle value, the average fracture length is calculated. For the samples of the three sub-types, variation of the three types of fractures, as well as the total fracture length is plotted as a function of the inclination angle θ in Fig. 5.
The graph corresponding to sub-type a (Fig. 5a) shows that, for an inclination angle less than 45°, most of the fractures are central fractures, however, for an inclination angle of 0–70°, central fracture(s) is the main failure mode. Although, for an inclination angle of 0–90°, there is an increasing trend for layer activation, only predominant for 80°and 90°.
The graph corresponding to sub-type b (Fig. 5b) shows that, for inclination angles smaller than 50°, the fracture length corresponding to layer activation is negligible. When the inclination angle exceeds 50°, fracture length corresponding to layer activation increases and only for 90°becomes predominant. Layer activation for the inclination angle of 0°and 20°for sub-type c is negligible. For larger inclination angles, layer activation increases, but only for 90°it becomes the main failure mode in sub-type c.
Fig. 5 also illustrates that the non-central fracture length for the three sub-types is small and independent of θ.
Recently, detailed investigation on fracture-strength correlation for layered sandstone has been done (Tavallali and Vervoort, 2010a). They concluded that larger fracture length correlates with higher strength. They also concluded that strength is smaller for larger inclination angles and for smaller total fracture lengths. Therefore, it is interesting to correlate Fig. 3 with Fig. 5. The variation on failure strength values as a function of total fracture length for all the samples of the three Modave sandstone sub-types is plotted in Fig. 6. Fig. 6 indicates that the samples showing higher strength are more fractured (especially for sub-type a).
It can be concluded that, for all sandstone sub-types, as inclination angle increases from 0°to 90°, the fracture length corresponding to central fracture(s) decreases while layer activation increases. However, the decreasing and the increasing rates of fractures length for the three sandstone sub-types are different. Consequently, the transition angle, which indicates the change of failure mode from central fracture to layer activation, is not the same for all sub-types of studied layered sandstone. It is important to note that the number of layer boundaries over one centimetre of the three sub-types is not the same. Up to now, it is understood that the failure strength and fracture pattern are considerably affected by the layer orientation. Therefore, by focusing on one inclination angle (i.e. 70°) for the three sub-types, their failure behaviour for the same layer orientation could be compared to each other in more detail. For the inclination angle of 70°, fracture length mainly corresponds to both central fracture and layer activation. It can be useful to consider also the percentage of central fracture(s) and layer activation compared to the total fracture length. The largest percentage of either fracture in the form of layer activation or as central fracture(s) indicates the predominant failure mode.
For the inclination angle of 70°, the average failure strength values of sandstone sub-types a, b and c are 7.9 MPa, 14.5 MPa and 12.8 MPa, respectively. At a macroscopic scale, the blocks look similar, but there is about 6.6 MPa difference between the smallest and largest average values of failure strength. In other words, it can be concluded that considerable difference exists among the failure strength values, as the average value of failure strength for sub-type b (14.5 MPa) is about two times that for sub-type a (7.9 MPa).
The failure pattern (one side) of all the samples (that are tested under an angle of 70°) is shown in Fig. 7 for the three sandstone sub-types. Layer activation in three of the four samples of sub-type a is observed (the third sample from left of Fig. 7a: minor layer activation in the central part). In two of them, layer activation is the predominant failure mode. On the other hand, central fracture is the predominant failure mode for all the sandstone samples of sub-type b and only in one sample layer activation is observed as the secondary failure mode. The samples from sub-type c show a failure by either central fracture(s) only or a combination of central fracture(s) and layer activation. By observing the fracture patterns in Fig. 7, it is understood that the fracture patterns of samples from the three sub-types of layered sandstone are different.

Fig. 6. Variation in failure strength as a function of total fracture length for all the samples of the three layered Modave sandstone sub-types.
In Fig. 8, the average percentage of layer activation, central fracture(s) and non-central fracture(s) compared to the total fracture length is given for the three sandstone sub-types. Central fracture(s) is predominant for all three sub-types of Modave sandstone. However, layer activation for sub-type a (41%) is more than two times that for sub-type b (19%). Minimum layer activation is observed in sub-type b. It should be noted that this sub-type shows the smallest difference in P-wave velocities measured between the direction perpendicular and parallel to the layers. In other words, sub-type b has the lowest degree of transverse isotropy.
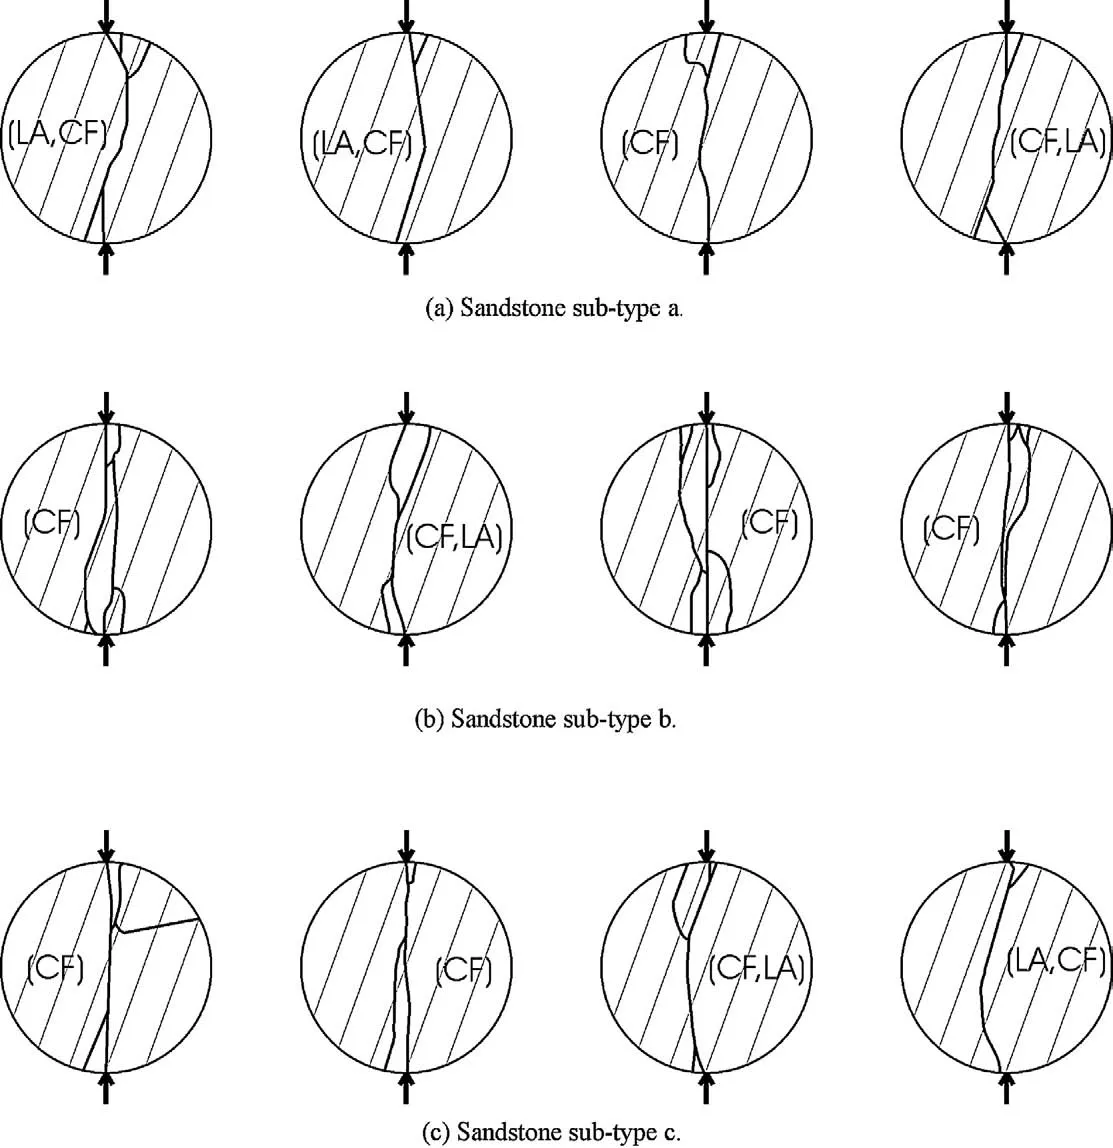
Fig. 7. Observed failure patterns of samples from different layered Modave sandstone sub-types in Brazilian tests. Inclination angle of 70°for all samples. Set of inclined parallel lines symbolises average layer direction (bedding). The predominant and secondary failure mode are given in parentheses, CF: central fracture, LA: layer activation.
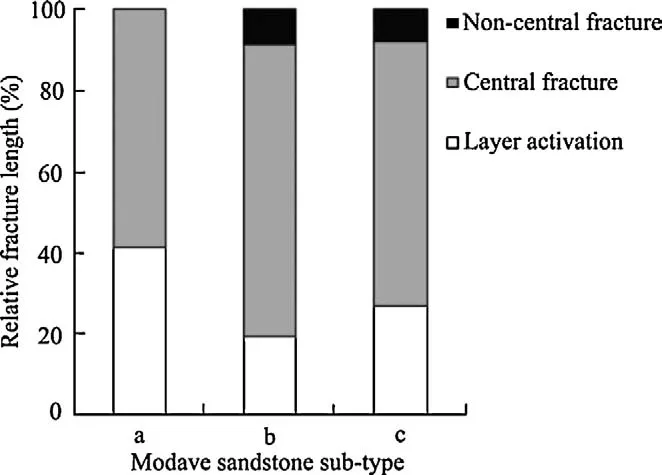
Fig. 8. Variation in fracture length percentage corresponding to layer activation, central fracture(s) and non-central fracture(s) for different sandstone sub-types.
The conducted Brazilian tests illustrate the effect of the layer orientation on the fracture patterns and failure strength on macroscale. However, from the above explanation, it can be concluded that samples from different blocks (which are relatively similar, but not completely similar) do not behave similarly on macro-scale.
4. Shape effect
In this part of the study, the effect of sample shape on the failure behaviour of disc-shaped samples after conducting Brazilian tests is investigated for Modave sandstone. To be sure that the same material is tested, the samples coming from each block are considered separately. So, in one way, with this condition, the amount of rock material is limited. Therefore, size effect experiments are not possible, as for the same length/diameter (or thickness/diameter) ratio a large amount of rock material is needed for large diameters. Therefore, only the shape effect is investigated.
It is observed that the number of layer boundaries (e.g. over 1 cm) of the three sandstone sub-types is not the same, and also their failure patterns are different. It is essential to know whether the number of layer boundaries per sample is important or thedistance between the layers plays the main role in failure behaviour. By preparing larger samples, the number of layer boundaries per samples increases; however, the distance between them does not change. For example, the number of layer boundaries over 1 cm for sub-type a (5.4) is about two times that for sandstone sub-type b (2.6). It means that a sample from sub-type a with “D” in diameter has the same number of layer boundaries as a sample from sub-type b with “2D” in diameter. However, the distance between the layer boundaries in the sample from sub-type b is two times larger than that for the sample from sub-type a.
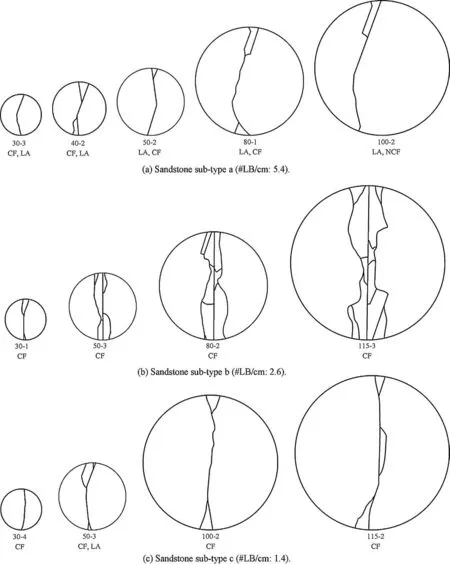
Fig. 9. Observed failure patterns (one side) in Brazilian test for samples in different diameters from Modave sandstone sub-types a, b and c (one typical sample for each diameter). Inclination angle for all samples is 70°. Sample number and the predominant failure mode(s) are put under the samples. The first part of the numbers is the sample diameter in mm. CF: central fracture, NCF: non-central fracture, LA: layer activation, #LB: number of layer boundaries.
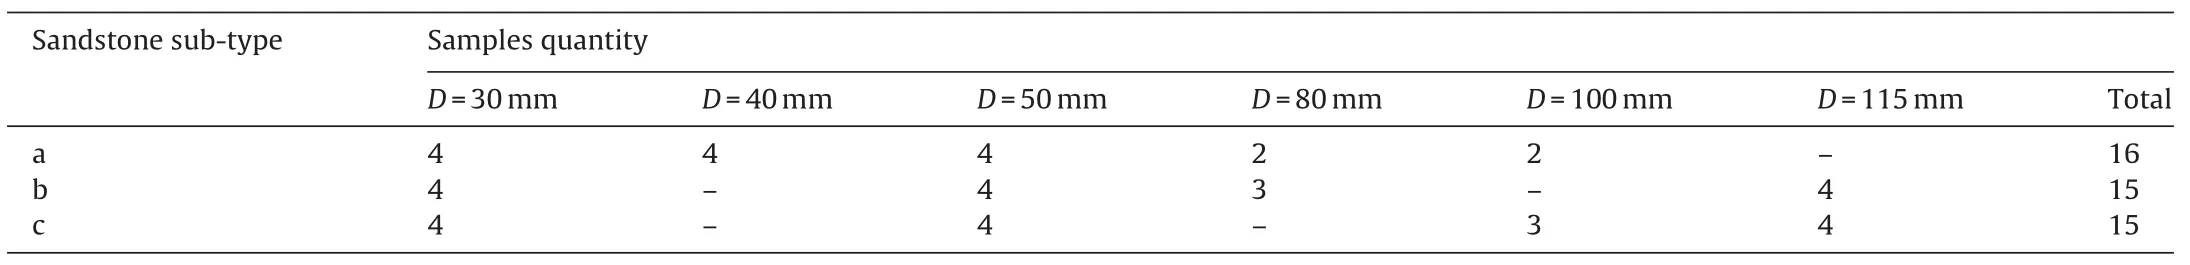
Table 2 Quantity of sandstone samples for shape effect analyses.
The aim of the following experiments can be summarised by the following two questions:
(1) What is the effect of sample diameter on failure behaviour of disc-shaped samples from a particular sandstone sub-type?
(2) Is there any similarity in failure pattern of samples from different sub-types which have (roughly) the same number of layer boundaries?
An effort has been made to answer these questions. For this purpose, several samples with different diameters from different sub-types of sandstone should be tested.
The blocks of sandstone sub-types a, b and c are cored in the laboratory by using drill bits with different diameters from 30 mm to 115 mm. The direction of coring is parallel to the layering. For all samples a constant thickness of 25 mm is taken. Therefore, the thickness/diameter ratio varies from 0.2 to 0.9. Variation in mentioned ratio in some studies is executed by changes in thethicknesses, while keeping the diameter as a constant value. However, for the purposes of this study, changes in diameter are needed (in order to have different numbers of layer boundaries per sample), while the samples thickness is kept constant.

Fig. 10. Shape effect on failure behaviour of disc-shaped samples after conducting Brazilian test. Samples with different diameters but constant thickness (25 mm) from sandstone sub-types a, b and c are tested. The inclination angle for all the samples is 70°.
Some important notes should be considered. In Brazilian tests, the minor and major principal stresses are tensile and compressive, respectively. The intermediate principal stress depends on length/diameter ratio. Lower length/diameter ratio makes the state of the rock sample (disc) closer to plane stress rather than plane strain (Lavrov et al., 2002). The intermediate principal stress for the low length/diameter ratio can be assumed zero; while, it is not the case when this ratio is larger.
From the three mentioned sandstone sub-types, 46 samples are prepared for conducting Brazilian tests in order to investigate the shape effect and also to find the answer to the two mentioned questions. All the samples are tested under an inclination angle of 70°. Sample quantities with different diameters from sandstone sub
types a, b and c are presented in Table 2. It should be noted that all samples with 50 mm are already tested, presented and described in Section 3. These samples are integrated in this part of the study.
The failure pattern (one side) of the samples after failure from the three sandstone sub-types is shown in Fig. 9 (one typical sample for each diameter). Apart from the predominant failure mode in some samples, such as in sandstone sub-type a, some secondary modes are also observed (see Fig. 9). Although in samples 80-2 and 115-3 of sandstone sub-types b some parts of layer activation are also observed, the predominant failure mode in these samples is central fracture. In these samples, layer activation is not considered as a secondary failure mode, because fracture length corresponding to layer activation is very small in comparison to fracture length corresponding to central fracture.
After conducting the tests the fracture analysis is done for all the samples. To observe the effect of sample diameter on failure behaviour of disc-shaped samples, relative layer activation fracture length and also the failure strength are considered.
Fig. 10 presents the variation in the mentioned two factors (relative layer activation fracture length and failure strength) as a function of sample diameter for sandstone sub-types a, b and c. For sandstone sub-types b and c, a clear difference in layer activation and also in failure strength of samples with different diameters is not distinguished (see Fig. 10).
Variation in failure strength values as a function of sample diameter for sandstone sub-type a is also not significant, especially when sample diameter varies between 50 mm and 100 mm. The condition for relative layer activation fracture length of samples from sandstone sub-type a is slightly different. The samples with diameter of 30 mm, 40 mm and 50 mm have similar layer activation; however, for larger diameter (80 mm and 100 mm), layer activation is slightly increased. For each of the diameters 80 mm and 100 mm from sandstone sub-type a, two samples are tested (see Table 2). Relative layer activation fracture length of one sample in each of these two diameters is in the range of layer activation of the other samples with diameters of 30 mm, 40 mm and 50 mm. In other words, only one sample with diameter of 80 mm and one sample with diameter of 100 mm show higher relative layer activation fracture length. Therefore, it is difficult to judge the layer activation trend in sandstone sub-type a as sample diameter is increased. From the above explanation it can be concluded that the shape effect is limited in the tested diameter range for the studied sandstone sub-types.
Mean values of relative layer activation fracture length and of failure strength are calculated from 2 to 4 samples for each diameter in sandstone sub-types a, b and c. Fig. 11 shows the variation in mean values of relative layer activation fracture length and also failure strength as a function of sample diameter for sandstone sub-types a, b and c. As stated earlier, Fig. 11 shows that the shape effect on failure behaviour of disc-shaped samples is limited, particularly on failure strength in the tested diameter range.
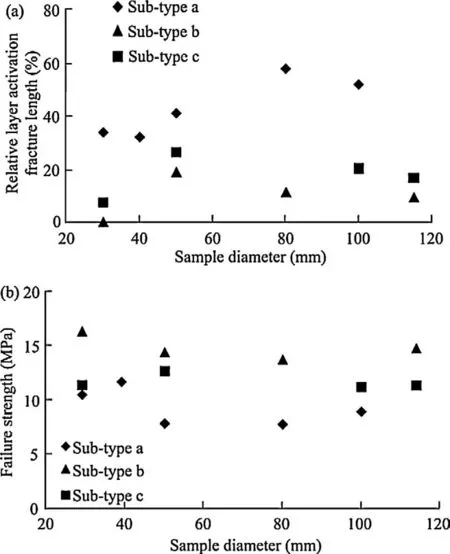
Fig. 11. Shape effect on failure behaviour of disc-shaped samples after conducting Brazilian test. Average values are calculated from 2 to 4 samples for each diameter. Samples with different diameters but constant thickness (25 mm) from the three sandstone sub-types are tested. The inclination angle for all the samples is 70°.
Thuro et al. (2001) studied the shape effect of limestone samples by conducting Brazilian tests. For Brazilian tests in their study, the diameter of 70 mm is taken and length/diameter ratio varies from 0.5 to 2. It can be concluded that the stress state of samples in their study varies from plane stress to plane strain condition by increasing the length/diameter ratio. Consequently, the tensile strengths of all mentioned samples are not comparable to each other, as they are not in the same stress state condition.
However, in the results by Thuro et al. (2001), if one compares the samples with low length/diameter ratio (plane stress condition) with each other, a significant shape effect cannot be observed. This is also the case for the high length/diameter ratio (plane strain condition). Therefore, from above discussion it can be concluded that shape effect in Brazilian tests for the rock samples with the same degree of homogeneity is not dominant.
In general, it can be stated that dominant scale effect in Brazilian tests for the rock samples with a limited size variation is not observed, because they have the same degree of homogeneity. However, for rock samples with a large size variation, the degree of heterogeneity is different and consequently scale effect is observed.
By observing the results shown in Fig. 11, another interesting conclusion is observed. Failure strength is inversely correlated with relative layer activation fracture length for the tested diameter range. Samples of sandstone sub-type a have the highest relative layer activation fracture length and the lowest failure strength in the tested diameter range. Samples of sandstone sub-type b have the lowest relative layer activation fracture length and the highest failure strength. The inverse correlation of failure strength andrelative layer activation fracture length for the tested samples is clearly presented by Fig. 12. This figure shows that higher strength corresponds to the samples with lower layer activation fracture length.
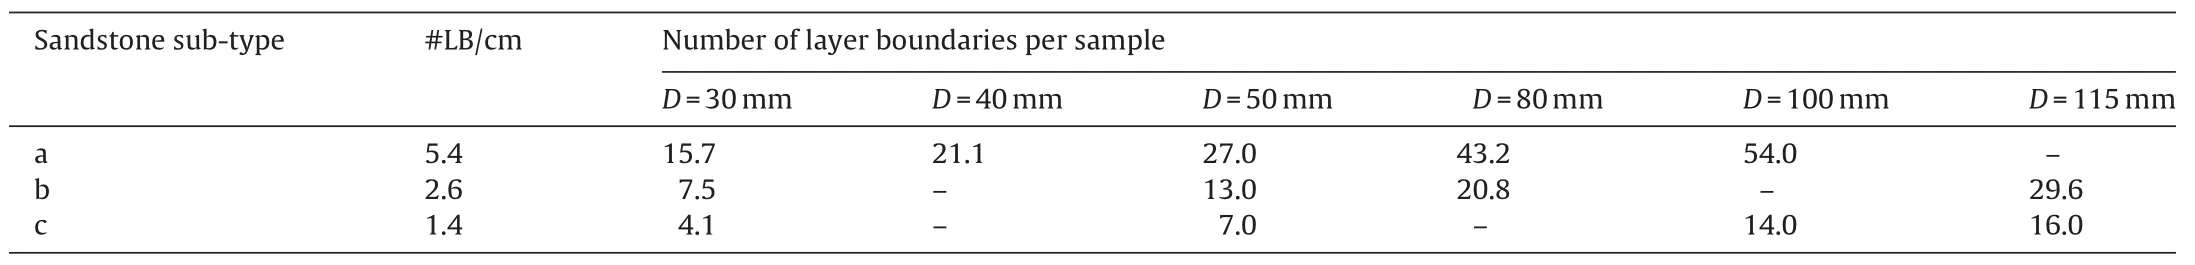
Table 3 Number of layer boundaries per sample in the tested diameter range for the three sandstone sub-types.
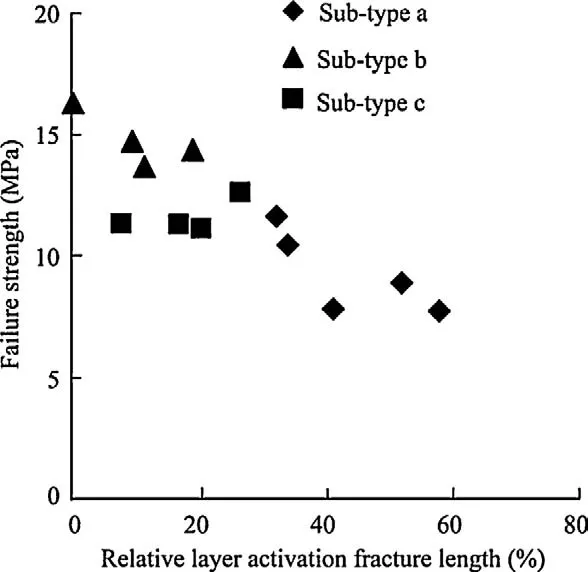
Fig. 12. Correlation of average failure strength and average relative layer activation fracture length for the three sandstone sub-types.
As can be seen in Fig. 11, although the number of total layer boundaries is larger in samples of sandstone sub-types b and c by increasing the samples diameter, their relative layer activation fracture length does not change considerably. It means that the failure patterns of samples from different sub-types of sandstone which have (roughly) the same number of layer boundaries per sample are not similar. Mentioned conclusion is verified by comparing the failure patterns of samples with similar number of layer boundaries.
By knowing the number of layer boundaries per centimetre for each sub-type of sandstone, the number of layer boundaries in each sample with different diameters is calculated. Table 3 presents the number of layer boundaries per sample in the tested diameter range for the three sandstone sub-types. From Table 3 the samples with similar numbers of layer boundaries per sample are grouped. For example, the numbers of layer boundaries in the samples with 3 cm diameter from sandstone sub-type a is 15.7, close to the numbers of layer boundaries in the samples with 11.5 cm diameter from sandstone sub-type c (16.0). The samples with 8 cm diameter from sandstone sub-type b and the samples with 4 cm diameter from sandstone sub-type a are the other example (see Table 3 and also item 4 in Table 4). Five pairs with relatively similar numbers of layer boundaries can be found in Table 3. These five pairs are presented in Table 4 as items 1–5 with their sandstone sub-types, diameters and individual numbers of layer boundaries (#LB/sample).
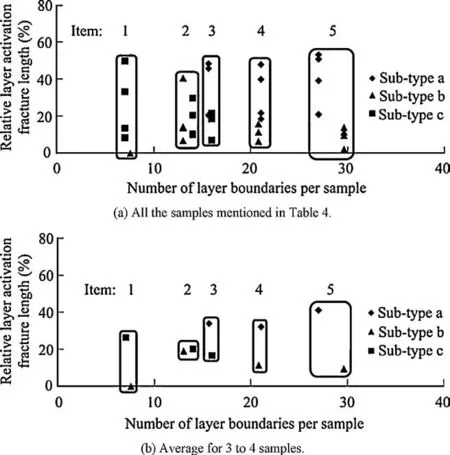
Fig. 13. Variation in relative layer activation fracture length as a function of number of layer boundaries per sample. Items 1 to 5 show the samples with (roughly) the same number of layer boundaries (see Table 4).
Variation in relative layer activation fracture length for samples with (roughly) the same number of layer boundaries (items 1–5 in Table 4) is presented in Fig. 13. Fig. 13a shows that the effect of the number of layer boundaries on layer activation cannot be observed. Furthermore, this figure shows that by increasing the number of layer boundaries per sample (by increasing the sample diameter), any positive trend of relative layer activation fracture length does not exist. Fig. 13b presents the variation in average relative layer activation fracture length as a function of number of layer boundaries per sample in every item. In this figure, only item 2 shows the same average relative layer activation fracture length for the samples with roughly the same number of layer boundaries and for the other four items no correlation can beobserved. Comparison of Fig. 13b with Fig. 13a leads to the same conclusion, i.e. increasing the number of layer boundaries by enlarging the samples does not affect the layer activation. Of course parameters like mineral composition are not significantly different for all samples of a sub-type. Hence, it is concluded that these parameters mainly affect the failure process.

Table 4 Sandstone samples with (roughly) the same number of layer boundaries per sample.
Fig. 14. Variation in relative layer activation fracture length as a function of number of layer boundaries per sample for Modave sandstone sub-types a and b.
Observed weak mineral percentages in sandstone sub-types a, b and c are 23.5%, 7.9% and 12.4%, respectively. Fig. 13 shows that most of the samples from sandstone sub-type a are in the highest range of layer activation while most of the samples from sub-type b are in the lowest range. This observation is compatible with their weak mineral percentage. Among mentioned Modave sandstone sub-types, sub-type a has the largest amount of weak minerals (23.5%) and sub-type b has the lowest (7.9%). Therefore, it is logical to conclude that layer activation depends first on weak mineral percentage and, hence, on the number of layer boundaries per centimetre.
It is interesting to redraw the graphs of Fig. 13 with only the samples of sandstone sub-types a and b (see Fig. 14), as in these sub-types layer boundaries are the only planes of weakness. In sandstone sub-type c apart from the layer boundaries, ripples exist as the secondary plane of weakness. Fig. 14a shows the variation in relative layer activation fracture length as a function of number of layer boundaries per samples for sandstone sub-types a and b. As expected, Fig. 14a shows that similarity in number of layer boundaries of samples with different diameters does not affect the relative layer activation. Fig. 14b presents the variation in average relative layer activation fracture length for samples of sandstone sub-types a and b. In Fig. 14b, both sub-types present relatively identical rate of relative layer activation as a function of number of layer boundaries per sample.
5. Discussions and conclusions
The experimental study on the sandstones from Modave in the South of Belgium, which is a layered rock, shows that the failure stress and fracture pattern are considerably affected by the layer orientation. However, measurements of P-wave velocity show small differences in wave velocity parallel (4.5–5.0 km/s) and perpendicular to the layers (4.4–4.6 km/s).
The results show that larger fracture length correlates with higher strength. Also the samples with low inclination angles which are more fractured have the higher values of strength.
The influence of layer orientation is investigated by three subtypes of the layered sandstone of Modave. The samples are taken from three blocks in the same quarry, collected at close distance (1–10 m). The global behaviour is similar; however, they do not behave exactly the same. For all sandstone sub-types, as inclination angle increases from 0°to 90°, the fracture length corresponding to central fracture(s) decreases while layer activation increases. However, the decreasing and the increasing rates of fractures length for the three studied sub-types are different.
Brazilian test results for one inclination angle (i.e. 70°) for a few samples from these three sub-types are noted. The average value of the failure strength for the three sub-types varies from 7.9 MPa to 14.5 MPa. Although at a macroscopic scale the blocks look similar, there is about 6.6 MPa difference between the smallest and largest average values of the failure strength. Central fracture(s) is predominant for all three sub-types of Modave sandstone; however, layer activation is observed as the secondary failure mode in sub-type a. The percentage of layer activation for sub-type a (41%) is more than two times that for sub-type b (19%). From the above explanation it can be concluded that different failure behaviour of two blocks of layered sandstone from the same quarry is observed.
In this study, sandstone sub-type b has the highest average quartz size (107 μm) and sub-type a the lowest average (69 μm). It is interesting to note that the average value of the failure strength and the total fracture length are the highest for sub-type b of Modave sandstone, while these two parameters are the lowest for sandstone sub-type a. The latter has the lowest average grain size (Tavallali, 2010; Tavallali and Vervoort, 2010b).
The shape effect in the tested diameter range (from 30 mm to 115 mm) with a constant thickness of 25 mm is limited and the failure behaviour of samples is not influenced by their diameter. Also no obvious similarity of failure behaviour of sandstone samples from different sub-types which have the same number of layer boundaries per sample is observed. It means that increasing the number of layer boundaries per sample by enlarging the samples does not influence failure process. By enlarging the samples (in diameter range of 30–115 mm), weak mineral percentage does not change and this is probably the main reason of having relatively the same layer activation in each sandstone sub-type. Above explanation can be summarised as follows: layer activation depends on weak mineral percentage and the number of layer boundaries plays only a role in the case of identical diameter. Or, in other words, the number of layer boundaries per centimetre is more important than the number per sample.
It is also observed that the failure strength is inversely correlated with relative layer activation fracture length for the tested diameter range. Samples of sandstone sub-type a with the highest weak minerals percentage (23.5%) have the highest relative layer activation fracture length and the lowest failure strength in thetested diameter range. Samples of sandstone sub-type b with the lowest weak minerals percentage (7.9%) have the lowest relative layer activation fracture length and the highest failure strength.
Acknowledgements
The financial support of the Research Council of the Katholieke Universiteit Leuven (OT-project OT/03/35) is gratefully appreciated. The work is part of the Ph.D. study by A. Tavallali. Authors acknowledge their sincere thanks to Prof. Rudy Swennen from the Geology Section of KU Leuven for helpful comments and also permitting the use of their microscopic instruments. The authors also thank An De Cleyn for her helpful comments in the geological part of the study.
Amadei B. Importance of anisotropy when estimating and measuring in situ stresses in rock. International Journal of Rock Mechanics and Mining Sciences & Geomechanics Abstracts 1996;33(3):293–325.
Chayes F. Petrographic modal analysis: an elementary statistical appraisal. New York: Wiley; 1956.
Chen CS, Pan E, Amadei B. Determination of deformability and tensile strength of anisotropic rock using Brazilian tests. International Journal of Rock Mechanics and Mining Sciences 1998;35(1):43–61.
Cho JW, Kim H, Jeon S, Min KB. Deformation, strength anisotropy of Asan gneiss, Boryeong shale, and Yeoncheon schist. International Journal of Rock Mechanics and Mining Sciences 2012;50:158–69.
Craig RF. Soil mechanics. London: Chapman and Hall; 1990.
Debecker B, Vervoort A. Experimental observation of fracture patterns in layered slate. International Journal of Fracture 2009;159:51–62.
Gradstein FM, Ogg JG, Bleeker W, Lourens LJ. A new Geologic Time Scale with special reference to Precambrian and Neogene. Episodes 2004;27:83–100.
Han G, Preat A, Chamley H, Deconinck JF, Mansy JL. Palaeozoic clay mineral sedimentation and diagenesis in the Dinant and Avesnes Basins (Belgium, France): relationships with Variscan tectonism. Sedimentary Geology 2000;136:217–38.
Lavrov A, Vervoort A, Wevers M, Napier JAL. Experimental and numerical study of the Kaiser effect in cyclic Brazilian tests with disk rotation. International Journal of Rock Mechanics and Mining Sciences 2002;39(3):287–302.
Pan PZ, Feng XT, Hudson JA. Study of failure and scale effects in rocks under uniaxial compression using 3D cellular automata. International Journal of Rock Mechanics and Mining Sciences 2009;46(4):674–85.
Poty E, Chevalier E. L’activité extractive en Wallonie, situation actuelle et perspectives. Belgium: Ouvrage publié par le Ministère de la Region Wallonne; 2004.
Powers MC. A new roundness scale for sedimentary particles. Journal of Sedimentary Petrology 1953;23:117–9.
Pˇrikryl R. Some microstructural aspects of strength variation in rocks. International Journal of Rock Mechanics and Mining Sciences 2001;38(5):671–82.
Reineck HE, Singh IB. Depositional sedimentary environments. Berlin, Germany: Springer-Verlag; 1986.
Rocco C, Guinea GV, Planas J, Elices M. Size effect and boundary conditions in the Brazilian test: experimental verification. Materials and Structures 1999;32(3):210–7.
Shepard FP. Submarine geology. New York: Harper & Row; 1963.
Szwedzicki T. A hypothesis on modes of failure of rock samples tested in uniaxial compression. Rock Mechanics and Rock Engineering 2007;40(1):97–104.
Tavallali A. Failure of layered Modave sandstone: effect of layer orientation and material properties. Leuven: KU Leuven; 2010 [Ph.D. thesis].
Tavallali A, Vervoort A. Effect of layer orientation on the failure of layered sandstone under Brazilian test conditions. International Journal of Rock Mechanics and Mining Sciences 2010a;47(2):313–22.
Tavallali A, Vervoort A. Failure of layered sandstone under Brazilian test conditions: effect of micro-scale parameters on macro-scale behaviour. Rock Mechanics and Rock Engineering 2010b;43(5):641–53.
Tavallali A, Vervoort A. Failure of transversely isotropic rock material: effect of layer orientation and material properties. In: Proceedings of the 6th international symposium on ground support in mining and civil engineering construction. Johannesburg: The Southern African Institute of Mining and Metallurgy; 2008. p. 317–28.
Tavallali A, Debecker B, Vervoort A. Evaluation of Brazilian tensile strength in transversely isotropic sandstone. In: Proceeding of the 11th congress of the international society for rock mechanics (ISRM 2007). London: Tailor and Francis Group; 2007. p. 269–72.
Thorez J, Dreesen R, Streel M. Famennian. Geologica Belgica 2006;9(1–2):27–45.
Thorez J, Goemare E, Dreesen R. Tide- and wave-influenced depositional environments in the Psammites du Condroz (Upper Famennian) in Belgium. In: Tide-influenced sedimentary environments and facies, sedimentology and petroleum geology. Dordrecht: D. Reidel Publishing Company; 1988. p. 389–415.
Thuro K, Plinninger RJ, Zäh S, Schütz S. Scale effects in rock strength properties, part 1: unconfined compressive test and Brazilian test. In: Proceedings of ISRM regional symposium EUROCK 2001: rock mechanics—a challenge for society. Espoo: A.A. Balkema; 2001. p. 169–74.
Vervoort A, Debecker B, Tavallali A. Fracturing of transversely isotropic rock: an experimental study. In: Proceedings of the 2nd southern hemisphere international rock mechanics symposium; 2012. p. 17–32.
Ye JH, Wu FQ, Sun JZ. Estimation of the tensile elastic modulus using Brazilian disc by applying diametrically opposed concentrated loads. International Journal of Rock Mechanics and Mining Sciences 2009;46(3):568–76.
Yoshinaka R, Osada M, Park H, Sasaki T, Sasaki K. Practical determination of mechanical design parameters of intact rock considering scale effect. Engineering Geology 2008;96:173–86.

Abbass Tavallaliis an Advisor Engineer at International Marine and Dredging Consultants (IMDC) in Belgium. He graduated as a Civil Engineer in 1995 from Shiraz University in Iran. He had an opportunity to participate in the huge geotechnical and structural projects in Iran. He gained nine years of professional experience in the field of dam construction and tunnelling projects prior to continuing his studies for Ph.D. He got his Ph.D. degree in geotechnical engineering from KU Leuven (Katholieke Universiteit Leuven) in Belgium in 2010. Then (in 2011) he joined IMDC and he carries out a diverse range of geotechnical and dredging subjects.
∗Corresponding author. Tel.: +32 16321171.
E-mail address: abtavallali@yahoo.com (A. Tavallali).
Peer review under responsibility of Institute of Rock and Soil Mechanics, Chinese Academy of Sciences.
1674-7755 © 2013 Institute of Rock and Soil Mechanics, Chinese Academy of Sciences. Production and hosting by Elsevier B.V. All rights reserved.
http://dx.doi.org/10.1016/j.jrmge.2013.01.004
 Journal of Rock Mechanics and Geotechnical Engineering2013年5期
- Journal of Rock Mechanics and Geotechnical Engineering的其它文章
- Easy profit maximization method for open-pit mining
- A discontinuum-based model to simulate compressive and tensile failure in sedimentary rock
- Landslide disaster prevention and mitigation through works in Hong Kong
- Easy profit maximization method for open-pit mining
- Reply to Discussion on “A generalized three-dimensional failure criterion for rock masses”
- Discussion on “A generalized three-dimensional failure criterion for rock masses”