
Short- and long-term behaviors of drifts in the Callovo-Oxfordian claystone at the Meuse/Haute-Marne Underground Research Laboratory
2013-06-05 14:54:26ArmndNoiretZghondiSeyediANDRAMeuseHuteMrneUndergroundReserchLortory55290BureFrnce
G. Armnd, A. Noiret, J. Zghondi, D.M. SeyediANDRA R&D, Meuse/Hute-Mrne Underground Reserch Lortory, 55290 Bure, Frnce
bANDRA R&D, 92298 Chatenay-Malabery, France
Short- and long-term behaviors of drifts in the Callovo-Oxfordian claystone at the Meuse/Haute-Marne Underground Research Laboratory
G. Armanda,∗, A. Noireta, J. Zghondia, D.M. Seyedib
aANDRA R&D, Meuse/Haute-Marne Underground Research Laboratory, 55290 Bure, France
bANDRA R&D, 92298 Chatenay-Malabery, France
ARTICLE INFO
Article history:
Received 26 March 2013
Received in revised form 5 May 2013
Accepted 12 May 2013
Field experiments
Claystone
Tunnel convergence
Induced fractures
Short- and long-term behaviors
Since 2000, the French National Radioactive Waste Management Agency (ANDRA) has been constructing an Underground Research Laboratory (URL) at Bure (east of the Paris Basin) to perform experiments in order to obtain in situ data necessary to demonstrate the feasibility of geological repository in the Callovo-Oxfordian claystone. An important experimental program is planned to characterize the response of the rock to different drift construction methods. Before 2008, at the main level of the laboratory, most of the drifts were excavated using pneumatic hammer and supported with rock bolts, sliding steel arches and fiber shotcrete. Other techniques, such as road header techniques, stiff and flexible supports, have also been used to characterize their impacts. The drift network is developed following the in situ major stresses. The parallel drifts are separated enough so as they can be considered independently when their hydromechanical (HM) behaviors are compared. Mine-by experiments have been performed to measure the HM response of the rock and the mechanical loading applied to the support system due to the digging and after excavation. Drifts exhibit extensional (mode I) and shear fractures (modes II and III) induced by excavation works. The extent of the induced fracture networks depends on the drift orientation versus the in situ stress field. This paper describes the drift convergence and deformation in the surrounding rock walls as function of time and the impact of different support methods on the rock mass behavior. An observation based method is finally applied to distinguish the instantaneous and time-dependent parts of the rock mass deformation around the drifts.
© 2013 Institute of Rock and Soil Mechanics, Chinese Academy of Sciences. Production and hosting by Elsevier B.V. All rights reserved.
1. Introduction
Clay formations in their natural state exhibit very favorable conditions for repository of radioactive waste, as they generally have a very low hydraulic conductivity, small molecular diffusion and significant retention capacity for radionuclide. These properties provide favorable conditions for repository of radioactive wastes.
In France, in order to demonstrate feasibility of a radioactive waste repository in claystone formation, the French NationalRadioactive Waste Management Agency (ANDRA) started in 2000 to build the Meuse/Haute-Marne Underground Research Laboratory (URL) at Bure (nearly 300 km east of Paris, Fig. 1). The host formation consists of a claystone (Callovo-Oxfordian argillaceous rock – COX) lying between depths of 420 m and 550 m (Fig. 1). The COX claystone is overlain and underlain by poorly permeable carbonate formations.
The first objective of the research program was to characterize the confining properties of the clay through in situ hydrogeological tests, chemical measurements and diffusion experiments and to demonstrate that the construction and operation of a geological disposal will not introduce pathways for radionuclide migration (Delay et al., 2007). In 2005, ANDRA demonstrated the feasibility of repository in a deep claystone layer (ANDRA, 2005).
Since 2006, further researches are ongoing in the URL to increase the knowledge on the rock properties, to test and optimize repository concepts at full scale on site. The excavation worksite in the host layer is a scientific experimentation in itself to characterize the impacts of digging, to understand the hydro-mechanical (HM) behavior of the claystone and to study the excavation damaged zone (EDZ). To know, to control and to be able to remediate the impact of the excavation in terms of EDZ are the main issues forthe repository safety (Bauer et al., 2003; Blümling et al., 2007). Furthermore, understanding the impact of the support system and excavation methods on the HM behavior of the drift at short- and long-term is a key issue for optimizing the support designs.
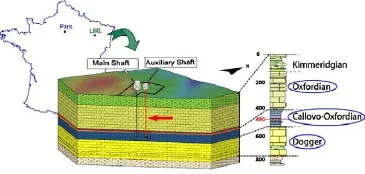
Fig. 1. Meuse/Haute-Marne URL: location and geology (ANDRA, 2005).
An extensive program of experimental studies was planned to characterize the response of the host rock to different shaft and drift excavation/construction methods. The study of the formation and evolution of the EDZ around the structures is a main part of the program. Numerous experiments and direct measurements have been performed in the laboratory drifts during their construction. Fig. 2 presents the extent of the URL until 2015. Indeed, the construction of about 150 m of new galleries is planned each year.
The main level of the URL at −490 m is the most representative level of the future disposal in terms of mechanical behavior. An important experimental program is planned to characterize the response of the rock to different drift construction methods (Fig. 2) at the main level. Before 2008, most of the drifts have a horseshoe shape cross section (17 m2area, with r ≈ 2.3 m) excavated with a pneumatic hammer. Since 2008, a counter vault has been used to reduce uplift of the foot plate (drift GED). The spans of the excavation are mainly 1 m long and are immediately covered with 3–5 cm of fibered shotcrete. Excavated zone was supported immediately by bolts and sliding arches; and 10 cm thick layer of shotcrete was set in place. Martin et al. (2010) presented the efficiency of the different support elements – at the front and at the faces – under different digging configurations during the laboratory construction. Other excavation technique using a road header has been tested with the same support and with other types of supports. In drift GCS, the support is ensured by an 18 cm thick fiber reinforced shotcrete shell, interrupted by 12 yieldable concrete wedges (hiDCon®); completed by a crown of 12 HA25 radial bolts of 3 m length every meter. Drift GCR was built in a similar way as drift GCS and left “unsupported” for 7 months. A concrete lining of a 27 cm thick was casted in place at this time. Two types of concretes were used, namely C60/75 and C37/40 to obtain different stiffnesses and strengths.

Fig. 2. Meuse/Haute-Marne URL drifts network (gray: already excavated, pink: to be excavated).
A complete description of the work can be found in Bonnet-Eymard et al. (2011). For BPE experiment, excavation was performed with the pneumatic hammer and support is made of 4-layer fiber reinforced shotcrete (12 cm thick) emplaced after the four successive excavation steps. A thick lining of 45 cm is emplaced at a distance of maximum one diameter (d = 6.2 m) from the excavation front. Four above-mentioned drifts are illustrated in Fig. 3.
These various configurations, constructed in different directions, provide insights into the influence of the structure geometry, the support system, the excavation methods and the natural stress state, and on the drift HM behavior. The in situ experiments in parallel drifts are performed considering enough spacing to avoid any mechanical interaction.
This paper presents the results of the mine-by experiments performed around various drifts at the main level of the URL, and discusses the observation and link between the deformation and the observed excavation induced fractures. Pore pressure evolution is not presented and discussed in the paper.
2. Callovo-Oxfordian claystone and in situ stress state
2.1. In situ stress state
At the Meuse/Haute-Marne URL, the anisotropic stress state of the claystone was determined by Wileveau et al. (2007). The major stress (σH) is horizontally oriented at NE150°. The vertical stress (σv) is nearly equal to the horizontal minor one (σh):

where Z is the depth, ρ is the density, and g is the gravity.
The ratio σH/σhis close to 1.3 and varies with depth and the rheological characteristics of the respective layers.
2.2. Mineralogical composition
Mineralogical composition varies slightly within the stratigraphic levels. At the −490 m level, mineralogical study showed a rather homogeneous composition of tectosilicates (20%), carbonates (20%–25%) and clay minerals (50%–55%) together with subordinate pyrite and iron oxides (3%). The clay minerals composition is relatively constant at 55% I/S (illite–smectite interstratified minerals), 30% illite and 15% kaolinite and chlorite.
2.3. Hydro-mechanical behavior
Different laboratory tests have been conducted on core samples to obtain the HM properties of the claystone. Due to a very small mean pore diameter (about 0.02 μm), the claystone has a low permeability (5 × 10⁻²⁰to 5 × 10⁻²¹m2) while its average porosity varies between 14% and 21% and is equal to 18% ± 1% at the main level of the URL. That level of permeability makes the measurement of pore pressure complex during triaxial tests. Research is ongoing to get better data on that subject.
Natural water content of core samples ranges between 5% and 8%. Pore pressure at the main level (−490 m) is around 4.7 MPa.
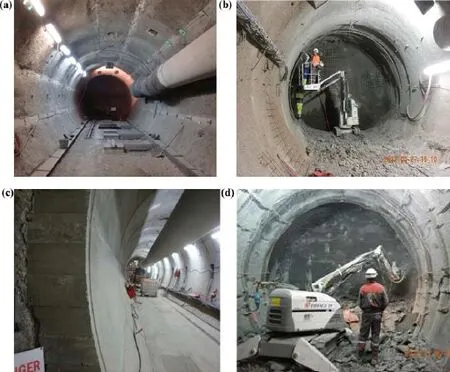
Fig. 3. Example of four different drifts: (a) GCS with compressible concrete wedge, (b) GCR with concrete lining grouted in place, (c) BPE with 0.45 m of shotcrete projected in four layers, (d) GED drift with classical support, shotcrete and sliding steel arches.

Fig. 4. Main features of the mechanical behavior of Callovo-Oxfordian claytsone: (a) triaxial test (ANDRA, 2005), (b) uniaxial creep test (Zhang et al., 2010).
The main features of the short-term mechanical behavior observed on the samples of claystone under triaxial tests can be summarized as follows (Fig. 4a): a linear behavior is observed under low deviator stresses; the loss of linearity of stress-lateral strain curves begins approximately at 50% of the peak value of the deviator stress, which can be associated with damage. Under low confining pressures, a brittle failure of the samples is observed and corresponds to the formation of a shear band inclined with respect to the sample axis. There is a strong dependence of the mechanical behavior on the confining pressure, marked by a transition from a brittle toward a ductile behavior. It has been shown that a failure criterion based on the generalized Hoek–Brown criterion is suitable for describing the shear strength of the Callovo-Oxfordian claystone (Souley et al., 2011).
Long-term behavior of the claystone has been studied through creep tests. Fig. 4b presents the typical creep strain-time curves on five COX samples under multi-step uniaxial loads over 6 years. Zhang et al. (2010) showed that the creep behavior under an increasing load is characterized by two phases. First, a transient phase with decreasing rates governed by strain hardening is observed. This phase is followed by a second one with an asymptotically approached constant rate after strain recovery. The creep test under dropped load contrary evolves firstly backwards with negative rates and then inversely returns with time to a steady-state creep at a positive rate. The creep rates of 2 × 10⁻¹¹to 6 × 10⁻¹¹s−1, obtained on five samples after uploading, are relatively higher than those of 1 × 10⁻¹¹to 2 × 10⁻¹¹s−1obtained after downloading. Obviously, the creep behavior is dependent on the loading path. Similar creep rates have been measured by other authors (Gasc-Barbier et al., 2004). Zhang et al. (2010) also pointed out that, in uniaxial creep tests, the creep rate varies very slowly and linearly with stress at low stresses (below 13–15 MPa). Above that, the creep rate increase deviates from the linearity. The acceleration of the creep rate seems to be linked with the damage onset and increase.
Table 1 represents the mechanical characteristics of Callovo-Oxfordian claystone. Sedimentation has led to a slightly anisotropic behavior of the COX claystone. From compressive and shear wavemeasurements on cubic samples, the anisotropy ratio of the dynamic Young’s modulus is found to be around 1.3. From triaxial tests, this ratio can reach 2 for some samples.
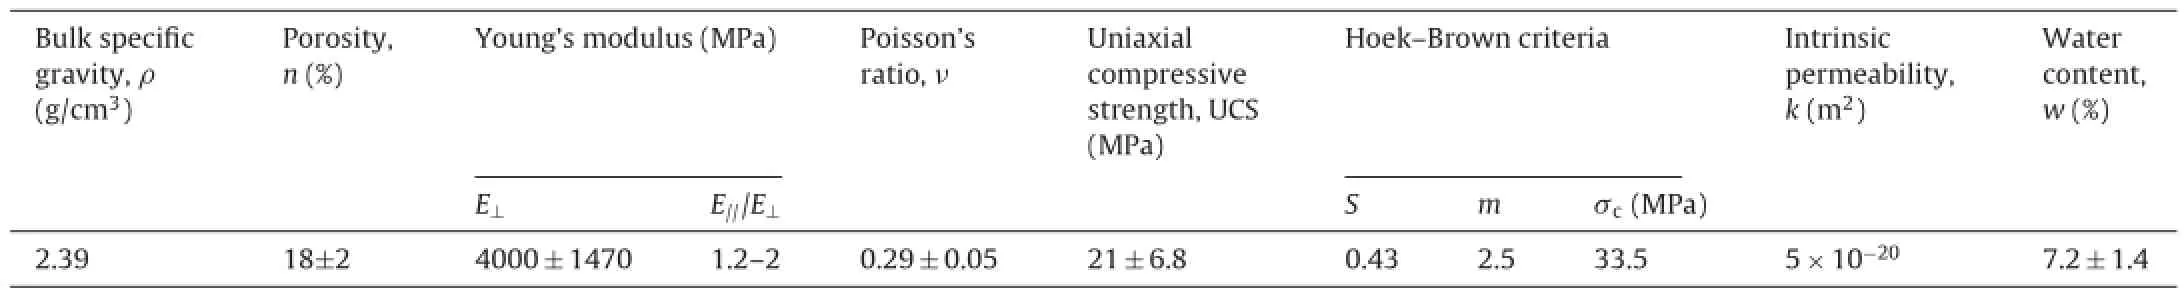
Table 1Callovo-Oxfordian claystone parameters.
3. Experimental set up
A mine-by experiment is a state-of-the-art project to characterize excavation-induced damage and to determine the relationships governing the behavior of a rock mass around an underground opening. Such test has been implemented in various rocks in several countries, such as in Lac du Bonnet granite (Read and Martin, 1996), ED-B experiment in Opalinus claystone (Bernier et al., 2002) or CLIPEX experiment in indurate Boom Clay (Bernier et al., 2002).
At the Meuse/Haute-Marne URL, the first mine-by test has been performed during the access shaft sinking in the upper part of the Callovo-Oxfordian claystone. Armand and Su (2006) showed that this experiment performed throughout the shaft-sinking period provided a wealth of consistent data and allowed in situ measurements of the evolution of mechanical and HM parameters.
At the main level of the Meuse/Haute-Marne URL, locations of the experimental drifts have been chosen, when it was possible, in order to perform mine-by experiments. The major issue was to provide deformation and pore pressure measurements in near and far field of the new excavated drift before excavation works in order to investigate the HM impact of the digging. Pore pressure measurements have been performed at least 2 months before drift excavation, to let pore pressure build up and stabilize. Four drifts excavated in perpendicular directions and supported with different systems are presented in this section.
3.1. Drift GCS
The GCS drift has been excavated in the direction of the major horizontal stress from the south drift (GLS) and 30 m away from the GAT drift in order to restrict HM interference between the two drifts. The GCS drift has circular section with a 2.6 m radius. The digging was performed with a road header, which allowed getting an average over excavation lower than 0.1 m, except at the floor where it could reach 0.4 m (Bonnet-Eymard et al., 2011).
A total of 15 instrumented long boreholes (30–50 m long) were drilled from the surrounding drifts (GAT and GLS). Nine boreholes (5 chambers) are devoted to the measurement of pore pressure and cover a wide span from GCS wall up to 50 m away. Three extensometers measure radial and axial displacements in the horizontal plane, and 3 inclinometers measure vertical displacement. Fig. 5 shows the boreholes locations. In spite of the boreholes length, all devices have been successfully installed and borehole trajectories could be measured or assessed properly.
Additional measurements have been performed during digging:
(1) Geological survey of the drift face and of sidewalls was performed every 5 m.
(2) 6 convergence sections were emplaced in the drift.
(3) In view of measuring the deformation and stresses (i.e. total pressure) in the lining, special supports have been casted in the shotcrete.
(4) Five 30 m long radial boreholes were drilled at 2.1 m from the front to set up multi-point extensometers. Four 1 m long extensometers have been emplaced in the same section to complete the set up.
After the completion of the work, other boreholes were performed to characterize the EDZ properties (extent, permeability, etc.) and evolution. Several measuring methods were used to assess the extension of these damaged and disturbed zones around the drifts according to different parameters.
Structural analysis of the core samples to detect and describe the presence of fractures and to define the fracture density is conducted according to depth:
(1) Overcoring of resin-filled EDZ fractures can be found in Bossart et al. (2002).
(2) Micro-seismic logging measurements (“velocity surveys”) to study the evolution of P- and S-wave velocities were performed according to the distance from the drift wall.
(3) Permeability measurements were carried out in 8 boreholes through gas and hydraulic tests to assess the EDZ permeability in time and the degree of saturation of the COX claystone.
(4) Strain gages and flat jacks were installed on the shotcrete, in a way to follow the behavior of the three different concrete
supports.
A complete description of the measurement set-up can be found in Noiret et al. (2011).
3.2. Drift GCR
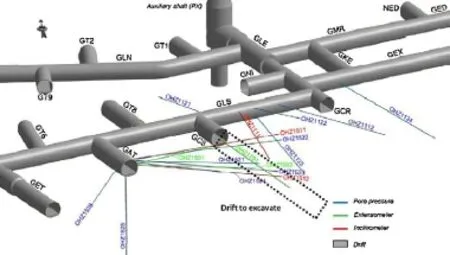
Fig. 5. Mine-by experiment set up around GCS drift (blue: pore pressure measurement, green: extensometer, red: inclinometer).

Fig. 6. Experimental set up around GCR drift (blue: pore pressure measurement, green: extensometer, red: inclinometer, purple: EDZ characterization).
The GCR drift is parallel to GCS with a circular section slightly larger than the later (r = 2.7 m). Excavation works were similar except in the last part of the drift where the compressible concrete wedges were removed (the 18 cm thick fiber reinforced shotcrete shell is not interrupted). After 7 months, a concrete lining was grouted in place in two steps (the counter vault first, then the vault).
The measurement set-up is also similar to the one used for GCS. Boreholes (40–50 m in length) were drilled from the GCS drift to measure strain and pore pressure (3 extensometers, 2 inclinometers and 3 pore pressure, Fig. 6). During the excavation height extensometers (4 long (20 m) and 4 short (3 m)) were installed near the front face, with 5 convergence sections. After excavation, 5 boreholes were used to carry out long-term micro-seismic logging, and multi-packer systems were installed in 6 boreholes to characterize and follow EDZ evolution in time.
Strain gages, total pressure cells and flat jacks were installed on the shotcrete and grouted lining, in a way to follow the behavior of the three different concrete supports.
3.3. Drift BPE
BPE is a drift excavated parallel to the major horizontal stress. The section is also circular but with a diameter of 6.3 m. Support is formed of 0.45 m thickness of shotcrete. The shotcrete is projected in four layers after each new excavation step. Before excavation of the drift, three instrumented boreholes were equipped with pressures and deformation measurements. The shotcrete was instrumented immediately with embedded strain gage for deformation measurements, and total pressure cells. Three-dimensional (3D) laser scans were performed in order to estimate shotcrete layers thicknesses, sensors position and short-term deformations. Radial displacement and convergence of the excavated section have also been realized. After excavation, 3D scanners, convergence measures as well as flat jacks measures were carried out.
Behavior and aging of the used shotcrete will be studied through laboratory tests in a way to optimize the lining behavior through back analysis.
3.4. Drift GED
The GED drift is classical section (radius of 2.3 m) with a counter vault, supported by bolts, sliding arches and 10 cm thick layer ofif ber shotcrete. The shotcrete is cut to allow sliding of the arches at a de fined load. Due to location of drift GED, no borehole could be installed before the excavation work (Fig. 2). Convergences were measured in 6 sections and two sections of extensometers have been emplaced (one during the work and one after). Numerous boreholes have been drilled and cored for different experiments and a consistent data set was provided for induced fractured analysis.
4. Experimental results
4.1. Excavation-induced fractures observed at the main level of the URL
An important characterization investigation of excavationinduced fracture network around openings has been conducted at the main level of Meuse/Haute-Marne URL by structural analysis of the front face and walls, the analysis of cores and resin impregnated cores (Armand et al., 2007).
Armand et al. (2013) described the induced fractures network observed at the main level of the URL. Drift excavations exhibit extensional (mode I) and shear (mode II) fractures that were not observed in drifts at the −445 m level. Spalling is not the prevailing mechanism of failure due to the high-level mean stress compared to the Callovo-Oxfordian claystone strength. Shear failure seems to occur first from the excavation front face. Shear bands have been observed by the resin impregnation method at smaller scale confirming the shear failure mechanism. Armand et al. (2013) showed that the fracture pattern and extent depend on the drift orientation versus the state ofin situ stress. The maximum extent of fracture zones in different drifts can be summarized as follows:
(1) Drifts parallel to σH: the extensional and shear fractures are observed within 0.4 and one diameter from the wall, respectively.
(2) At the roof and ceiling, shear and extensional fracture zones are mixed up to 0.15 diameter.
(3) Drifts parallel to σh: the extensional and shear fractures are observed up to 0.5 and one diameter respectively, at the roof and the ceiling. At the wall, shear and extensional fracture zones are mixed up to 0.2 diameter.
Fig. 7 illustrates the model proposed to represent the fracture networks for drifts parallel to the two horizontal principal stresses, and Table 2 gives the extent of the different types of fracture zones.
The area with unloading fractures (mode I) exhibits the highest hydraulic conductivity up to 10−10m/s. This high value is due to the fracture transmissivity and not the permeability of the rock matrix. Farther from the wall, the shear fractures exhibit low transmissivity, which did not considerably affect the average hydraulic conductivity.
4.2. Deformation of the GCS/GCR drifts
Similar front face displacements are observed for drifts GCS and GCR as the excavation and support technics were the same until the concrete lining emplacement, except in the section where the compressive concrete wedges were removed. In this chapter, comparison of the two drift behavior is discussed just in this specific section without any compressive wedge.
The borehole OHZ1701 (equipped with a reverse head extensometer) was drilled at the axis of the GCS drift in order to monitor displacement of the front toward the drift. Fig. 8 represents the axial displacement of the face during digging. It means that if the front face reaches the first point, the measurement is loosed (the sensor is destroyed). Accordingly, the total displacement in front of the face is fully recorded up to 1.5 m of the front. The influence of the excavation spans is highlighted. The same evolution is observed for all the sensors except for sensor 6, which shows an unexpected deflection early in time.
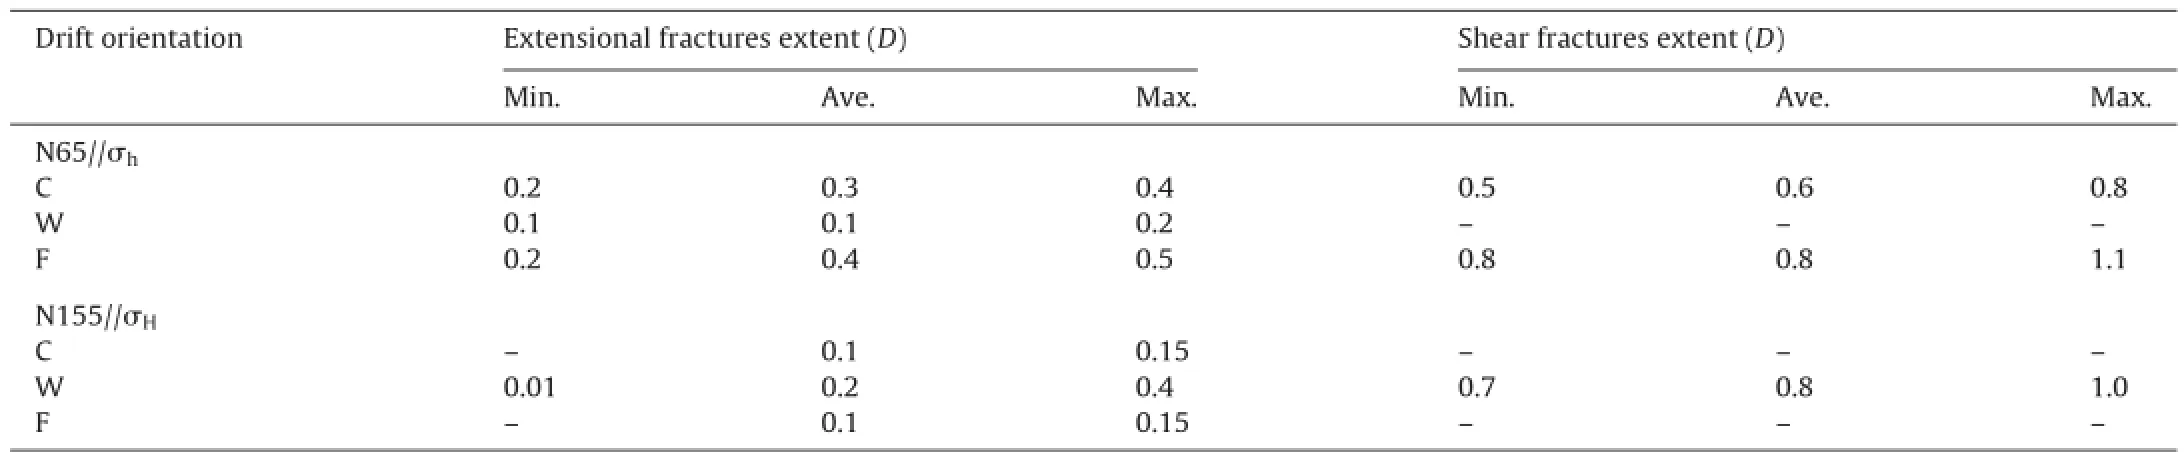
Table 2Extent of shear and extensional fractures around drift at the main level of the URL.
Displacement toward the front face appears when the front reaches 10 m (about 2 diameters) ahead the sensor and the average displacement measured is 2.74 mm at 1.45 m ahead the front.
Five convergence ropes between 6 anchors are used to measure convergence in each section. Fig. 9 shows the horizontal and vertical convergences measured in GCS drift as a function of time and in GCR drift until the support casting in the section without any compressive concrete wedges. The horizontal convergences are perceptibly higher than the vertical ones (ratio ≈ 2), while the in situ stress state is nearly isotropic. However, evolution of the horizontal and vertical convergences in time is similar. It can be seen that more than 80% of the convergence has been reached during the first 100 days.
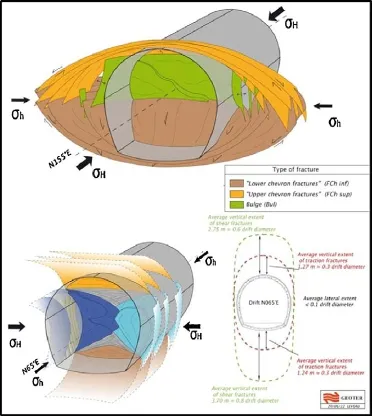
Fig. 7. Induced fracture networks at the main level of URL for drifts parallel and perpendicular to the horizontal major stress.
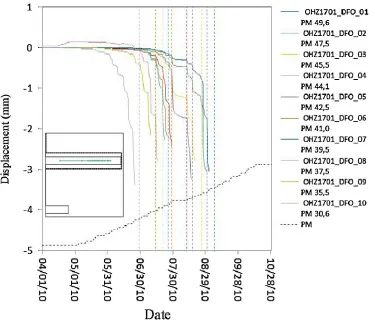
Fig. 8. Displacement of GCS front face as function of time (PM is the location of the front, dash line shows the date at which the front crosses the measurement point).
The convergence rates decrease with time and reach velocities lower than 5 × 10⁻¹¹s−1. In GCR drift without compressive wedges, the general trend of the curve and the convergence ratio are similar (Fig. 9), but the amplitude of convergence is smaller due to the fact that the shotcrete support without wedges is stiffer than the one with compressible wedges. It also means that the stress in the shotcrete lining increases more when compressible wedges are not used, which is observed in the displacement/load measurements. The average convergence amplitudes are divided by 2.
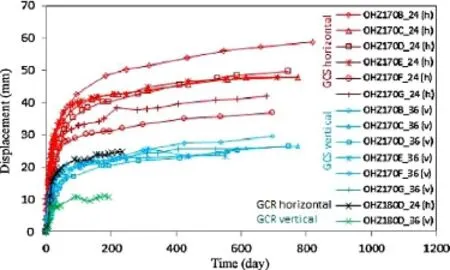
Fig. 9. Convergence of the GCS and GCR drift in the area without compressible wedge. ‘h’ means horizontal; ‘v’ means vertical.
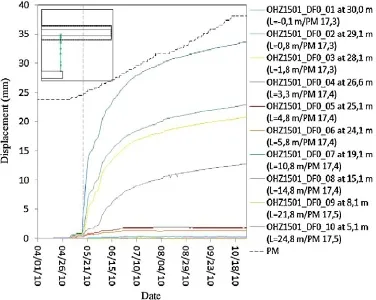
Fig. 10. Radial displacement, at different distances (L) from the wall, measured during the excavation of GCS drift (blue dash line is the date at which the front crosses the extensometer).
To better understand deformation during the excavation work, an extensometer has been drilled from the GAT to the GCS drift, ending close to the side wall of the GCS. The main advantage of this measurement compared to the convergence measurements or the classically installed extensometers is that it can record displacement before the front face reaches the section. The extensometer starts to record radial displacement when the front is two steps of excavation (2.4 m ≈ 1 radius) ahead the section (Fig. 10). Beyond 7 steps of excavation, the displacement does not show any jump. This means that the long-term deformation behavior is predominant (versus the elastoplastic one).
4.3. Comparison of GCS/GCR and BPE deformations
Figs. 11 and 12 present a comparison of deformations measured with extensometer (from the drift wall and 3 m deep in the rock) in three drifts, with three types of supports. 0°indicates horizontal extensometer at the wall, ±90°indicates vertical upward and downward extensometer at the roof and floor, respectively. The general trends are basically the same.
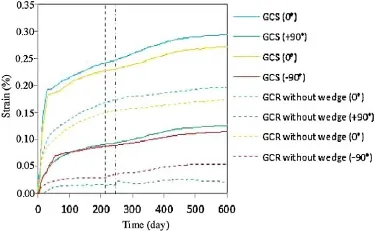
Fig. 11. Comparison of deformation (measured from the wall up to 3 m in rock) in GCS and GCR drifts with compressible concrete wedge (two black dashed lines show when each step of the lining is grouted).

Fig. 12. Comparison of deformation (measured from the wall to 3 m in rock) in GCS and BPE drifts.
The increase of the stiffness of the shotcrete lining by increasing thickness or removing compressible wedge does not change the overall behavior, but deformations amplitude is a little reduced. However, the convergence ratio increases from 2.5 in GCS to 3.5 in BPE and to 6 in GCR.
During the excavation, deformation is the smallest in the GCR drift, meaning that, in short term, the 20 cm shotcrete lining is stiffer than shotcrete lining of 45 cm projected in four layers of 10 cm during 2 weeks.
After the shotcrete maturation (around 28 days) the rate of deformation in BPE is two times lower than the ones measured in GCS and GCR. This result illustrates the effect of the lining support stiffness on rock deformations. After 28 days, the similar rate of deformation in GCR compared to GCS could be explained by the fact that the load is more important in GCR support, and the shotcrete started to be damaged and stiffness of the support was reduced. In GCR (Fig. 11), small deformations variation occurs just after the grouting of the concrete lining, which is related to local stress state change (load of the counter vault lining) and thermal effect due to concrete curing. Installing the concrete lining decreases deformation rate in the rock, but cannot reduce it to zero. The shrinkage of the concrete allows deformation of the rock. In the three drifts, deformation rate is lower than 10−11s−1, 1 year after excavation.
4.4. Deformations of GED drift
Fig. 13 shows convergence measured in a drift parallel to the minor horizontal stress (GED). In this direction, the vertical convergence is higher than the horizontal one, which is the opposite of the observations in drifts parallel to the major horizontal stress. It is worth noting that the in situ horizontal stress is about 1.3 times the vertical one. The fact can be considered as the main reason of the anisotropic damage pattern observed around GED drift. The convergence ratio (Ch/Cv) is 0.25. High convergence rates are observed during the first 3 months. A decrease of convergence rates is measured during the 3 years of observation.
As the horizontal convergence decreases faster than the vertical one, the convergence ratio also decreases. It can be noticed that the vertical convergence varies from 80 mm to nearly 120 mm after 1 year, depending on the section. This discrepancy is larger on the vertical convergence than that on the horizontal one. The distance of the convergence ropes to the front is not exactly the samefor all the sections. However, this dispersion of the ropes position could not explain all the discrepancy observed on convergence values. The variability of the induced fracture networks may play an important role.

Fig. 13. Convergence of GED drift (parallel to σH).
5. Discussions and concluding remarks
Laboratory tests performed on samples exhibit an elasto-viscoplastic behavior of the Callovo-Oxfordian claystone. The analysis of the measurements performed in situ around the drifts confirms these observations. Two major phenomena can be distinguished. First, elastoplatic and damage mechanisms seem to be predominant on the short-term behavior of the drift. During the excavation work, fracture networks are induced around the drifts due to the semi-brittle behavior of the rock. Armand et al. (2013) showed that most of the induced fractures (75%), mainly at the front, appear in mode II or III (shear fracture) and 25% are in mode I. Second, the drifts’ deformations develop as a function of time. Time-dependent behavior of the rock, e.g. the creep of the rock matrix and the possible propagation of the induced fractures, seems to be more predominant in this phase and thus significantly affect the design of the support system. HM coupling (not discussed in this paper) is also a source of differed deformation, due to pore pressure dissipation.
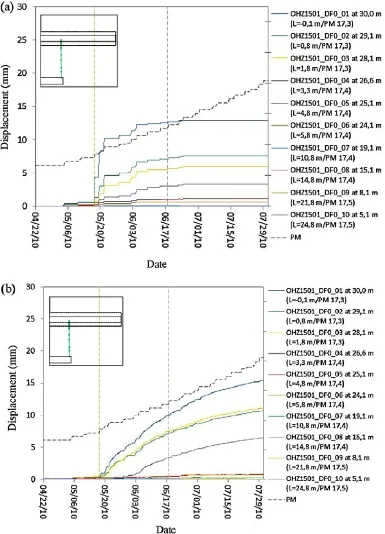
Fig. 14. Radial displacement at the wall during (a) instantaneous response (elsatoplastic behavior), (b) differed response (L is the distance from the wall).
Orientation of the drift, regarding to the horizontal major stress, plays an important role in the measured convergence. Anisotropic convergences are observed in all drifts. However, this anisotropy is smaller for drift parallel to the major stress than the one observed in the drift perpendicular to the major horizontal stress, where the stress anisotropy is larger (ratio ≈ 1.3). Furthermore, the anisotropy of convergence develops in two opposite directions in drifts parallel and perpendicular to σH. In all the drifts, the major convergence is measured where the fracture zone is located. To better understand the relationship between deformation and deformation rates and damage around the drifts, radial deformation measured in drift GCS has been reanalyzed in order to separate instantaneous and differed response to digging. Finally, let us consider that the elastoplastic displacement is induced instantaneously during each excavation step. Between each excavation step, convergence increases due to differed effects. In this framework, each drift displacement curve can be seen as a set of “jumps” due to elastoplastic deformations and “slightly increasing curves” between excavation steps due to differed deformations. Two radial displacement curves are plotted for GCS drift in this manner (Fig. 14). The black dashed line in Fig. 14 shows the excavation steps. Green vertical dashed line shows the date when the front crosses the extensimeter and the blue dashed line indicates the point beyond which no more instantaneous jump is observed. As it can be seen, no more “instantaneous elastoplastic deformation” is measured when the front reaches approximately 2 diameters. At this time, elastoplastic deformation (Fig. 14a) is slightly larger than the differed one (Fig. 14b). Elastoplastic deformation represents 40%–45% of the total deformation at 90 days, and around 30% at 900 days. Farther 5.8 m deep in the rock, differed deformation is very small. The contribution of the far field is about 5% of the total elastoplastic deformation (it will be around 10% with an elastic behavior), 4% of the differed deformation at 90 days and less than 1% at 900 days. The decrease of relative displacement at 5.8 m from the wall (Fig. 10) could be due to a measurement error because this displacement has been affected by GAT drift convergence as the end of the extensometer is influenced by GAT convergence. Nevertheless, the very small contribution of the far field to the total deformation at the wall exhibits that the differed deformation comes from the near field. In other words, most of the differed deformation appears in the fractured zone. It is difficult to distinguish the contribution of the extensional fractures zone and of the shear fractures zone. However, it seems that the total deformations in the first meter (approximately the extensional fracture zone) are the ones that increase the fastest, meaning that the differed deformation rates are more important in this zone.

Fig. 15. Deformation rates between anchors of extensometers in drift GED (parallel to σh): (a) OHZ1204 upward borehole at the roof, (b) OHZ1201 horizontal borehole at the wall.
Figs. 15 and 16 represent deformation rates between anchors of extensometers as a function of time in different drifts. Due to the low deformation rates and sensor uncertainties, the data have to be averaged by moving average method over 60 days. Using this method, the beginning of the curve could not be used, and the deformation rates lower than 10−12s−1are not meaningful. In all cases, deformation rates decrease with time. However, some fluctuation that is related to thermal deformation can be seen due to seasonal temperature changes in the airing.
In GED drift (Fig. 14), the vertical deformation rates are larger than the horizontal ones. After 100 days, the deformation rates at the wall are lower than 10−11s−1. At the roof, greater rates are measured up to 4.9 m to the wall. After 1000 days, those rates are lower than 5 × 10⁻¹¹s−1. Deeper in the rock deformation rates is negligible. In drift GCS (parallel to σH), the deformation rates are lower than the ones measured upward the drift GED. At the roof, the rates are higher just between the wall and 1.9 m deep in the rock. After 1 year, the rates remain lower than 10−11s−1. At the wall where damage is larger, the rates are higher than that at the roof. The high rates are localized in the fractured zone. Farther in the field deformation, rates are negligible. These data in different drifts emphasize that:
(1) After 1 year, deformation rates are in the same velocity range as the one measured on creep test or lower.
(2) Important deformation rates are linked with the damaged zone, which is consistent with creep test in which damage increases the deformation rates.
Further experiments will be performed with different methods of supports. A tunnel boring machine (TBM) will be tested with segments emplacement technique in 2013. All new experimental drifts are instrumented in order to measure the short- and longterm HM behavior of the EDZ. This will also provide new insights for understanding the impact of different support stiffnesses on the long-term rock mass behavior.

Fig. 16. Deformation rates between anchors of extensometers in drift GCS: (a) OHZ1705 upward borehole at the roof, (b) OHZ1704 horizontal borehole at the wall.
ANDRA. Dossier 2005 Argile. evaluation de la faisabilité du stockage géologique en formation argileuse profonde. Rapport de synthèse. France: ANDRA; Juin 2005 http://www.andra.fr
Armand G, Su K. Hydromechanical coupling phenomena observed during a shaft sinking in a deep argillaceous rock. Nanjing: Geoproc; 2006. p. 725–31.
Armand G, Wileveau Y, Morel J, Cruchaudet M, Rebours H. Excavated damaged zone (EDZ) in the Meuse Haute Marne underground research laboratory. In: Riberiro e Sousa, Olalla, Grossmann, editors. 11th congress of the international society for rock mechanics; 2007. p. 33–6.
Armand G, Leveau F, Nussbaum C, de La Vaissiere R, Noiret A, Jaeggi D, et al. Geometry and properties of the excavation induced fractures at the Meuse/Haute-Marne URL drifts. Rock Mechanics and Rock Engineering 2013., http://dx.doi.org/10.1007/s00603-12-0339-6[online].
Bauer C, Pépin G, Lebon P. EDZ in the performance assessment of the Meuse/Haute-Marne site: conceptual model used and questions addressed to the research. In: Proceedings of the EC cluster conference on impact of the EDZ on the performance of radioactive waste geological disposal; 2003.
Bernier F, Li XL, Verstricht J, Barnichon JD, Labiouse V, Bastiaens W, et al. CLIPEX report EUR 20619. Luxembourg: Commission of the European Communities; 2002.
Blümling P, Bernier F, Lebon P, Martin CD. The excavation damaged zone in clay formations time-dependent behavior and in fluence on performance assessment. Physics and Chemistry of the Earth, Parts A/B/C 2007;32(8–14):588–99.
Bonnet-Eymard T, Ceccaldi F, Richard L. Extension of the Andra underground laboratory: methods and equipment used for dry, dust-free works. In: Proceedings of world tunnel congress 2011; 2011.
Bossart P, Meier PM, Moeri A, Trick T, Mayor JC. Geological and hydraulic characterization of the excavation disturbed zone in the Opalinus clay of the Mont Terri. Engineering Geology 2002;66(1/2):19–38.
Delay J, Vinsot A, Krieguer JM, Rebours H, Armand G. Making of the underground scientific experimental programme at the Meuse/Haute Marne URL, North Eastern France. Physics and Chemistry of the Earth, Parts A/B/C 2007;32(1–7):2–18.
Gasc-Barbier M, Chanchole S, Bérest P. Creep behaviour of Bure clayey rock. Applied Clay Science 2004;26(1–4):449–58.
Martin F, Laviguerie R, Armand G. Geotechnical feedback of the new galleries excavation at the ANDRA underground research laboratory – Bure (France). Laussanne: Eurock; 2010.
Noiret A, Armand G, Cruchaudet M, Conil N. Mine-by experiments in order to study the hydromechanical behavior of the Callovo-Oxfordian claystone at the Meuse Haute-Marne underground research laboratory (France). In: Proceeding of 8th international symposium on field measurements in geomechanics, FMGM 2011; 2011. p. 12–6.
Read RS, Martin CD. Technical summary of AECL’s mine-by experiment. AECL-11311 AECL research (Series). Pinawa, Manitoba: Whiteshell Laboratories; 1996. p. 169.
Souley M, Armand G, Su K, Ghoreychi M. Modelling of the viscoplastic behaviour including damage for deep argillaceous rocks. Physics and Chemistry of the Earth 2011;36:1949–59.
Wileveau Y, Cornet FH, Desroches J, Blumling P. Complete in situ stress determination in an argillite sedimentary formation. Physics and Chemistry of the Earth 2007;32(8–14):866–78.
Zhang CL, Czaikowski O, Rothfuchs T. Thermo-hydro-mechanical behavior of the Callovo-Oxfordian clay rock, GRS-266. Germany: GRS; 2010.

Gilles Armand has a background in mechanic and civil engineering (M.Sc. at Institut Polytechnic of Grenoble, France). In 2000, he got a Ph.D. at Joseph Fourier University (Grenoble, France) on rock joint behavior (experimental and constitutive modeling). After post-doctoral fellowship at McGill University (Canada) and at IRSN (France), he joined the French Radioactive Waste Management Agency (ANDRA) as research engineer in charge of field experiments in geomechanics at the Meuse/Haute-Marne Underground Research Laboratory. In 2009, he became manager of the Fluid and Solid Mechanics Department at R&D department of ANDRA. His main research fields are: excavation damaged zone (EDZ) characterization and modeling, hydro-mechanical and creep behavior of claystone, THM behavior, design of support, seal for radioactive waste repository.
∗Corresponding author. Tel.: +33 329756753.
E-mail address: gilles.armand@andra.fr (G. Armand).
Peer review under responsibility ofinstitute of Rock and Soil Mechanics, Chinese Academy of Sciences.
1674-7755 © 2013 Institute of Rock and Soil Mechanics, Chinese Academy of Sciences. Production and hosting by Elsevier B.V. All rights reserved.
http://dx.doi.org/10.1016/j.jrmge.2013.05.005
 Journal of Rock Mechanics and Geotechnical Engineering2013年3期
- Journal of Rock Mechanics and Geotechnical Engineering的其它文章
- Millau viaduct geotechnical studies and foundations
- TIMODAZ: A successful international cooperation project to investigate the thermal impact on the EDZ around a radioactive waste disposal in clay host rocks
- Sealing of fractures in claystone
- Joints in unsaturated rocks: Thermo-hydro-mechanical formulation and constitutive behaviour
- Homogenization in clay barriers and seals: Two case studies
- On the thermal impact on the excavation damaged zone around deep radioactive waste disposal