
Joints in unsaturated rocks: Thermo-hydro-mechanical formulation and constitutive behaviour
2013-06-05 14:54AlonsoZandarOlivella
E.E. Alonso, M.T. Zandarín, S. Olivella
Department of Geotechnical Engineering and Geosciences, UPC, Barcelona 08034, Spain
Joints in unsaturated rocks: Thermo-hydro-mechanical formulation and constitutive behaviour
E.E. Alonso∗, M.T. Zandarín, S. Olivella
Department of Geotechnical Engineering and Geosciences, UPC, Barcelona 08034, Spain
ARTICLE INFO
Article history:
Received 26 March 2013
Received in revised form 5 May 2013
Accepted 16 May 2013
Rock joints
Thermo-hydro-mechanical (THM) behaviour
Finite elements
Suction controlled shear tests
Constitutive model
Numerical simulations
A formulation for the coupled analysis of thermo-hydro-mechanical (THM) problems in joints is first presented. The work involves the establishment of equilibrium and mass and energy balance equations. Balance equations were formulated taking into account two phases: water and air. The joint element developed was implemented in a general purpose finite element computer code for THM analysis of porous media (Code Bright). The program was then used to study a number of cases ranging from laboratory tests to large scale in situ tests. A numerical simulation of coupled hydraulic shear tests of rough granite joints is first presented. The tests as well as the model show the coupling between permeability and the deformation of the joints. The experimental investigation was focused on the effects of suction on the mechanical behaviour of rock joints. Laboratory tests were performed in a direct shear cell equipped with suction control. Suction was imposed using a vapour forced convection circuit connected to the cell and controlled by an air pump. Artificial joints of Lilla claystone were prepared. Joint roughness of varying intensity was created by carving the surfaces in contact in such a manner that rock ridges of different tip angles were formed. These angles ranged from 0°(smooth joint) to 45°(very rough joint profile). The geometric profiles of the two surfaces in contact were initially positioned in a “matching” situation. Several tests were performed for different values of suctions (200, 100, and 20 MPa) and for different values of vertical stresses (30, 60, and 150 kPa). A constitutive model including the effects of suction and joint roughness is proposed to simulate the unsaturated behaviour of rock joints. The new constitutive law was incorporated in the code and experimental results were numerically simulated.
© 2013 Institute of Rock and Soil Mechanics, Chinese Academy of Sciences. Production and hosting by Elsevier B.V. All rights reserved.
1. Introduction
Discontinuities of the rock mass are the result of the origin of the rock and the subsequent deformations imposed, in most cases, by tectonic activity. According to Jennings and Robertson (1969), two sets of discontinuities could be typically defined as major and minor or secondary. Major discontinuities include bedding planes, faults, contacts and dykes, while the minor ones are joints of limited length, i.e. cross joints in sedimentary rocks.
Taking into account their origin, joints can be classified as: (1) bedding planes, which are associated with sedimentary rocksand appear when there is a change in the characteristics of the deposited materials; (2) stress relief joints, which develop as a result of erosion of weathered rock; (3) tension joints, which are the result of cooling and crystallization ofigneous rock; and (4) faults, which result in a plane or band of shear failure that exhibits obvious signs of differential movement of the rock mass on each side of the central plane as well as rock degradation. Usually, faults are linked to the movement of tectonic plates.
The characteristics of the planar surfaces constituting a joint depend on the geological history of the rock mass. They are the result of mechanical, hydraulic, depositional, chemical and other processes. The void structure of discontinuities has a dominant effect on its hydro-mechanical (HM) behaviour.
Finite element formulations describing joint behaviour started in the pioneering contribution of Goodman et al. (1968). Since then, published formulations have steadily improved the capabilities of the joint models. In particular, attention is given here to the coupled hydraulic and mechanical behaviour of joints. Recent contributions were published by Guiducci et al. (2002) and Segura (2008).
The HM behaviour under varying normal stress has been extensively studied. The experimental results obtained by Hans (2002) show that transmissivity decreased as normal stress increased. Thisdecrease is due to the reduction of the void space between the joint walls, the increase of the contact area and the changes in tortuosity. When the compression stress on the discontinuity is released, an irreversible behaviour can be observed.
When a shear stress is applied, before the peak conditions are attained, transmissivity initially decreases. However when peak conditions are met, transmissivity increases substantially (approximately two orders of magnitude). The increment of transmissivity is directly related to joint dilatancy (Lee and Cho, 2002). Even if dilatancy increases continuously with relative shear displacements, joint permeability may reach a constant value. This is a consequence of the gouge material generated by the breakage of asperities. The roughness degradation depends on the strength of asperities, the applied normal load and the shear stiffness. Olsson and Barton (2001) described this behaviour and proposed a model to consider these phenomena. Indraratna et al. (2003) reported an analytical and experimental study of the two-phase flow through rock joints.
Taking these results as a starting point, a finite element formulation for the coupled thermo-hydro-mechanical (THM) behaviour of joint elements has been developed. It considers a two-phase (air and water) flow and vapour diffusivity through joints. A further motivation for this work was related to the conditions found in nuclear waste disposal designs. Bentonite barriers, initially unsaturated, exhibit strong suctions at early phases. The heat generation imposed by nuclear canisters results in a drying of the engineered barrier that is also subjected to inflow from the host rock. In the long term, the gas generated in the waste may escape through interfaces and rock joints, a phenomenon which depends on gas generation rates. The set of conditions outlined imply that artificial joints (those existing between engineered barriers and excavated rock surface, for instance) and natural rock joints may be exposed to partially saturated conditions.
Finally, joints above an existing water level or exposed to ambient conditions are involved in slope stability and excavations.
It was then natural to attempt a generalized formulation of joint behaviour for partially saturated conditions. This is achieved by providing a separate consideration to water and air transfer. In addition, since heat transfer is also involved in some applications (notably nuclear waste disposal), an energy balance was added to the field equations.
The effect of suction on the mechanical behaviour of rock joints has not been reported in the literature to the authors’ knowledge. Since the prevailing suction has a very significant effect on rock strength (Oldecop and Alonso, 2001), it was anticipated that rock joint behaviour would be also significantly affected. This was the motivation for the performance of a laboratory testing program concentrated on the mechanical behaviour of rock joints subjected to direct shear under suction control. Suction was controlled by a vapour equilibrium technique (Fredlund and Rahardjo, 1993; Romero, 2001). Artificially prepared joints of Lilla claystone were tested. Joint roughness of varying intensity was created by carving the surfaces in contact in such a manner that rock ridges of different tip angles were formed. These angles varied between 0°(smooth joint) and 45°(very rough joint profile). The geometric profiles of the two surfaces in contact were initially positioned in a “matching” situation. Several tests were performed for different values of suctions (200, 100, and 20 MPa) and for different values of vertical stresses (30, 60, and 150 kPa). From the analysis of test results, a constitutive law was proposed. It takes into account the effect of suction on the strength parameters and the degradation of rock joints. The performance of the model was checked against the recorded shear stress-relative displacements.
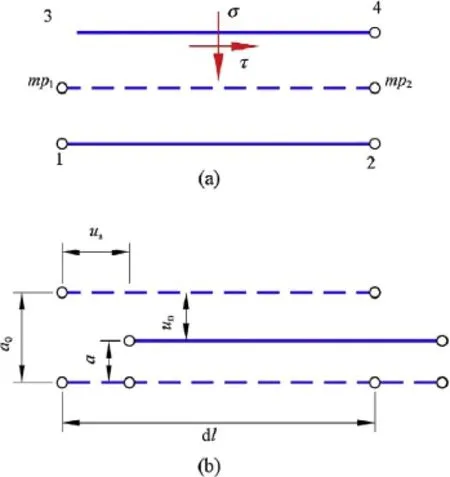
Fig. 1. Joint element with double nodes. (a) Stress state at the mid-plane of the joint element. (b) Relative displacement defined at mid-plane.
2. A coupled thermo-hydro-mechanical formulation of joints
2.1. Mechanical formulation
The mechanical formulation of the joint element is defined by the relationship between stress and relative displacements of the joint element mid-plane (Fig. 1). Then, the mid-plane relative displacements are interpolated using the nodal displacements and the shape functions:

where unand usare the normal and tangential relative displacements of the element’s mid-plane (see Fig. 1), respectively; r is the rotation matrix that transforms the relative displacements in the local orthogonal coordinate system into the global coordinate system;is a matrix of shape functions; I4is a identity matrix of 4th order; and ujis the vector of nodal displacements.The stress tensor of the mid-plane is calculated as
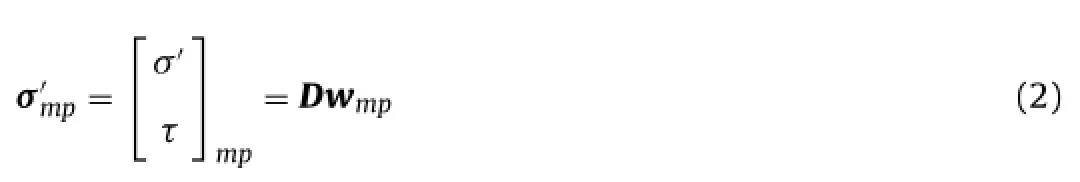
where τ is the tangential stress at mid-plane; σ'is the normal effective stress; D is the stiffness matrix, which relates relative displacements, defined by vector wmp, to stress state (see Fig. 1); andis the net effective stress at the mid-plane of the element and it is defined as

where σmpis the total mean stress, pgmpis the gas pressure, and plmpis the liquid pressure in the mid-plane of the element.
Note that the mechanical response is defined in terms of a net stress (excess of total stress over air pressure) when the joint isnot saturated. Once saturated, the definition adopted for effective stress results in Terzaghi’s principle.

Fig. 2. (a) Schematic view of the mass balance of joint element; (b) transversal fluxes; (c) longitudinal fluxes.
2.2. Mass and energy balance equation
The two-phase flow through a single joint is analyzed by formulating the water, air and energy balance equations at the mid-plane of the element. The fluxes at mid-plane are calculated by interpolating the leak-off at the element boundaries (see Fig. 2).
2.2.1. Water mass balance equation
The water mass balance equation for a differential volume of joint is
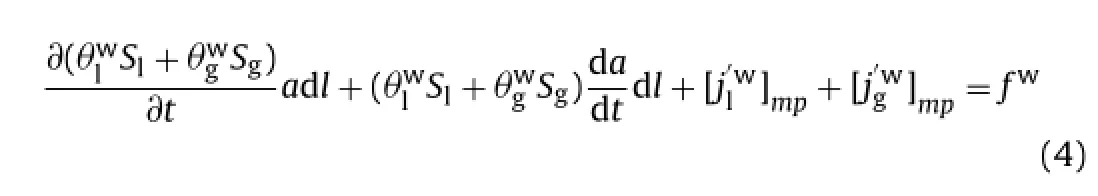
The fluxes at mid-plane are calculated by

where qlt, qgt, qlland qglare the advective (liquid or gas) transversal and longitudinal fluxes at the element boundaries, respectively; andarethenonadvective(liquidorgas),transver- sal, and longitudinal fluxes at the element boundaries (Fig. 2a), respectively. The first term of Eq. (5) corresponds to the transversal fluxes at mid-plane of the joint (calculated by means of the pressure drop between surfaces, pmp1= p3− p1and pmp2= p4− p2) (Fig. 2b). The second term corresponds to the longitudinal fluxes at mid-plane calculated considering the average pressure in nodes (pmp1= p3+ p1/2 and pmp2= p4+ p2/2; Fig. 2c).
2.2.2. Air mass balance equation
The air mass balance equation considers the dry air and the air dissolved in the water phase. Its expression is

2.2.3. Internal energy balance for the element
The internal energy balance for the element is expressed by
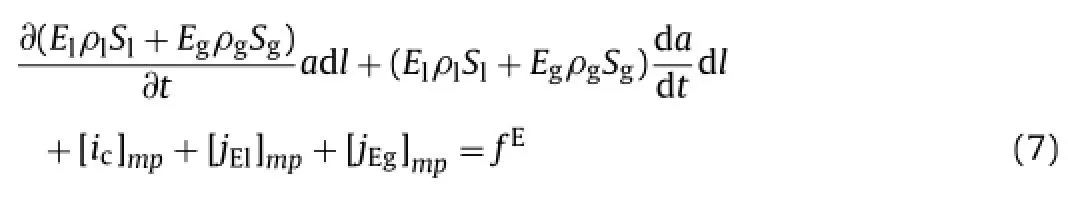
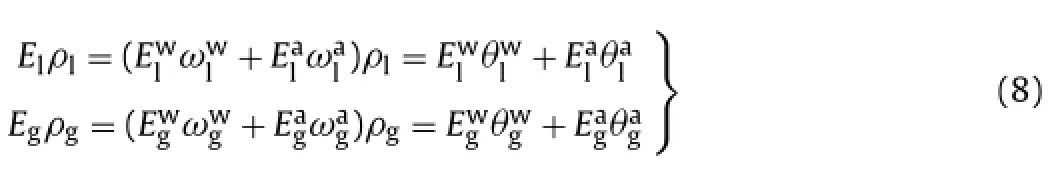
The energies of the liquid and gas phases are calculated by
The conduction of heat [ic]mpat mid-plane of joint is calculated by

where ictis the transversal heat flux, and iclis the longitudinal heat flux at the element boundaries.
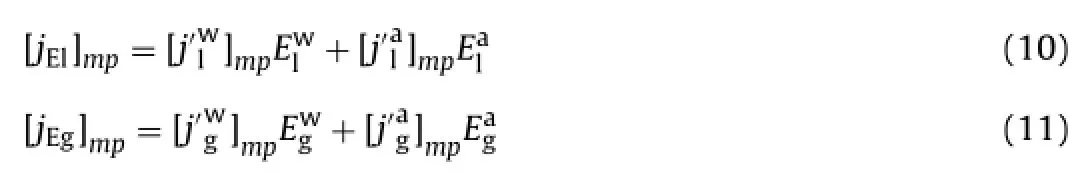
The energy fluxes [jE1]mpand [jEg]mpare calculated considering the advective fluxes:
The weighted residual method is applied to obtain the discrete form of equations. Finally, Eqs. (2), (4), (6), (7) are solved simultaneously. The vector of unknowns for each node includes the normal and shear relative displacements (un, us), the gas and liquid pressures (Pg, Pl) and the temperature (T).
2.3. Constitutive models
The mechanical response of the joint was modelled by means of nonlinear elasto-viscoplastic formulation. The viscoplastic approach provides numerical advantages (there is no need to use return algorithm in particular).
Darcy’s law describes the advective flow for longitudinal directions. A flow proportional to the pressure drop is used in transversal direction. The non-advective fluxes (vapour diffusivity) were modelled by Fick’s law. The longitudinal permeability and the air entry pressure of the joint depend on its opening. Finally, the heat conduction through the joint is calculated by Fourier’s law.
2.3.1. Mechanical model based on elasto-viscoplastic formulation
The elastic formulation proposed describes the elastic normal stiffness by means of a nonlinear law which depends on the joint opening (Gens et al., 1990).
The viscoplastic formulation (Perzyna, 1963; Zienkiewicz and Cormeau, 1974) allows the treatment of a non-associated plasticity and a softening behaviour of joints subjected to shear displacements.
Total displacements w are calculated by adding reversible elastic displacements, we, and viscoplastic displacements wvp, which are zero when stresses are below a threshold value (the yield surface):

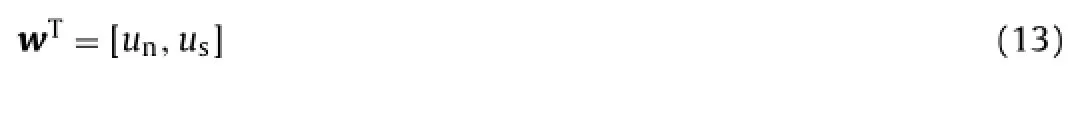
Normal and shear (relative) displacements are represented by a two-element vector [un, us] in the two-dimensional (2D) case:
2.3.1.1. Elastic behaviour. The elastic behaviour of the joint relates stresses (σ'and τ) to displacements (unand us) through the normal (Kn) and tangential stiffness (Ks), respectively. Normal stiffness depends on the opening of the joint, as indicated in Fig. 3 and in the following equations:
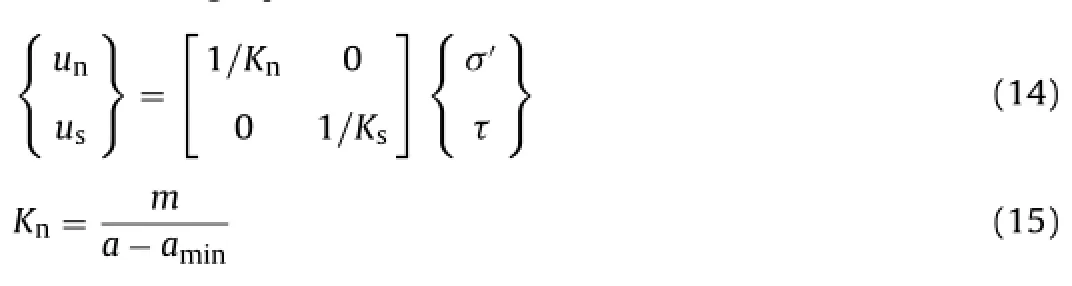
where m is a parameter of the model; a is the opening of the element and aminis the minimum opening of the element (at this opening, the element is closed; see Fig. 3).
2.3.1.2. Viscoplastic behaviour. The viscoplastic behaviour of the joint was developed taking into account the formulations proposed by Gens et al. (1990) and Carol et al. (1997) for rock joints. According to these theories, it is necessary to define a yield surface, a plastic potential and a softening law.
Viscoplastic displacements occur when the stress state of the joint reaches a yielding condition. This condition depends on a previously defined yield surface. In this study a hyperbolic yield surface (Fig. 4) based on Gens et al. (1990) was adopted:
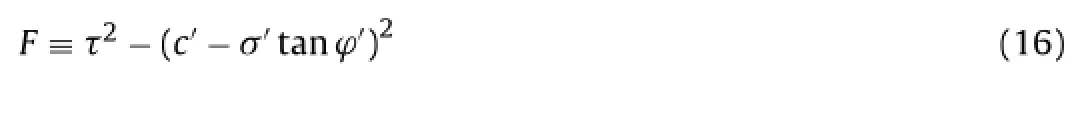
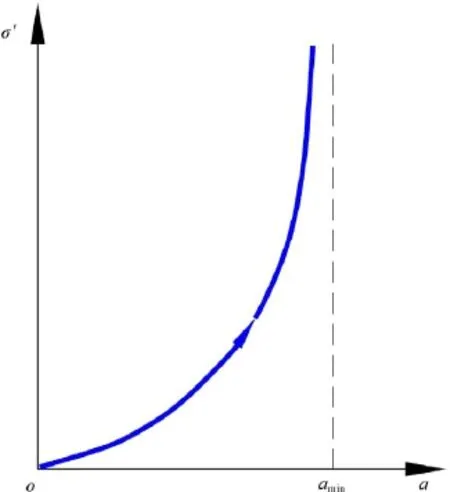
Fig. 3. Elastic constitutive law of the joint element. Normal stiffness depends on joint opening.
where c'is the effective cohesion and tanφ'is the tangent ofinternal friction angle. Note that cohesion and friction angle are defined for the asymptote of the hyperbolic yield function.
Variation of these parameters results in a family of yield surfaces (Fig. 4a).
2.3.1.3. Softening law. The strain-softening of the joint subjected to shear stress is modelled by means of the degradation of the strength parameters. The degradation of parameters c'and tanφ'depends linearly on viscoplastic relative shear displacements. This is based on the slip weakening model introduced by Palmer and Rice (1973). In this way the cohesion decays from the initial valueto zero and the tangent of friction angle decays from the peak (intact material) to the residual value as a function of a critical viscoplastic shear displacements (u*). Two different values of u*are used to define the decrease of cohesion () and friction angle () (see Fig. 4b and c). The mathematical expressions are

where c'is the effective cohesion which corresponds to the viscoplastic shear displacement,is the initial value of the effective cohesion, andis the critical value of shear displacement for which the value of c'is zero. Also,
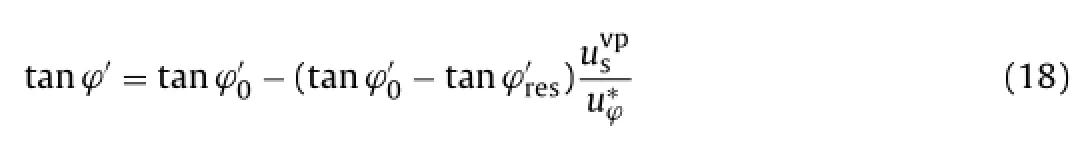
where tanφ'corresponds to viscoplastic shear displacement uvp s, tanis the tangent of the peak friction angle, tanis the tangent of the internal friction effective residual angle, andis the critical value of shear displacement when the value of tanφ'is equal to tan
2.3.1.4. Viscoplastic displacements. If F < 0, the stress state of the joint element is inside the elastic region; if F ≥ 0, the displacementsof the joint element have a viscoplastic component. The viscoplastic displacements are calculated by
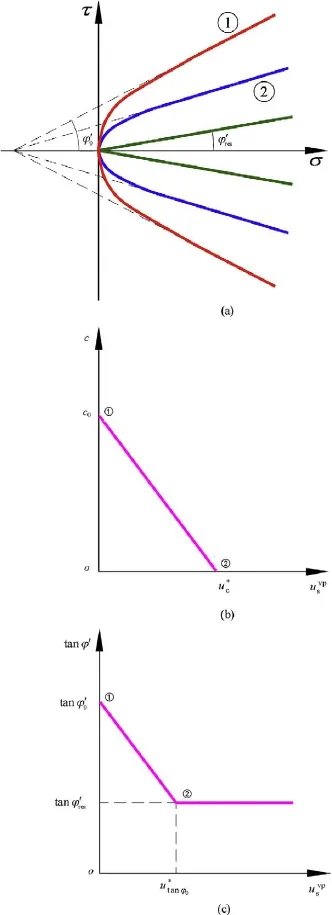
Fig. 4. (a) Evolution of the failure surface due to softening of the strength parameters. (b) Softening law for cohesion. (c) Softening and law for tanφ'.
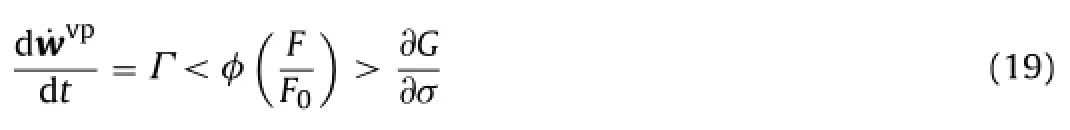
where G is a plastic potential, and Γ is a viscosity parameter. In order to ensure that there is no viscoplastic flow inside the yield locus, the following consistency conditions should be met:

where F0can be any convenient value of F to render the above expressions non-dimensional. In this study F0= 1.
The normal and shear viscoplastic displacement rates,and, are given by a power law:

where N is the exponent of the power law.
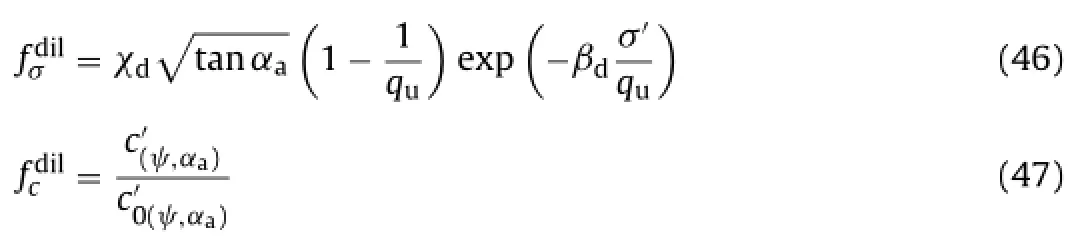
2.3.1.5. Plastic potential surface and dilatancy. The associated rule allows the calculation of displacements directions. The derivative ofGwithrespecttostressesincludestheparametersandwhich take into account the dilatant behaviour of the joint under shear stresses (López, 1999):


where quis the compression strength of the material for which dilatancy vanishes, βdis a model parameter, and c'is the cohesion value for the viscoplastic shear displacement(Fig. 4b).
2.3.2. Hydraulic model
The transversal advective flux flow through the joint is calculated by means of a transversal intrinsic permeability and the pressure drop between joint surfaces (Segura, 2008). Furthermore, the longitudinal advective flow is calculated using a longitudinal intrinsic permeability and a generalized Darcy’s law. Therefore, it is necessary to define the longitudinal and transversal intrinsic permeabilities of joints. Likewise, in the case of joints under unsaturated conditions, the water retention curve should be specified.
2.3.2.1. Advective fluxes. The transversal flux is calculated as

where kltis the transversal intrinsic permeability for the liquid, krltis the transversal relative permeability for the liquid, μlis the dynamic viscosity of the liquids andis the pressure drop between the two surfaces of the joint element.
The generalized Darcy’s law for the longitudinal flow reads:

where kllis the longitudinal intrinsic permeability for the liquid, krllis the longitudinal relative permeability for the liquid, g is the gravity vector, and pmpis the liquid pressure in the mid-plane.
2.3.2.2. Non-advective fluxes (vapour diffusivity). The nonadvective flux (vapour diffusivity) is calculated by means of Fick’s law:

2.3.2.3. Intrinsic permeability. The longitudinal fluid flow has been analyzed as a laminar flow between two smooth and parallel plates separated a given hydraulic opening (e). Based on this hypothesis, the longitudinal hydraulic conductivity of the joint is calculated by means of cubic law:
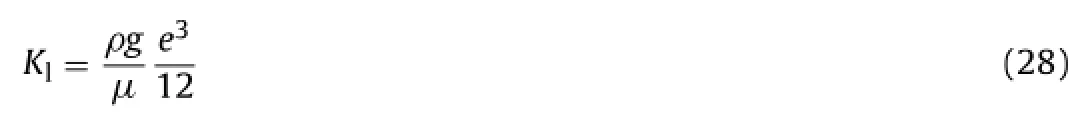
where ρ is the fluid density, g is the gravity, and μ is the fluid viscosity.
Then the equation ofintrinsic permeability is given by
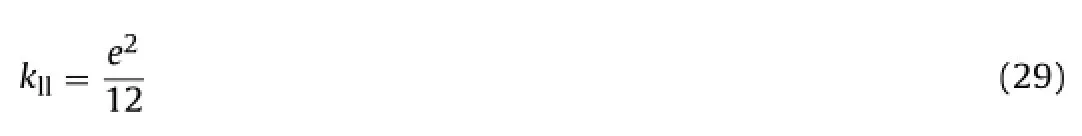
The hydraulic opening (e) of joints will be related to its geometrical aperture (a) and to the roughness of joint surfaces (JRC) by means of the law proposed by Barton et al. (1985). Substituting in Barton’s expression (Eq. (29)), the longitudinal intrinsic permeability can be expressed as

The transversal intrinsic permeability kltis considered equal to the value for the continuum media.
2.3.2.4. Water retention curve. The degree of saturation of joints is calculated using the standard retention curve proposed by van Genuchten Th (1980):
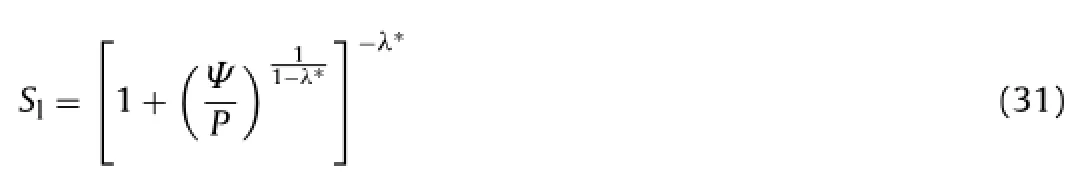
where Ψ = Pg− Plis the current suction, where Pgand Plare the gas and liquid pressures, respectively; λ*is a model parameter; and P is the air entry pressure necessary to desaturate the joints.
The air entry pressure of a joint depends on the hydraulic opening as suggested by Olivella and Alonso (2008). If the Laplace expression for P is combined with Eq. (29), the equation for the air entry pressure for a given opening is obtained in terms of the intrinsic permeability for the reference state (k10) and the current value (k1):
Also, P is scaled with surface tension, σ, if temperature effects are considered:

2.3.2.5. Relative permeability. The relative permeability is calculated by

where A = 1.0 and n = 3 in cases analyzed here.
2.3.2.6. Thermal model. The heat conduction is given by Fourier’s law:

where λ is the thermal conductivity, and ▽T is the temperature gradient.
The thermal conductivity is made dependant on the degree of saturation of the joint as follows:

where λsatis the thermal conductivity of the water saturated joint, and λdryis the thermal conductivity of the dry joint.
3. Discretization of equations of stress equilibrium, mass and energy balance
The discrete form of stress equilibrium relations can be directly established for the joint element. Then, the integration to average the residuals provides
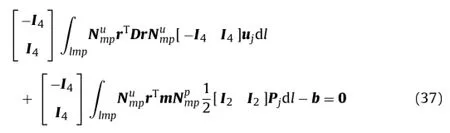
where b is the vector of the external body forces, m is the unit vector, and Pjis the vector of nodal fluid pressures.
In order to describe the numerical treatment of mass and energy balance equations, the water mass balance equation is used as an example. Only terms describing water vapour transfer will be considered. For the remaining mass and energy balance equations, the treatment is identical (see also Olivella et al., 1995).
The weighted residual method is applied to obtain the discrete form of balance equations. The discrete forms of the terms of the equations are given as follows:
(1) Storage changes of mass or energy at constant joint opening are written as

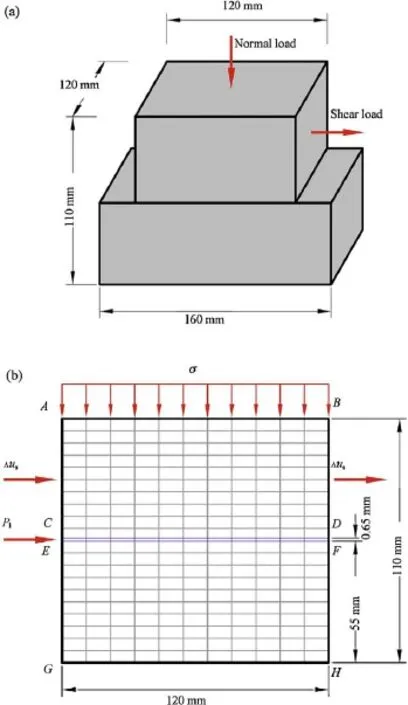
Fig. 5. (a) Joint specimens of Hwangdeung granite. (b) Discretized geometry and boundary conditions used for the hydro-mechanical simulation of the test performed by Lee and Cho (2002).
(2) Storage change induced by changes of joint opening can be written as
(3) For advective fluxes, the nodal liquid pressures Pljare differentiated to provide the mid-plane values of the joint pressure drop:

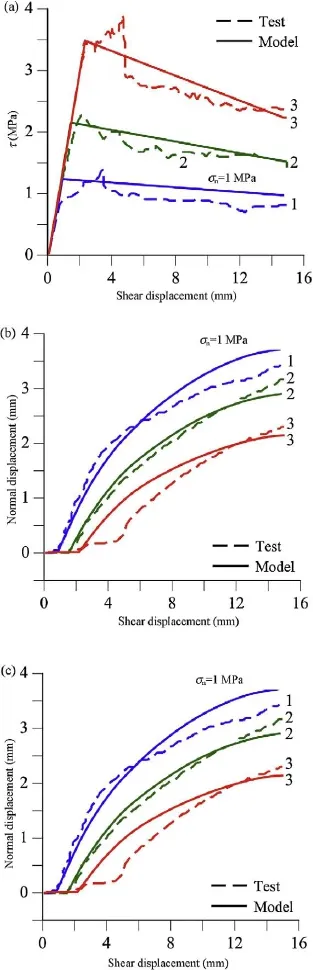
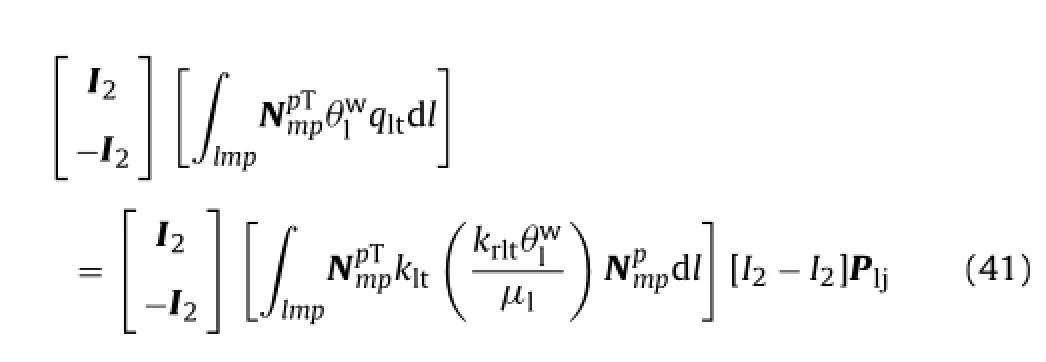
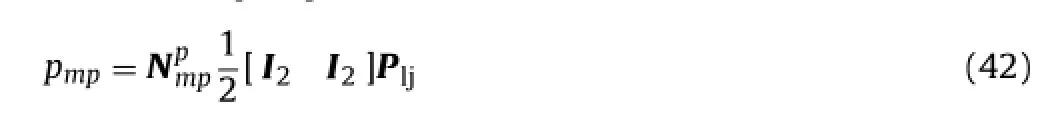
Fig. 6. Comparison between experimental results obtained by Lee and Cho (2002), and results from numerical simulations. (a) Shear stress-shear displacement curves; (b) normal displacement vs. shear displacement, and (c) intrinsic permeability vs. shear displacement.
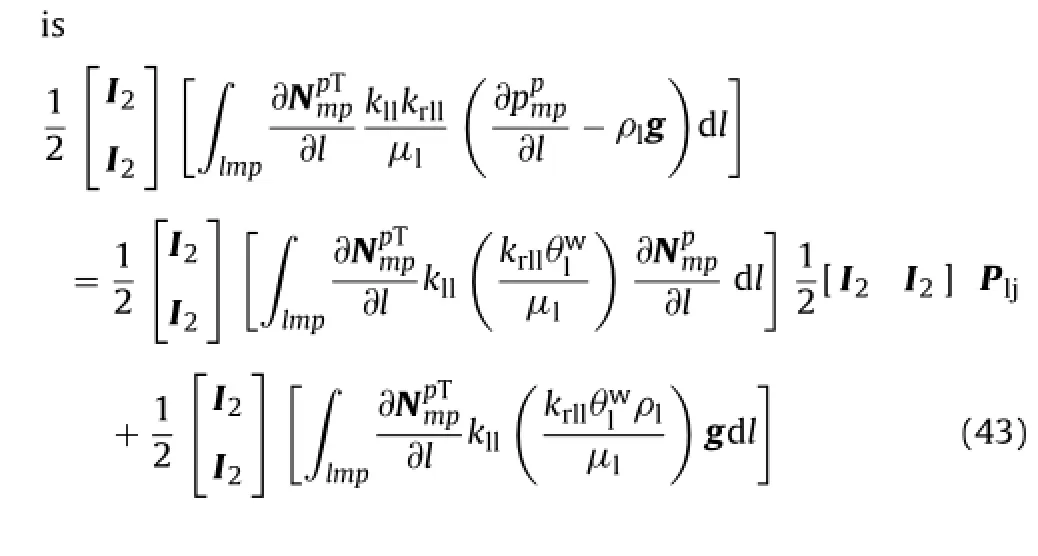
(4) The discretized expression for the transversal advective flux is
(5) The liquid pressure at the mid-plane is calculated by averaging the nodal liquid pressures:
(6) The discretized expression for the longitudinal advective flux
The discretized equations for the non-advective fluxes and heat conduction are analogous to the equations for advective fluxes given above.
4. Numerical simulation of a hydraulic shear test on rough granite surfaces
The hydraulic shear tests selected to check the capabilities of the model were performed on granitic rock from Korea (Lee and Cho, 2002). An intact rock block was sawed to obtain samples with a length of 160 mm and equal values of width and height (120 mm) (Fig. 5a). The fracture surfaces were created by means of a tensile fracture exerted by a splitter. The fracture opening was measured using a 3D (three-dimensional) laser profilometer. The mean value of the opening was 0.65 mm.
Shear hydraulic tests were performed maintaining constant normal stresses of 1, 2 and 3 MPa. The tangential displacement was applied at a rate of 0.05–0.08 mm/s. The hydraulic pressure applied to the joint varied from 4.91 kPa to 19.64 kPa. For each stage of shear displacement of about 1 mm, hydraulic pressure was kept constant. When the fluid flow reached a steady state, the mean flow rate was calculated recording the amount of outflow measured for a period of 2 min. These measurements were also used to calculate the permeability of the joint.
The shear behaviour of the rock joint is shown in Fig. 6a and b. The results obtained are characterized by a peak shear strength and a pronounced dilation that greatly affected the hydraulic behaviour of the rough fractures. Dilatancy increases rapidly before shear stress reaches its peak value. Then, dilatancy increases at a lower rate during the shear stress drop to reach residual values.
The permeability changes with respect to the increments of shear displacements are plotted in Fig. 6c. The fracture permeability changes slightly during the initial stage of shear loading. But, as dilation occurs close to the peak strength, permeability increases dramatically, about 2 orders of magnitude. When shear displacements reach 7 mm, permeability becomes constant.

Table 1Hydro-mechanical parameters of granite matrix and joint used in the numerical model.
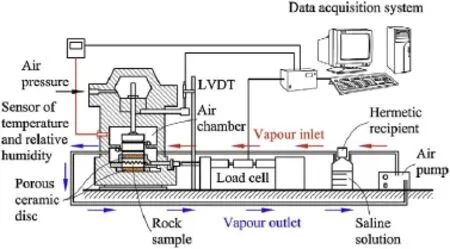
Fig. 7. Scheme of the direct shear device.
4.1. Geometry and material parameters of the model
The tests described above were modelled using the coupled hydro-mechanical formulation described before, implemented into the finite element program Code Bright (DIT-UPC, 2000). The model is 120 mm high and 110 mm wide (Fig. 5b). The rock matrix was discretized using 200 quadrilateral continuum elements having 4 nodes, and the joint was discretized by means of 10 joint elements. The normal stress is applied at the boundary AB, while shear displacements are applied at boundaries AC and BD. Boundaries EG and FH are horizontally fixed and GH is vertically fixed. The water injection pressure (Pl) on the joint was applied at boundary CE, while at boundary DF a drainage boundary condition was considered. The pressure at boundary CE was increased when the shear displacement increased 1 mm, as done in the real test. The joint is considered to be saturated (Sl= 1) during the test.

Fig. 8. Example of carved rock joint.

Fig. 9. Comparison of shear stress vs. shear displacements and normal displacements vs. shear displacements for experimental tests and simulation results (αa= 15°).
A linear elastic constitutive law was used to simulate the mechanical behaviour of the rock matrix and the intrinsic permeability was considered constant during the test. The parameters adopted for the granite matrix are summarized in Table 1.
The mechanical behaviour for the rock joint was modelled using the elasto-viscoplastic constitutive laws described before. The longitudinal permeability changes during the test according to the joint opening. The parameters for rock joint are indicated in Table 2.
4.2. Numerical results against test data
The results obtained from the simulations are compared with the tests results in Fig. 6. The mechanical behaviour of the joint is closely reproduced by the model. The numerical formulation is able to reproduce the increment of peak shear stress with normal stresses. Also, it is possible to capture how the shear strengthdecreases with displacements. Fig. 6b also compares the measured and calculated dilatancy of the joint.

Table 2Hydro-mechanical parameters of the joint model used in calculations.
The evolution of the intrinsic permeability of the joints is also simulated. Even though the permeability in the model increases continuously with dilatancy, the permeability measured in the test for different normal stresses became constant and was independent of normal stress. This is mainly caused by the gouge materials generated from the degradation of asperities during shearing. This phenomenon is not considered in the model (Fig. 6c).
5. Direct shear tests on rock joints with suction control
A suction-controlled direct shear cell using the principle of axis translation (Escario and Saez, 1986) was modified and updated to perform the tests reported here (Fig. 7).
The air overpressure chamber was connected to a vapour circulation system with the objective of controlling the relative humidity (RH) of the sample. Sensors were installed to measure the temperature and RH of the air within the chamber. A modern data acquisition system was attached to the cell and a digital program was developed, using LabVIEW programming language, for data acquisition.
The rock tested (Lilla claystone) is a sulphate-bearing argillaceous rock located in the Lower Ebro Basin, in the northeast of Spain. The characterization of the rock was taken from previous works performed by Garcia-Castellanos et al. (2003), Berdugo (2007), Tarragó (2005), and Pineda et al. (2010). These sulphated rocks formed during the Tertiary Period range from Early Eocene to Late Miocene in age. The clay matrix has a low plasticity. The porosity varies from 0.09 to 0.11. The Young’s modulus E0varies from 26.5 GPa to 28.5 GPa and the shear stiffness G0varies from 11 GPa to 12.5 GPa.
The testing methodology consists in: (1) preparing the samples by carving joints with different geometric angles; (2) measuring the profile of the joint wall surface; (3) applying a wetting or a drying cycle on the samples using vapour equilibrium technique; (4) performing the direct shear test with suction control; and (5) measuring the profile of the joints surface after the test. The samples were extracted from a borehole core of Lilla claystone drilled from the floor of Lilla tunnel. The core had 110 mm in diameter and a length of 1 m. The core was cut into pieces with a nominal length of 50 mm. Then, these pieces were drilled and cut in a machine to obtain samples 50 mm in diameter and 12 mm in height. Finally, the joints were carved with a diamond drill in order to create regular geometric asperities having “opening” angles of 0°, 5°, 15°, 30°, and 45°, respectively. The intention was to test different asperity roughnesses. Fig. 8 shows one of the rock joints tested. To obtain the topographical data of rock fracture surfaces, 2D laser-scanning profiles of both sides of joints were measured before and after the shear test.
Prior to shearing, each sample was equilibrated at the required suction. Samples were placed in a desiccator with a solution, whose concentration is known, at a constant temperature of 20°C. The equilibrium was considered complete when there was no measurable change in the weight of samples. Samples weights were measured and the total suction was measured on small samples of rock using a dew-point psychrometer. A small sample of rock was placed in the desiccator together with the joints samples and its suction was used as a standard average value. It was assumed that the suction measured with the psychrometer is the suction of the joint. Samples reached the equalization stage after a period of fifteen days.

Fig. 10. Relationship between Wg/Wiand total work.
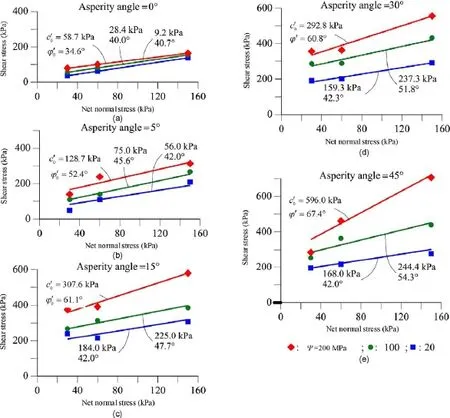
Fig. 11. Peak shear stresses vs. net normal stresses for different values of αa. The associated parameters of the yield surface are also given.
Once equilibrated at a given suction, samples were transferred to the shear cell and the vapour control system was put into operation. When the RH measured by the sensor reached the constant value of suction required, the test began by applying the vertical load. Three different values of air pressure (net normal stress) were applied: 30, 60, and 150 kPa, respectively. When the vertical displacements induced by the vertical stress remained constant, shear displacements were applied at a rate of 0.05 mm/min. The shear test ended when the shear stress reached its residual value. An example of recorded results for an asperity angle of 15°is given in Fig. 9.
The recorded plots of shear stress versus shear displacement show that the shear strength of joints depends on the three variables, namely normal stress, suction, and joint roughness angle. The effect of the normal stress is well known: the larger the normal stress, the higher the shear strength.
The value of suction imposed also affects the peak and residual shear strengths. Increasing suction results in higher values of peak shear strength. However, the effect of suction on the residual strength is not seen as clearly as that on the peak strength. Residual strength depends not only on suction, but also on the degradation of the roughness of asperities. Degradation of asperities is influenced by suction and by the irregular matching due to defects of joint construction and the heterogeneity of the rock. This implies the existence of contact areas with higher or lower strength. These phenomena result in some heterogeneity of results.
Increasing the asperity roughness is associated with higher strength. Furthermore, the roughness also affects the strength softening of the joint. In joints with higher roughness, the residual strength is reached for smaller displacements. The flat joint exhibited a ductile behaviour; in these cases, the softening effect is negligible.
It was generally observed that increasing normal stress resulted in lower dilatancy. However this behaviour was not always recorded. This is the case for αa= 15°. It is believed that this anomalous behaviour is due to some irregularity of matching and probably a consequence of the heterogeneity of the rock, which influences the degradation of asperities. The influence of suction on dilatancy is also apparent in plots. Joints equilibrated at low suction (Ψ = 20 MPa, RH = 86%) exhibited the lowest dilatancy.
Suction increases strength. It was observed that the sliding of the joint walls, one over the other, occurs without breakage of asperities when suction is high. Even if breakage occurs at a given suction, it is likely that the gouge material equilibrated at high suctions is capable of rolling on the joint surface. The gouge material at lower suctions is easier to crush without rolling. These phenomena are capable of explaining the recorded effect of suction on strength and dilatancy.
Since the global damage of a rough joint may be a consequence of the work spent in shearing the joint, there was an interest in relating a measure of the joint damage to the irreversible (plastic) work induced by external stress. Joint damage was defined by an index relating the weight of the gouge material (Wg) generated in a sheared joint to the initial weight of the sample tested (Wi). The ratio Wg/Wiis plotted in Fig. 10 against the total work (shear plus volumetric strain). The plot shows that suction is also a controlling factor not fully accounted for by the work. The trend lines plotted inFig. 10 (dash blue, green and red lines) indicate that the degradation of joints increases with the work exerted, in all cases. In addition, the higher is the suction, for a given value of total work, the lower is the joint degradation.
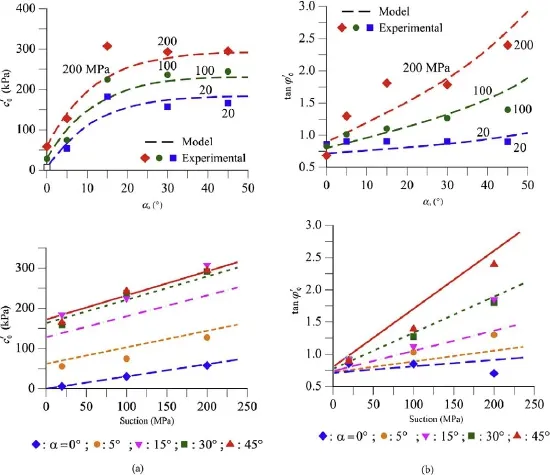
Fig. 12. (a) Effective cohesion vs. αa(above) and effective cohesion vs. suction (below). (b) Effective tangent ofinternal friction angle vs. αa(above) and effective tangent ofinternal friction angle vs. suction (below).
6. Influence of suction and roughness on yield function parameters
A mathematical expression is proposed fortaking into account the effect of suction and asperity roughness angle:


Fig. 12a and b shows the fitting of the experimental values ofand tanwith the equations previously proposed.
7. Numerical simulation of direct shear tests of joints of Lilla claystone
The numerical simulation of the shear stress tests was carried out with the help of Code Bright using the joint element developed and the new mechanical constitutive law proposed before.
Then, the amount of dilatancy depends on the level of the normal stress, on the roughness of the joint surfaces and on the degradation of the interface surface, which varies with suction.
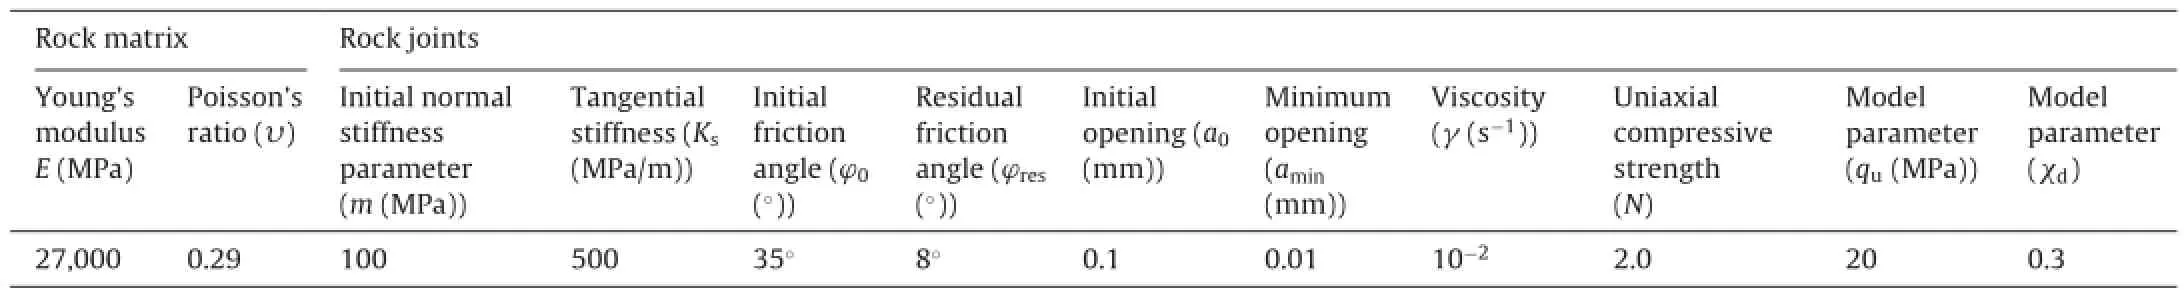
Table 3Material parameters.
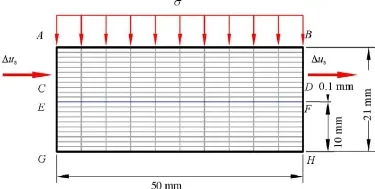
Fig. 13. Finite element mesh geometry used to numerically simulate the experimental results.
The geometry of model is shown in Fig. 13. The rock was assumed to be an elastic material and the joint was modelled as a viscoplastic joint element. The joint is discretized using 10 elements (in red). The rate of displacements used in the test (0.05 mm/min) is applied on boundaries AC and BD. Boundaries EG and FH are horizontally fixed and boundary GH is vertically fixed. The net normal stresses used in the test (30, 60, and 150 kPa) are applied on boundary AB. The initial liquid pressures are −20, −100, and −200 MPa which are the values of the applied suction.
All the simulations were performed with the same parameters, except that the critical values of shear displacements u∗cand u∗φ were changed according to the strength softening of shear stress and dilatancy of the joints. The parameters are listed in Table 3. The predictions of the numerical analysis for an asperity angle of 15°are plotted in Fig. 9.
8. Conclusions
A coupled THM formulation for a joint element was proposed and implemented in the finite element program Code Bright.
A mechanical constitutive law considering the elastic and plastic displacements of the joint is adopted to describe the stressdisplacement behaviour of the joint. In the elastic law, the normal stiffness depends on the evolution of the joint element opening. Plastic behaviour is defined by a hyperbolic yield surface and softening is based on a slip weakening model. The equations theoretically developed were transformed into a viscoplastic formulation.
Darcy’s law was adopted for the longitudinal hydraulic constitutive law. However, the transversal flux is calculated proportional to pressure drop between joint surfaces (Segura, 2008). A retention curve with an air pressure entry dependant on joint aperture (Olivella and Alonso, 2008) is adopted to calculate the degree of saturation of the joint. The vapour diffusivity is calculated by Fick’s law and the heat conduction through the joint is obtained by Fourier’s law.
A numerical simulation of rough rock joints under shear stress subjected to forced flow along the joint was carried out to validate the numerical tool. The comparison between test and numerical results was positive and it was concluded that the formulation is able to reproduce the main characteristics of coupled mechanicalflow joint behaviour. Shear stress softening and dilatancy with shear displacements as well as the increments of permeability with displacement was well captured.
The influence of suction on joint behaviour was also experimentally investigated. It is believed that this is an important issue in applications. No reference of this effect, which was found to be very significant in the rock tested, was found in the literature.
An available direct shear device was successfully modified to test rock joints under controlled RH of the specimens. Modifications included the addition of a vapour circulation system and the improvement of the acquisition data incorporating an analogue data acquisition device.
The carving process adopted to build different asperity angles allowed exploring the roughness effects on the shear strength and the dilatancy of joints.
The shear test results showed the marked dependency of peak shear stress and dilatancy on suction and roughness. The shear strength and dilatancy decrease when suction decreases. However, the dependency of residual strength with suction was not so clear. Comparing the shear strength and dilatancy recorded for different roughnesses, it was noted that greater roughness implied greater shear strength as expected. It was also observed that a rougher asperity results in smaller values of displacements necessary to reach residual strength. In other words, rougher joints are more brittle. This brittle behaviour induces higher damage on the joints surfaces, and this damage extends to the whole joint surfaces. A consequence of this phenomenon is that rougher surfaces exhibit a lower dilatancy.
It was also obtained that the degradation of joints increases with the applied work in all cases. However, the additional effect of suction should be considered an independent contribution. The higher is the suction, for a given value of total work, the lower is the joint degradation.
New mathematical expressions for the strength parameters, the initial effective cohesion (), and the initial effective tangent ofinternal friction angle (tan) of the asymptote of the hyperbolic yield surface are proposed. These expressions consider the effects of suction and asperity roughness on strength parameters. Also, the dilatancy parameters were modified taking into account suction and geometry of joints. Both modifications were introduced in the constitutive law of the interface element implemented in Code Bright.
The numerical simulation performed reproduces in a satisfactory manner the experiments run on rock joints of Lilla claystone.
Barton N, Bandis S, Bakhtar K. Strength, deformation and conductivity coupling of rock joints. International Journal of Rock Mechanics and Mining Science and Geomechanical ABSTRACTs 1985;22(3):121–40.
Berdugo IR. Tunnelling in sulphate-bearing rocks expansive phenomena. Barcelona: Department of Geotechnical Engineering and Geosciences; 2007 [PhD thesis, UPC].
Carol I, Prat P, López CM. A normal/shear cracking model. Application to discrete crack analysis. ASCE Journal of Engineering Mechanics 1997;123(8):765–73.
DIT-UP. C. Code Bright: a 3D program for thermo-hydro-mechanical analysis in geological media. In: User’s guide. Barcelona: Centro Internacional de Métodos Numéricos en Ingeniería (CIMNE); 2000.
Escario V, Saez J. The shear strength of partly saturated soils. Géotechnique 1986;36(3):453–6.
Fredlund DG, Rahardjo H. Soil mechanics for unsaturated soils. New York: Wiley and Sons, Inc; 1993.
Garcia-Castellanos D, Vergés J, Gaspar-Escribano J, Cloetingh S. Interplay between tectonics, climate, and fluvial transport during the Cenozonic evolution of the Ebro Basin (NE Iberia). Journal of Geophysical Research 2003;108 (B7): ETG 8-1-8-18.
Gens A, Carol I, Alonso EE. A constitutive model for rock joints; formulation and numerical implementation. Computers and Geotechnics 1990;9(1–2):3–20.
Goodman RE, Taylor RL, Brekke TL. A model for the mechanics of jointed rock. ASCE Journal of the Soil Mechanics and Foundations Division 1968;94 (SM3): 637–59.
Guiducci C, Pellegrino A, Radu JP, Collin F, Charlier R. Numerical modelling of hydro-mechanical fracture behaviour. In: Pande, Pietruszczak, editors. Numerical models in geomechanis-NUMOG VIII. Lisse: Swets and Zeitlinger; 2002. p. 293–9.
Hans J. Etude expérimental et modélisation numérique multiéchelle du comportamente hydromécanique de répliques de joints rocheux. Université Joseph Fourier: Grenoble; 2002 [Thése de Doctorant].
Indraratna B, Ranjith PG, Price JR, Gale W. Two-phase (air and water) flow through rock joints: analytical and experimental study. Journal of Geotechnical and Geoenvironmental Engineering 2003;129(10):918–28.
Jennings JE, Robertson AM. The stability of slopes cut into natural rock. In: Conference on Soil Mechanics and Foundation Engineering; 1969. p. 585–90.
Lee HS, Cho TF. Hydraulic characteristics of rough fractures in linear flow under normal and shear load. Rock Mechanics and Rock Engineering 2002;35(4):229–318.
López CM. Análisis microestructural de la fractura del hormigón utilizando elementos finitos tipo junta. Aplicación a diferentes hormigones. Barcelona: Department of Geotechnical Engineering and Geosciences; 1999 [PhD thesis, UPC].
Oldecop L, Alonso EE. A model for rock fill compressibility. Géotechnique 2001;51(2):127–39.
Olivella S, Gens A, Carrera J, Alonso EE. Numerical formulation for a simulator (CODE BRIGHT) for the coupled analysis of saline media. Engineering Computations 1995;13(7):87–112.
Olivella S, Alonso EE. Gas flow through clay barriers. Géotechnique 2008;58(3):157–76.
Olsson R, Barton N. An improved model for hydromechanical coupling during shearing of rock joints. International Journal of Rock Mechanics and Mining Sciences 2001;38(3):317–29.
Palmer AC, Rice JR. The growth of slip surfaces in the progressive failure of over-consolidated clay. Proceedings of the Royal Society of London, Series A, Mathematical and Physical Sciences 1973;332:527–48.
Perzyna P. The constitutive equations for rate sensitive plastic materials. Quarterly of Applied Mathematics 1963;20:321–32.
Pineda JA, De Gracia M, Romero E. Degradation of partially saturated argillaceous rocks: influence on the stability of geotechnical structures. In: Buzzi, Fityus, Sheng, editors. 4th Asia-Pacific conference on unsaturated soils. Taylor and Francis Group; 2010. p. 449–54.
Romero EE. Controlled suction techniques. In: Schnaid G, editor. Proc 4 Simposio Brasileiro de Sols Nao Saturados; 2001. p. 535–42.
Segura JM. Coupled HM analysis using zero-thickness interface elements with double nodes. Barcelona: Department of Geotechnical Engineering and Geosciences; 2008 [PhD Thesis, UPC].
Tarragó D. Degradación mecánica de argilitas sulfatadas y su efecto sobre la expansividad. Barcelona: Universitat Politécnica de Catalunya; 2005 [BSc dissertation].
van Genuchten Th M. A closed-form equation for predicting the hydraulic conductivity of unsaturated soils. Soil Science Society of America Journal 1980;49(9):892–8.
Zienkiewicz OC, Cormeau IC. Visco-plasticity-plasticity and creep in elastic solids-a unified numerical solution approach. International Journal for Numerical Methods in Engineering 1974;8(4):821–45.

E.E. Alonso, born in 1947, got his degree in Civil Engineering (Ingeniero de Caminos, Canales y Puertos) in Madrid in June 1969. He obtained a PhD in Northwestern University in 1973. At present, he is a Professor of Geotechnical Engineering at the UPC in Barcelona. He is the author of more than 300 papers published in Proceedings of Conferences and learned journals. Professional activities include foundation problems, deep excavations, nuclear power plants, slope stability, breakwaters, earth dams, tunnelling and underground waste disposal. Awards: Thomas Telford medal (Institution of Civil Engineers, London – ICE) in 1994 and 2007; J. Torán Prize in 1995; N. Monturiol medal (Barcelona) in 2000; Second Coulomb lecturer (French Committee on Soil Mechanics and Geotechnical Engineering) in 2003, Eleventh Buchanan lecturer (Texas A&M, USA) in 2003, Tenth Sowers lecturer (Georgia Institute of Technology, USA) in 2007, Crampton Prize (ICE) in 2006, Geotechnical Research Medal (ICE) in 2009 and 2010. He is a member of the Royal Academy of Engineering of Spain since 1995 and member of the Royal Academy of Sciences and Art of Barcelona since 2007. He is co-author of the books “Geomechanics of Failures” and “Geomechanics of Failures, Advanced Topics”, published by Springer in 2010.
∗Corresponding author. Tel.: +34 934016862.
E-mail address: eduardo.alonso@upc.edu (E.E. Alonso).
Peer review under responsibility ofinstitute of Rock and Soil Mechanics, Chinese Academy of Sciences.
1674-7755 © 2013 Institute of Rock and Soil Mechanics, Chinese Academy of Sciences. Production and hosting by Elsevier B.V. All rights reserved.
http://dx.doi.org/10.1016/j.jrmge.2013.05.004
 Journal of Rock Mechanics and Geotechnical Engineering2013年3期
- Journal of Rock Mechanics and Geotechnical Engineering的其它文章
- On the chemo-thermo-hydro-mechanical behaviour of geological and engineered barriers
- On the thermal impact on the excavation damaged zone around deep radioactive waste disposal
- Homogenization in clay barriers and seals: Two case studies
- Sealing of fractures in claystone
- Short- and long-term behaviors of drifts in the Callovo-Oxfordian claystone at the Meuse/Haute-Marne Underground Research Laboratory
- TIMODAZ: A successful international cooperation project to investigate the thermal impact on the EDZ around a radioactive waste disposal in clay host rocks