Methodologiesfor Assessing 3D QoE:Standardsand Explorative Studies
Wei Chen,Jérôme Fournier ,Marcus Barkowsky,and Patrick Le Callet
(1.Skype,Stockolm,Sweden;
2.Orange Labs,France Télécom,4 ruedu Clos Courtel,35512 Cesson-Sevigne,France;
3.RCCyNUMR 6597 CNRS,Ecole Polytechniquedel'Universitéde Nantes,rue Christian Pauc,La Chantrerie,44306 Nantes,France)
Abstract Mastering quality of experience(QoE)is key to the widespread adoption of stereoscopic 3DTV(S-3DTV).However,assessing QoE of S-3DTV is not straightforward.Methods for determining observer experience need to be clearly defined and sufficiently robust.In this paper,we present state-of-the-art subjective QoE assessment for S-3DTV.We present conventional standardized ITU recommendations for evaluating picture quality and discuss new ITU activities in the area of S-3DTV assessment.We also present and discuss explorative studies from the literature.We then introduce ways of using conventional quality assessment for S-3DTV QoEassessment.In discussing our proposal,we mainly focus on QoE indicators and common features of subjective assessment.Multidimensional QoE indicators need to be used in S-3DTV to highlight advantages and reveal problems.In the second part of our proposal,we discuss the requirements for adapting ITU-R BT.500,a conventional subjective QoEassessment method,ITU-RBT.500,for assessing QoE of S-3DTV are presented.
Keyw ords stereoscopic 3DTV;quality of experience;subjective assessment
1 Introduction
S tereoscopic 3D television(S-3DTV)has created new technical challenges,especially in the provision of good quality of experience(QoE)along the delivery chain.S-3DTV has been rigorously marketed,and many people now have 3D-capable displays.However,the take-up of 3D content is still low.People still do not naturally prefer to watch 3D content.Mastering QoE is crucial for the widespread acceptance and success of S-3DTV.
QoE assessment is not only important in the selection of video bitrates,S-3DTV display techniques,and video encoders in the specification process;it is also important for producing 3D content that provides real added value compared with 2D.Evaluating good QoE in S-3DTV is an urgent and important task.In both academia and industry,subjective assessment has been the most direct way of evaluating QoE.This involves using well-defined methods to conduct experiments with observers.However,subjective assessments are mainly focused on picture or video quality.In S-3DTV,the criterion of picture quality mainly relates to the structural and textual characteristics of 3D pictures and does not,by itself,encompass all the visual characteristics that need to be taken into account to ensure good QoE.It does not include enhanced depth perception and visual comfort.In moving from 2D to 3D,testing conditions such as viewing distance,display calibration,and content selection need tobereviewed.
2 ITU Recommendationsand the Foundationsof Video Quality Assessment
Standardized subjective quality assessment has a long history.In 1974,the ITU published ITU-R BT.500Methodology for the subjective assessment of the quality of television pictures.This recommendation has been revised several times and is still the most widely used recommendation on image quality assessment.In 2007,ITU published ITU-R BT.1788
Methodology for the subjective assessment for video quality in multimediaapplication[1].Thisdescribesnon-interactivesubjective methods for evaluating the quality of multimedia and data broadcasting applications comprising video,audio,still pictures,text,and graphics.The main difference between ITU-R BT.500 and ITU-R BT.1788 is that ITU-R BT.500 is for subjective assessment of television pictures(large video format)and ITU-R BT.1788 is for subjective assessment of video quality for multimedia(reduced pictureformat).
ITU-R BT.500 specifies the common features and methods for subjective quality assessment(Table 1).Common features are the general conditions necessary to conduct subjective quality assessment.The assessment method refers to the protocol used to evaluate a particular question in a subjective quality assessment.ITU-R BT.1788 shares some specifications of ITU-R BT.500,but some features are adapted for multimedia application.For example,there is more flexibility with the viewingdistance,which can beconstrained or unconstrained.
2.1 ITU Common Features
To avoid unreliable results in subjective assessment,ITU-R BT.500 specifies the following:
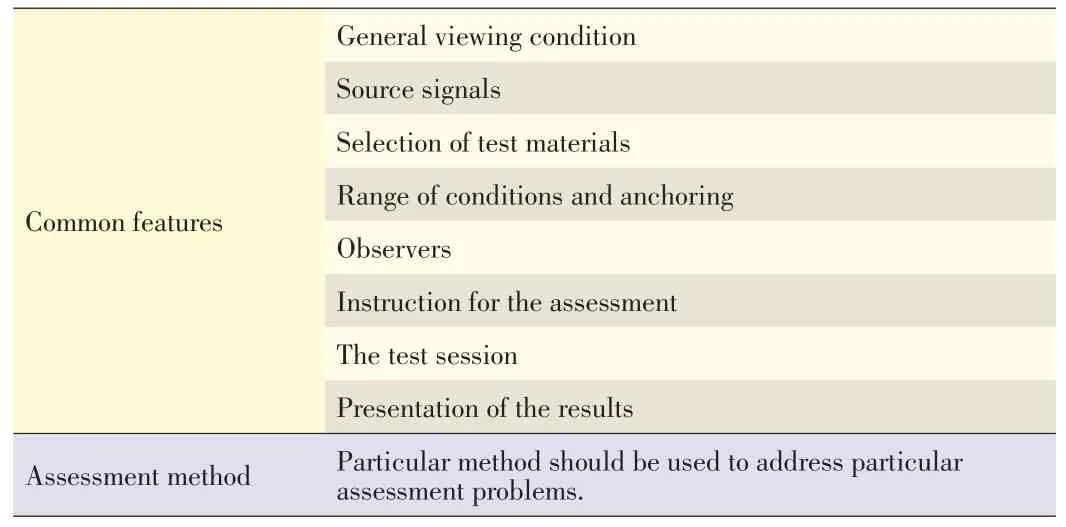
▼Table1.Specification of subjectivequality assessment in ITU-RBT.500
·general viewing condition.Environment luminance(room lighting and background chromaticity)screen luminance,display brightness and contrast calibration,display resolution review,viewing observation angle,and viewing distancearespecified.
·source signals.These should be of optimum quality for the television standard used.To obtain stable results,it is crucial that there are no defects in the reference part of the presentation pair.The source signals are directly shown to the observer as the reference picture or they are input into the systembeingtested.
·selection of test materials.The number and type of test scenes are critically important for interpreting the results of the subjective assessment.New systems often depend heavily on the content of scenes or sequences.The number and type of test scenes should be selected to provide a reasonable generalization to normal programming.The spatial and temporal perceptual characteristics of a scene can be measured to determinethe complexity of a scene.
·range of conditions and anchoring.Most assessment methods are sensitive to variation in the range and distribution of visible conditions;therefore,in viewing sessions,the full range of distortions being tested(or extreme examples as anchors)should beshown tocover thewiderangein quality.
·observers.There should be at least 15 non-expert observers who are screened for visual acuity,color vision,and other visual anomaliesprior toaviewingsession.
·instruction for the assessment.Assessors should be carefully briefed on the method of assessment,types of impairment or quality factors likely to occur,grading scale,and timing.Training sequences should demonstrate the range and type of impairments being assessed.The training sequences should not be the same scenes as those used in the actual test but should havecomparablecontent and degradation.
·test session.A test session should last up to half an hour.Dummy presentations should be used to stabilize the observer's opinion.If several sessions are necessary,the presentations should be random,but the under test conditions,the presentations should be ordered so that any effects on the grading of tiredness or adaption are balanced out from session tosession.
·presentation of the results.This must include details of the test configuration,test materials,type of picture source and display monitors,number and type of assessors,reference system used,grand mean score for the experiment,original and adjusted mean scores,and 95%confidence interval.
2.2 ITU Quality-Assessment Methodsand Scales
There are two classes of subjective assessment:quality assessment and impairment assessment.The former establishes theperformance of a systemin optimal conditions;thelatter establishes the ability of a system to retain quality in non-optimal conditions.
ITU-R BT.500 also provides a collection of methods for different assessment problems.In general,four different methods are proposed to assess the quality of still images or short video sequences of 10 seconds.These methods are double-stimulus-continuous-quality-scale(DSCQS),double-stimulus impairment scales(DSIS),single-stimulus,and stimulus-comparison.The recommended rating scales for these methods are shown in Table2.
In DSCQS,observers assess the overall image quality from a series of image pairs,each of which comprises an unimpaired(reference)and an impaired image(test).The two images are presented one by one,each for 10 seconds.This process is repeated twice.During the second run through,observers are asked to rate the overall quality of each image.The presentation structure is shown in Fig.1.DSISis similar to DSCQSbut involvestheuseof impairment scales.
In the single-stimulus method,observers assess the quality of each image in the stimulus set individually.In stimulus-comparison scaling,a series of image pairs,including all possible combinations of the two images in the stimulus set or just a sample of all possible image pairs,are presented.Observers compare the two images in each image pair and assign arelationship using acomparison scale(Table2).
For longer video sequences of between 60 s and 20 mins,single-stimulus continuous quality evaluation(SSCQE)and simultaneous double stimulus for continuous evaluation(SDSCE)methodsaresuggested.
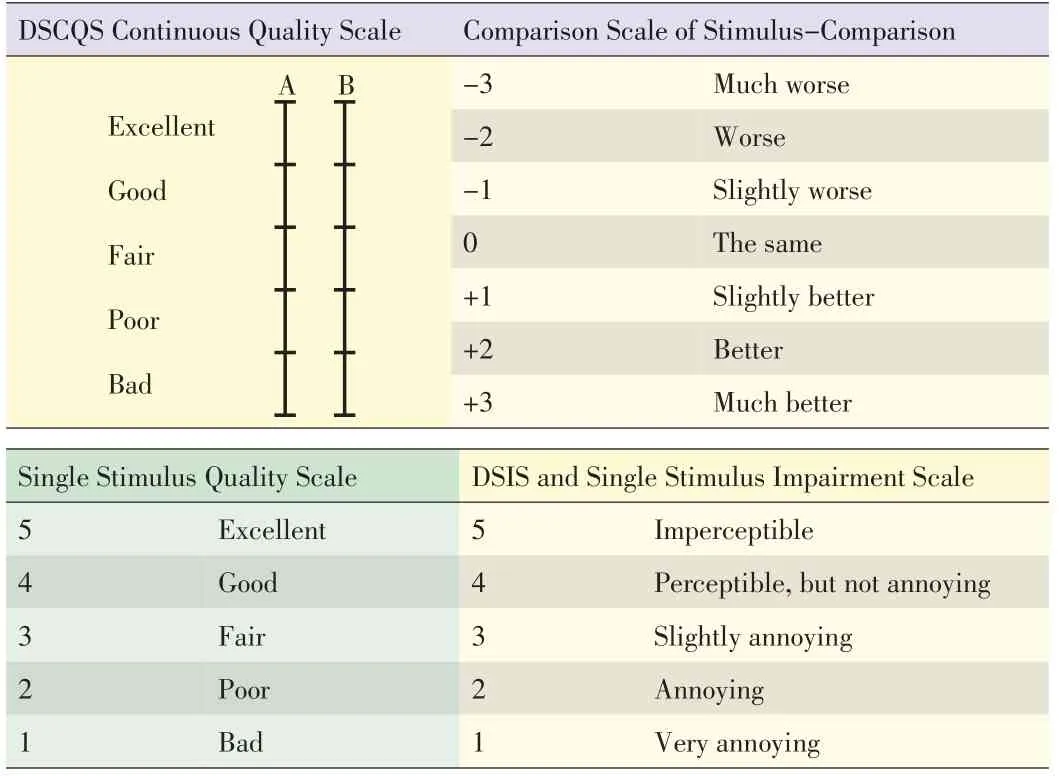
▼Table2.ITU-RBT.500 recommendation rating scales
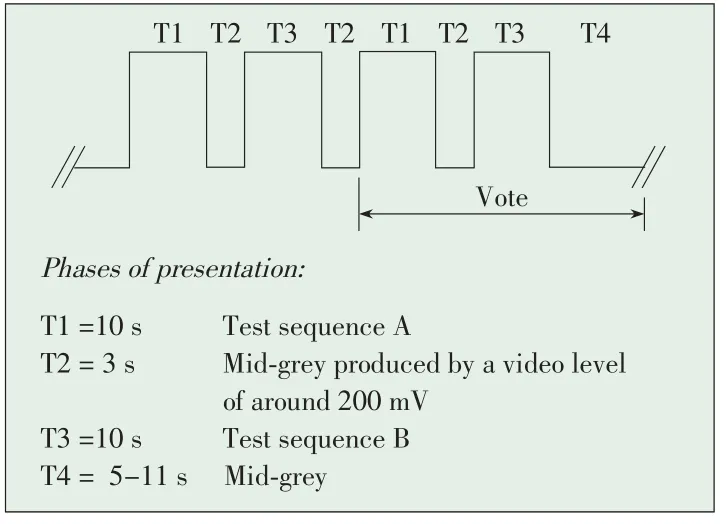
◀Figure1.Presentation structureof DSCQS and DSISVariant II according to ITU-R BT.500.
In SSCQE,observers continuously assess the quality of a long video sequence by moving a handset slider.The slider is time sampled,typically at two samples per second.Its range is usually 0 to 100 and corresponds to the DSCQS continuous quality scales.SSCQE is used to assess video that contains scene-dependent and time-varyingimpairments.
SDSCE is similar to DSCQE,but two stimuli are presented at the same time.SDSCE is used to judge the difference in fidelity between the reference video sequence and the test sequence.When the fidelity is perfect,the slider should be at 100;when thereisnofidelity,theslider should beat 0.
In ITU-R BT.1788,subjective assessment methodology for video quality(SAMVIQ)is proposed for assessing the video part of multimedia codecs or systems.SAMVIQ derives from DSCQS,which can be used to efficiently assess a large range of image qualities because it provides reliable discrimination at both high and lowquality levels[3].
SAMVIQ allows both hidden and explicit references in a multi-stimulus test environment.Fig.2 shows SAMVIQtest organization.All the stimuli are accessible in a multi-stimulus form.Besides the explicit reference,all the stimuli(with hidden reference and different algorithms)are randomly ordered.The observer can choose the order of viewing the stimuli,review them,and change ratings if necessary.Each stimulus is compared to an explicit reference in order to determine the best quality that can be achieved in the test.The observer gives a rating using a slider that is graded from 0 to 100 and corresponds to a rating of bad,poor,fair,good and excellent.A maximum of 15 s is necessary to get a stable,reliable quality score for each stimulus[3],[4].The quality evaluation is carried out sceneafter scene.
3 Subjective QoE Assessmentsfor S-3DTV:ITU Activitiesand Explorative Studies
3.1 ITU Evolution Towards Quality Assessment of S-3DTV
The original ITU-R BT.500 specification does not cover S-3DTV assessment.In 2000,ITU published ITU-R BT.1438:Subjective assessment of stereoscopic television pictures[5].Thisstandard describes
·assessment factors.General factors such as resolution,color rendition,motion portrayal,overall quality,and sharpness,are assessed in monoscopic television pictures.To these are added new factors,such as depth resolution,depth motion,puppet theatreeffect,and cardboard effect,which arespecific to stereoscopic television.
·assessment methods.The methods of ITU-R BT.500 can be used for evaluating the quality of stereoscopic images or videos.
·viewing conditions.Thedisplay frameeffect(i.e.windowsviolation),inconsistency between accommodation and convergence(minimum value of depth of focus as±0.3 diopters),and camera parameters(camera separation,camera convergence angle,focal length of lens)should be taken into account when determiningviewingconditions.
·observers.Besides vision tests mentioned in ITU-RBT.500,stereopsistest should beconducted toscreen observers.
·test materials.
The ITU-R BT.1438 standard is still does not specify many new characteristics of S-3DTV and how to assess them.Thus,ITU-R SG6 WP6C and ITU-T SG9 have addressed Question Q.2 and Q.12,respectively,for finding a more adequate way to assess S-3DTV.The recent recommendations(draft)from ITU-RSG6 WP6Cand ITU-TSG9 are listed in the Table 3[6].
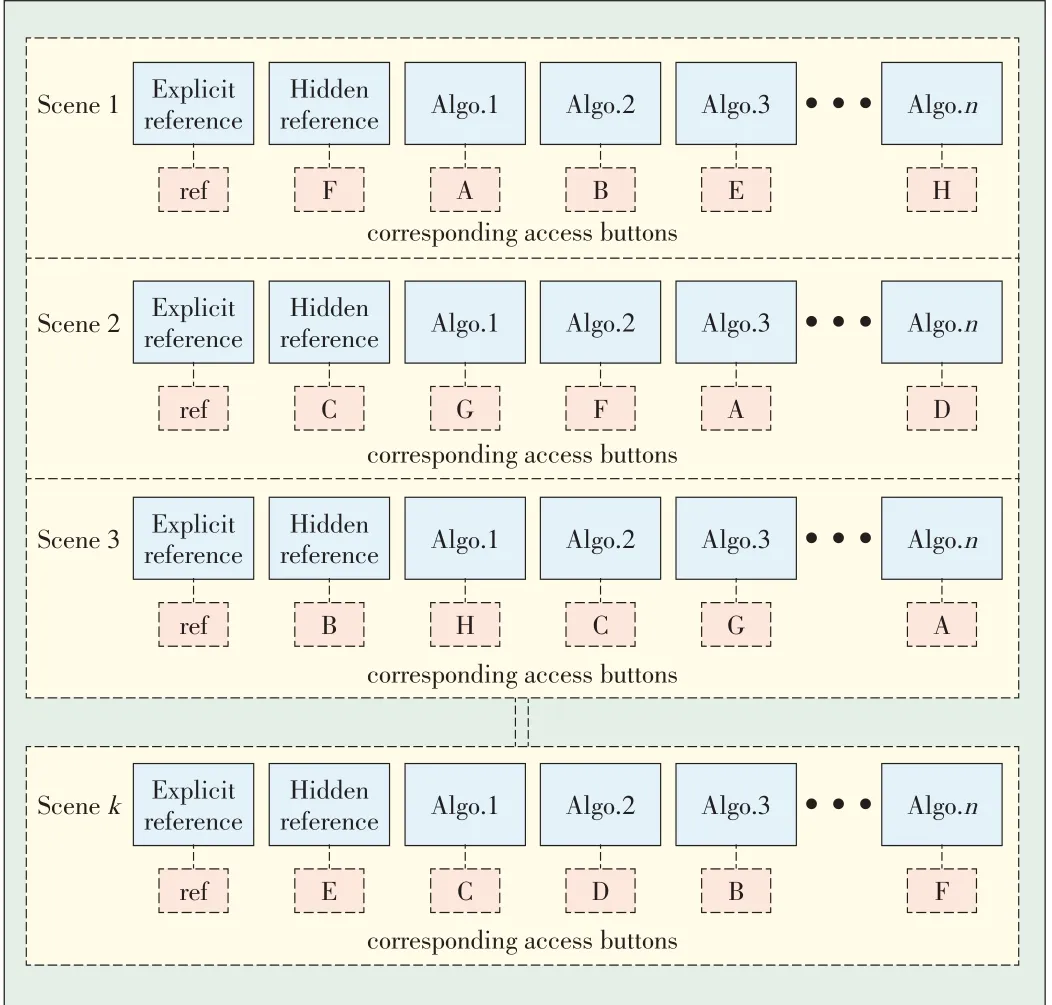
▲Figure2.SAMVIQtest organization[3].
The Video Quality Expert Group(VQEG)has been an active contributor to most of the questions of ITU-T SG9.VQEG established a new project called 3DTV to investigate how to subjectively assess 3DTV video quality.The most recent ITU recommendation,ITU-R BT.2021:Subjective methods for the assessment of stereoscopic 3DTV systems,was published in August 2012[7].Compared with ITU-R BT.1438,ITU-R BT.2021 highlights primary perceptual dimensions(picture quality,depth quality,and visual(dis)comfort)as well as additional perceptual dimensions(naturalness,and sense of presence).
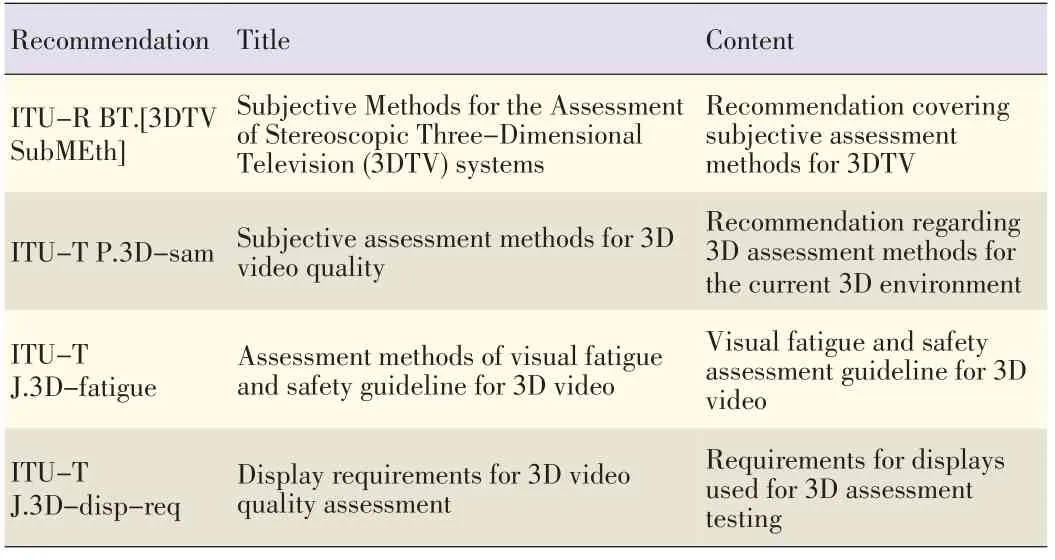
▼Table3.Recommendation for subjectiveassessment of S-3DTV
3.2 Explorative Studies
Besidesinternational standardization activities,many explorative studies have been conducted over the past decade to better understand and assessthe QoEof stereoscopic images.
In[8],the authors discuss the human factors in 3DTV.Subjective evaluation criteria were proposed to guide the development of 3DTV services.In[9],Wöpking conducted a subjective experiment to assess the annoyance caused by impairments in stereoscopic images.A single-stimulus impairment scale with nine different disparity levels and five levels of background resolution was used.In[10],Ijsselsteijn et al.investigated the effect of camera parameters and display duration on subjective evaluation of stereoscopic images.The authors used single-stimulus methods with a numerical scale from one to ten,where one is the lowest level and ten is the highest level of the attribute.Observers were asked to rate quality of depth and naturalness of stereoscopic images.In[11],Yanoet al.used SSCQEwith aquality scaletosubjectively test visual comfort.Two 15-minute video sequences,(a 2D video and a stereoscopic video)were used as stimuli.In[12]and[13],Meester et al.identified underlying attributes of image quality and quantified the perceived strengths of each attribute.They described how the principles of quantitative quality measurement of 2D image quality can be applied to 3DTV.In[14],Kooi and Toet used the DSIS Variant I method and a five-level scale of discomfort to assess the visual discomfort created by visual asymmetries in stereoscopic images.This scale is:1)equal viewing comfort;2)slightly reduced viewing comfort;3)reduced viewing comfort;4)considerably reduced viewing comfort;5)extremely reduced viewing comfort.In[15],Yano et al.used a five-level visual fatigue scale and changed accommodation and convergence to evaluate the viewer's subjective fatigue level after an hour of stereoscopic viewing.The scale in[15]is:5)I am not tired;4)I sense a little tired;3)I am a little tired;2)I am tired;1)I am very tired.In[16],Emoto et al.proposed that the change of fusional amplitude and accommodation response is a valid indicator of visual fatigue.In[17],Seuntiëns et al.used a single-stimulus assessment method with a five-level quality scale to assess the naturalnessof viewing 3Dimages.In[18],the same authors investigate perceptual attributes of crosstalk in 3D images.The same single-stimulus assessment method with five-level scale was used to assess perceived image distortion and perceived visual strain.In[19],the same authors still used the single stimulus method but with different scales to assess the effects of symmetric and asymmetric JPEG coding and camera separation.Perceived overall image quality was rated according to the ITU's five-level quality scale,and the eye strain was rated according to the ITU's five-level impairment scale.Perceived sharpness and depth were rated using a numerical scale from one to five.No adjectives were used on the depth and sharpness scale.In his PhD thesis,Seuntiëns summarized all his studies and proposed a perceptual model for 3D visual experience(Fig.3)[20].
In[21],a questionnaire on the five main factors for visual fatigue was proposed.In[22],an electroencephalography(EEG)signal was used to detect visual fatigue.In[23],image quality;naturalness,depth perception;and viewing experience for stereoscopic images with different camera baseline distances,blur levels,and noise levels were rated using a single-stimulus method and the ITU quality scale.In[24]and[25],Goldmann et al.established a stereo image and video database.They used a single-stimulus method with continuous quality scale to evaluate the quality of stereoscopic images in the proposed database.In[26],Strohmeier et al.used a method that combined psychoperceptual evaluation(acceptance of quality,overall satisfaction,3D impression)and qualitative attribute elicitation(perceived overall image quality and perceived depth)to attain a holistic understanding of 3D audiovisual quality in mobile 3D devices.In[27],a paired comparison method and autostereoscopic display was used to understand the affect of depth rendering on QoE.In[28],the authors assessed the quality,depth,and naturalness perceived in the uncompressed and compressed stereoscopic images.They concluded that both perceived quality and perceived depth need to be known in order to assess 3D QoE.Naturalness was found to be highly correlated to quality.Table 4 summarizes all of the previously mentioned studies.
3.3 Discussion
Conventional ITU standards such as ITU-R BT.500 do not cover the new characteristics of S-3DTV.The adapted ITU-R BT.1438 only covers a limited number of S-3DTV characteristics.New questions about subjective assessment for S-3D video have been raised,and new ITU activities on evaluating QoE for 3Dvideoarenow underway.
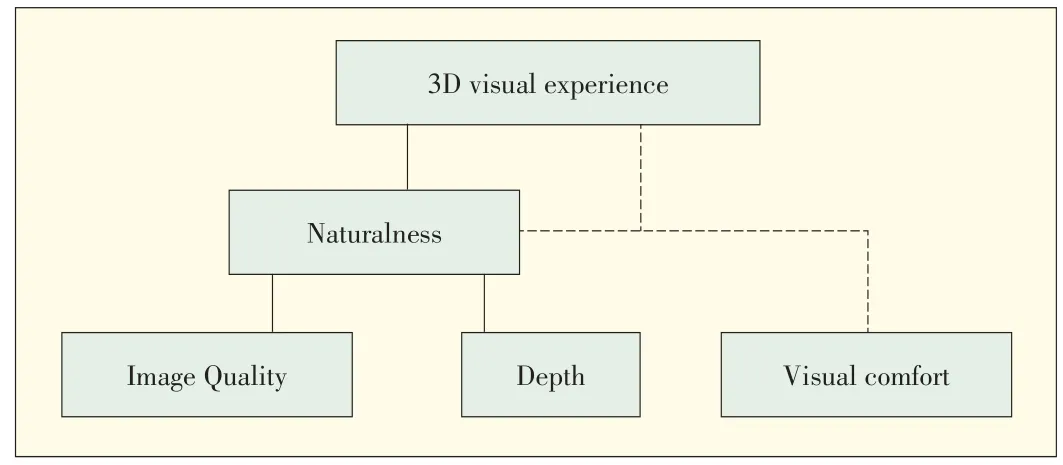
▲Figure3.Model of 3Dvisual experience.
Explorative studies on assessing QoE for S-3DTV have resulted in three main observations:
1)In many studies,different indicators,or subjective attributes,were used to measure QoE of stereoscopic images.These attributes include amount of depth,quality of depth,texture quality and sharpness,visual comfort,visual fatigue,viewing experience(overall image quality or visual experience),naturalness,presence,and enjoyment[29].There are no common definitions for some QoE indicators;for example,depth may refer to the amount of depth[23]or the quality of depth[10].Image quality may refer to texture quality[23]or overall image quality[24],[25].In fact,it is difficult to accurately compare studies;however,a common understanding of S-3DTV QoE assessment can be drawn from explorative studies.Conventional quality indicators are not sufficient to determine QoE for S-3DTV,and multidimensional QoEindicatorsarerequired.
2)The subjective test environment was different for each of the subjective experiments.For general viewing conditions,various types and sizes of S-3DTV display were used,often without specification of the calibration process and luminance.The rule of determining viewing distance varied.Occasionally,test materials were not precisely specified.Most of the studies did not follow the recommendations of ITU-R BT.500 and ITU-R BT.1438,perhaps because the general viewing conditions proposed by ITU-R BT.500 are not suitable for 3D applications.This also makes it more difficult tocomparestudies.
3)Therearestill nocommon methodstoassessvisual fatigue.
In the development of new standardized subjective QoE assessment methods,these three observations must be taken into account.Reliable specifications must be created to guide subjective assessment and achieve reliable,comparable,and repeatablesubjectiveexperiential results.
4 Towards Comprehensive Adaptation of Subjective QoE Assessment for S-3DTV
Conventional subjective quality assessment methodologies need to be adapted to S-3DTV.Because S-3DTV QoE is multidimensional,multiple QoE indicators are required.Moreover,when specifying common features for the assessment of S-3DTV images,new factors in S-3DTV need to be considered because they might affect QoE.
In this section,we propose and define multidimensional QoE indicators for S-3DTV.Then,we discuss new factors that need to be considered for comprehensive subjective assessment of S-3DTV QoE.The traditional way of evaluating QoE involves assessing overall visual quality;however,this is not sufficient for determining the advantages and disadvantages of stereoscopic images.Image quality does not encompass perceived depth and visual comfort.One of the common conclusions from the literature presented in the previous section is that S-3DTV QoE should be considered multidimensional.We proposethefollowing QoEindicatorstoassess S-3DTV QoE:
·2D image quality.This is the quality of texture rendering without regard to depth.
·depth quantity.This is the amount of perceived depth induced by the combination of monocular and binocular depth cues.
·visual discomfort.This iscaused by eye strain,dry eyes,and fusion difficulties.Variation in visual comfort can be also perceived asthe sensation of vision difficulties.
·depth rendering.This is the quality of the perceived depth and depends on the observer's preferred basic depth reconstruction criteria.It is mostly related to stretching or compression of the real scene in the reconstructed scene and alsoaffectsthe shapes of objects.
·naturalness.This is an evaluation of whether the scene more or lessrepresentsreality.
·visual experience.This is the overall QoE of the images(in termsof immersion)and theoverall perceived quality.
By the definition of the above six QoE indicators,we can separate these indicators into two levels(Fig.4).The higher-level concept QoE indicators,such as visual experience,naturalness,and depth rendering,can be a complex combination of different cognition and perception decisions.The low-er-level QoE indicators comprise the basic QoE indicators,which may provide a direct link to the technical parameters,such as image quality,depth quantity,and visual comfort.

▼Table4.Overview of theexplorativestudieson QoEof S-3DTV
In our studies[30]-[32],we designed subjective QoE experiments to understand how varying basic QoE indicators affects other quality indicators.Theresultsled toaproposal for modeling higher-level concepts,such as depth rendering,naturalness and visual experience.A 3D QoE indicator,denoted QoE,may be represented as a weighted sum of 2D image quality(IQ),depth quantity(D),and visual comfort(VC):

Theabove indicators are used to determine short-termor instant opinion of the QoE of stereoscopic images.Long-term of viewing of S-3DTV images may induce visual fatigue and affect QoE of S-3DTV.Thus,visual fatigue can be used as a long-term QoEindicator and isdefined asadecreasein performance of the visual system.It is an objectively measurable criterion that is particularly valuable for determining long-term adaptiveprocessesof thevisual system.
However,methods for measuring visual fatigue are being investigated,and no common methods currently exist.
The egg had been fragile. Its thin outer shell had protected its liquid interior. But, after sitting through the boiling water, its inside became hardened! The ground coffee beans were unique, however. After they were in the boiling water, they had changed the water.
4.1 New Factors Affecting Assessment of S-3DTV QoE
For subjective quality assessment,environmental setups,as those described in ITU-R BT.500,do not cover the new characteristics of S-3DTV.Thus,conventional methods need to be adapted to accommodate the new factors of S-3DTV.In this section,wediscussnew factorsthat affect S-3DTV QoEassessment based on ITU-RBT.500 recommendation(Table1).
1)General Viewing Conditions
·luminance and contrast ratio.Additional optical instruments for 3D viewing(e.g.glasses and filters)reduce luminance.We previously found that luminance reduces by up to 70%for 3DTV systems with active glasses and about 50-60%for polarization 3DTV systems[32].This should be taken into account when measuring peak luminance.In[33],at least 30 cd/m2was suggested as the minimum luminance for S-3DTV displays in order to sustain the depth of focus and guarantee basic depth sensation.Moreover,crosstalk is not only an annoying artifact,but it also affects the final contrast ratio.Thus,the display measurement and calibration should bespecified.

▲Figure4.3DQoEmodels.
·background and room illumination.When the display is positioned too close to a wall,objects with uncrossed disparity in the screen may appear to be inside the wall.This may cause conflicts between the depth illusion from S-3DTV and the reality of the room.However,some researchers have also argued that this should not be a problem because people can recognize an S-3DTV display as a visual window.Further research is required to solve this problem.Moreover,room illumination may need to be defined more precisely for different 3DTV techniques.For example,the frequency of neon lighting depends on the local grid frequency.When using S-3DTV with active shutter solutions,interference between refresh frequency of the active shutter and the frequency of the neon light may induce serious flickering and eyestress.
·monitor resolution.Overall display resolution,per view resolution,and stereoscopic resolution should be considered as aspects of the monitor resolution.Spatially multiplexed S-3DTV displays have reduced spatial resolution.Moreover,the physical pixel distribution may not be uniform,and pixels belonging to the same view may not be positioned on a Cartesian grid.Time-multiplex displayshavereduced temporal resolution.Temporal asymmetries and temporal luminance distribution problems can also occur.It is still an open question as to how the viewer perceives these changes in resolution.In[34],the depth resolution was assessed,and perceived depth voxels and perceived depth range were defined.In[35],stereoscopic resolution was defined as the number of planes of voxels within a certain depth range(±100 mm around the display plane).
·viewing distance.Three times the height of the screen for HDTV and six times the height of the screen for SDTV were recommended in ITU standards BT.710[36]and BT.500.Manufacturers often recommend a designed viewing distance(DVD)that differs from the ITU standards.In some cases,for example,autostereoscopic displays,3D can only be viewed at the DVD.The preferred viewing distance(PVD)wasrecommended in BT-500 for 2Dviewing in home environments.In[37],a subjective test shows that PVD is a function of different parameters,such as human visual acuity,screen size,picture resolution.In[33],perceived binocular depth is a function of binocular disparity scaling and viewing distance.Changing the viewing distance changes the binocular depth perception.Thus,depth perception should beadded asanew component for the PVDfunction.
·viewing position.3D geometrical distortions(e.g.shear distortion caused by a sideways movement of the observer[38])can affect how a viewing position is chosen.Luminance reduces more severely when the observation angle increases.Thisalsoappliestomotion parallax,which isseen on multiview autostereoscopic displays.The viewing position is limited to certain positions in front of the display.If viewers are not in the right position,left and right view images are not correctly perceived in the left and right eye.Crosstalk or reversal of left and right imagesmay occur.
·depth rendering.This is the way in which a display represents the perceived depth based on the input video.Depth rendering has been shown to significantly affect the QoE for autostereoscopic displays[27].At the display side,depth rendering depends on viewing distance,content disparity,and display properties.Moreover,constraints cause by the comfortable viewing zone should be taken into account for depth rendering.
·video format.Various 3D representation formats are available in the literature.These formats include conventional stereo video,2D-plus-depth,format,multiview video(MVC)and multiview video plus depth format(MVD),layer depth video(LDV),and depth-enhanced stereo(DES).For frame-compatible formats such as top-and-bottom and side-by-side,reducing resolution may affect quality.Our study[32]showed that side-by-side format provides better visual experience than top-and-bottom format for line-interleaved display,especially for interlaced scan content.To optimize 3DTV QoE,interaction with 3D display technique should be taken into account when selecting a 3D representation format.For formats based on depth maps,the quality of the rendered novel views is still not comparable to native stereo views.This even applies to the LDV format[39],[40].Video format and view synthesis algorithm still need to be specified.
·video format conversion.Conversion between the previously mentioned video formats is lossy in most cases.For example,information for occluded objects is systematically lost if 2D-plus-depth-format with a single layer of depth is converted to conventional stereo video format[39].The amount of lossdependson the implementation used.Minimumaccuracy should be defined for the format conversion by providing a validation test set.
3)Selection of Test Materials
·video content complexity.For 2D video,ITU-T P.910 defines the spatial perceptual information(SI)and the temporal perceptual information(TI)as main elements of 2D video complexity[41].Some new measurements,called depth perceptual information(DI),should complement these two measurements.With DI,spatial and temporal maximum disparity and average disparity in pixels may be considered.Addinga third dimension tothe videocontent complexity also requires more standardized video sequences;for example,further shooting sessions are required to generate the new reference scenes with various complexity levels that takeintoaccount SI,TI,and DI.
·content acquisition and calibration.Stereoscopic distortion,such as puppet theater effect and cardboard effect[42],is an impediment to comfortable viewing and is a key factor that needs to be considered in content acquisition[43].Moreover,view asymmetry,such as misalignment of camera positions,magnification between views,and desynchronization of color,may be induced by different sources.Because view asymmetries can induce visual artifacts and might result in visual discomfort,calibration of stereoscopic images is important[32].
4)Observers
·number.The number of observers depends on sensitivity and the required reliability of the experiments.In[44],individual differences in susceptibility are still unclear.The viewers'opinion was reported to be not as stable for 3D as it was for 2D.Thus,an increase in the number of observers might be required to guarantee the reliability of the test.The minimum number of 15 observers recommended in ITU-BT.500 may not besufficient.
·viewer's stereopsis performance.About 10-15%of the pop ulation cannot properly perceive binocular depth cues;therefore,additional optometric tests should be done to evaluate the viewer's binocular vision.ITU-R BT.1438 recommends different vision tests(VTs)for assessing binocular vision.
5)Test Session
·viewing duration.The reference in ITU-R BT.500 for short-duration 2D video samples is 10 s.For the transition to 3D,there are two conflicting viewpoints.One viewpoint is that because S-3DTV more closely resembles natural human viewingbehavior,lesstimeisneeded tojudgethequality.The other viewpoint is that more time is needed because more information is contained in the additional dimension of S-3DTV,and the viewer is used to 2D displays.For a short duration test,the presentation time had little effect on subjective evaluation results;however,only 5 s and 10 s were tested[10].Further studies are required on viewingduration in subjectivetests.
6)Analysis of Test Results
·viewer factor.A statistical analysis needs to be done in order to reject an incoherent viewer.For S-3DTV,subjective test results may be more sensitive to individual preferences;therefore,multimodal viewer distributions might need to be analyzed.·multidimension indicator analysis.Using indicators such as
QoE,depth sensation,and visual comfort for 3D requires new methods summarization and statistical analysis methods,and test results need to be carefully interpreted.of objectivemodelsfor 3Dvideoquality.
7)Test Methods
·visual fatigue.This is an objectively measurable quantity.Several approaches to assess visual fatigue have been investigated.Such approaches include optometric tests of visual function,electroencephalography(EEG)and event-related potential(ERP)[22],eye tracking considering visual interest,snapshots of visual discomfort(in the form of questionnaires before and after viewing[21]),and continuous assessment of comfort[11].These efforts may lead to standardized proceduresand recommendations.
·subjective QoE indicator.Multidimensional QoE indicators should be used to assess QoE of S-3DTV.Particular indicators should be used to assess particular problems in S-3DTV.Moreover,interactions between different QoEindicatorsshould bewell specified.
New factors affecting the subjective assessment of S-3DTV are summarized in Table 5.Further experiments are needed on most of thesenew factors.
5 Conclusion
In thispaper,wehave reviewed the current status of QoEassessment and have drawn several observations.First,conventional subjective quality assessment methods are not sufficient for evaluating the quality of stereoscopic images.ITU and VQEG are currently working on new subjective quality assessment methods for such contexts.Apart from standardization efforts,several explorative studies have been done on different topics considering very different QoE indicators.However,there are no common definitions for these QoE indicators.Moreover,the viewing environment and conditions vary between studies,and this makes it more difficult to draw comparisons.We investigated multidimensional QoE indicators,including 2D image quality,depth quantity,visual comfort,depth rendering,naturalness and visual experience,and visual fatigue.We discussed comprehensive adaptations of subjective QoE assessment for S-3DTV.New factors in 3D need to be considered when developing QoE assessment methods for S-3DTV.Such factors will help define new subjective QoE assessment methodologies for 3DTV stereoscopic images.These methods have already been successfully applied on the production side.Orange has developed a capture-monitoring system currently used by stereographers and post producers.This tool is successful mostly because it is based on carefully designed QoEexperiments that follow the proposed framework in this paper.Nevertheless,this framework still needs to be challenged through usein other partsof thedelivery chain.

▼Table5.New factorsaffecting subjectiveassessment for S-3DTV
- ZTE Communications的其它文章
- QoE Modeling and Applicationsfor Multimedia Systems
- 3D Perception Algorithms:Towards Perceptually Driven Compression of 3D Video
- New Member of ZTECommunications Editorial Board
- Estimating Reduced-Reference Video Quality for Quality-Based Streaming Video
- Human-Centric Composite-Quality Modeling and Assessment for Virtual Desktop Clouds
- Assessing the Quality of User-Generated Content

