Human-Centric Composite-Quality Modeling and Assessment for Virtual Desktop Clouds
Yingxiao Xu,Prasad Calyam,David Welling,
Saravanan Mohan3,4,Alex Berryman3,4,and Rajiv Ramnath4
(1.Fudan University,Shanghai200433,China;
2.University of Missouri,MO 65201,USA;
3.Ohio Supercomputer Center/OARnet,OH 43212,USA;
4.The Ohio State University,OH 43210,USA)
Abstract There are several motivations,such as mobility,cost,and security,that are behind thetrend of traditional desktop userstransitioning to thin-client-based virtual desktop clouds(VDCs).Such a trend has led to the rising importance of human-centric performance modeling and assessment within user communities that are increasingly making use of desktop virtualization.In thispaper,wepresent anovel referencearchitecture and itseasily deployableimplementation for modelingand assessingobjective user quality of experience(QoE)in VDCs.This architecture eliminates the need for expensive,time-consuming subjective testing and incorporates finite-state machine representations for user workload generation.It also incorporates slow-motion benchmarking with deep-packet inspection of application task performance affected by QoS variations.In this way,a“composite-quality”metric model of user QoEcan be derived.We show how this metric can be customized to a particular user group profile with different application sets and can be used to a)identify dominant performance indicators and troubleshoot bottlenecks and b)obtain both absolute and relative objective user QoE measurements needed for pertinent selection of thin-client encoding configurations in VDCs.We validate our composite-quality modeling and assessment methodology by using subjective and objective user QoE measurements in a real-world VDC called VDPilot,which uses RDP and PCoIP thin-client protocols.In our case study,actual users are present in virtual classrooms within a regional federated university system.
Keyw ords virtual desktops;quality modeling and assessment;performance benchmarking;thin-client protocol adaptation;objective QoE metrics
1 Introduction
M otivations such as mobility,cost,security are behind the trend of traditional desktop users transitioning to virtual desktop clouds(VDCs)based on thin clients[1],[2].With the increase in mobile devices with significant computing power and connections to high-speed wired and wireless networks,thin-client technologies for virtual desktop(VD)access are being integrated into these devices.In addition,users are increasingly consuming data-intensive content in scientific data analysis applications and multimedia streaming(e.g.IPTV).Thin clients are needed for these applications,which require sophisticated server-side computation platforms such as GPUs.Further,using a thin client may be more cost effective than using a full PC because a thin client requires less maintenance,and operating system,applications,and security upgrades are centrally managed at theserver side.
Fig.1 shows the various system components in a VDC.At the server side,a hypervisor framework,such as ESXi or Xen,is used to create pools of virtual machines(VMs)that host user VDs.These VDs have popular applications,such as Excel,Internet Explorer and Media Player,as well as more advanced applications,such as Matlab and Moldflow.Users of a common desktop pool access the same set of applications but maintain distinctive,personal datasets.The VDs at the server side have common physical hardware and attached storage drives.At the client side,users connect to a server-side unified resource broker via the Internet using various thin-client devices based on TCP(e.g.RDP)and UDP(e.g.PCoIP)The unified resource broker handles all connection requests by using Active Directory or other directory service lookups to authenticate users.It allowsauthorized userstoaccesstheir VDs,and appropriateresources are allocated between distributed data centers.
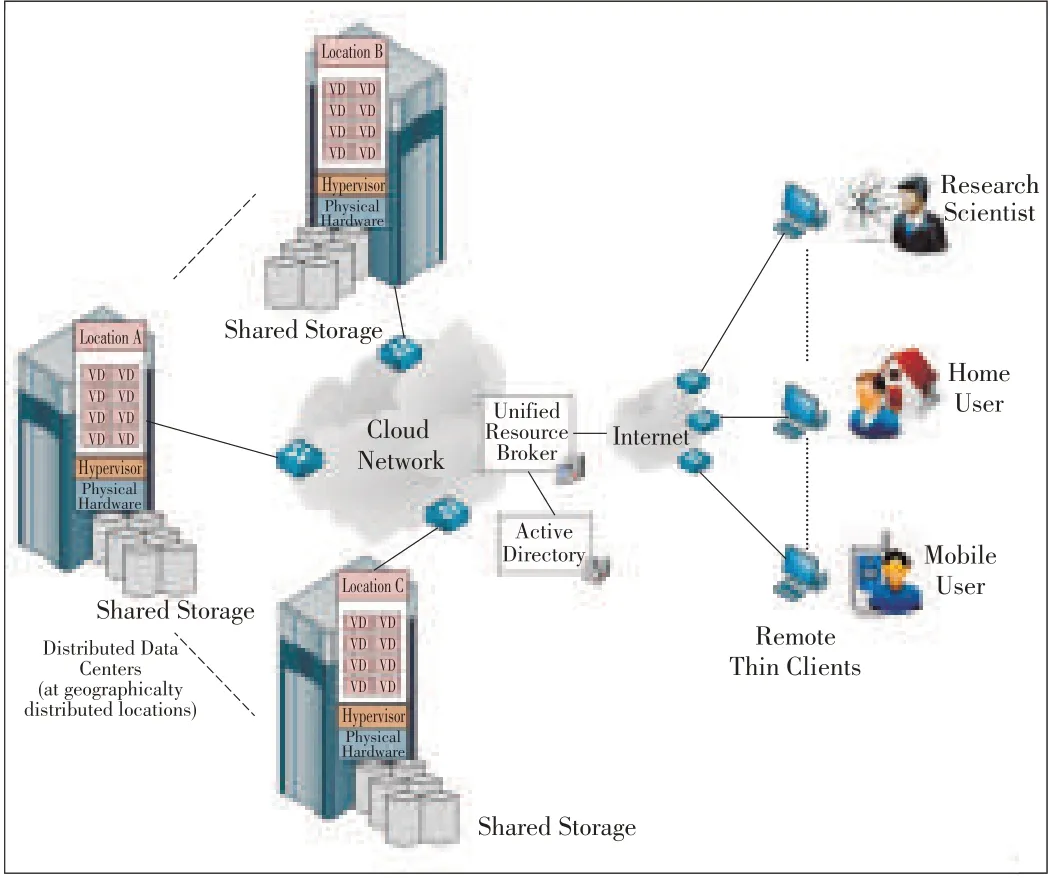
▲Figure1.Virtual desktop cloud system.
To allocate and manage VDC resources for large-SSsscale user workloads and maintain satisfactory QoE,VDC service providers(CSPs)need to suitably adapt cloud platform CPU,memory,and network resources.This also ensures that user-perceived interactive response times(timeliness)and streaming multimedia quality(coding efficiency)are satisfactory.CSPs need to ensure satisfactory user QoEwhen user workloads are bursty as a result of flash crowds or boot storms and when users access VDs from remote sites with varying end-to-end network path performance.CSPs need tools for VDC capacity planning in order to avoid overprovisioning system and network resources and to ensure QoE.CSPs also need frameworks and tools to benchmark VD application resource requirements so that adequate resources can be provisioned to meet user QoE expectations(e.g.less than 500 ms to open MS Office applications).When excess system and network resources are provisioned,a user does not perceive the benefit.For example,a user does not perceive any difference between an application open time of 250 ms and an application open time of 500 ms.Overprovisioning can become expensive,even at the scale of tens of users,given that each VD requires substantial resources(e.g.1 GHz CPU,2 GB RAM,and 2 Mbps end-to-end network bandwidth).Hence,CSPs need frameworks and tools that eliminate overprovisioning and result in benefitssuch asreduced datacenter costsand energy saving.
CSPs also need frameworks and tools to continuously monitor resource allocation and detect and troubleshoot QoE bottlenecks.To a large extent,CSPs can control CPUand memory resources and correctly provision them on the server side;however,frameworks and tools are critically needed to detect and troubleshoot network health issues on the Internet paths between the thin client and server-side VD.CSPs can use frameworks and tools to pertinently analyze network measurement data and adapt resources.Such resource adaptation involves selecting appropriate thin-client protocol configurations that are resilient to network health degradation and that provide optimumuser QoE.
It is important to note that resources should be continually monitored without expensive,time-consuming subjective testing that involves actual VDC users.In terms of the thin client,remote display protocols are sensitive to network health and consume as much end-to-end network bandwidth as is available.They use different underlying TCP-based or UDP-based protocols,which have varying levels of QoE robustness when network conditions are poor[3].Also,thin-client protocol configuration and associated VD application performance depends on the characteristics of the application content(i.e.characteristics of the text,images or video).Improper configuration can greatly affect user QoE in the form of lagging screen updates and poor keyboard and mouseresponsiveness[4]-[7].
It is evident from the above CSPneeds that frameworks and tools for capacity planning,thin-client protocol selection,and bottleneck troubleshooting have to be based on the principles of human-centric performance modeling and assessment so that users maximize their productivity and are highly satisfied.In this paper,we present a novel reference architecture that can be used to model and assess objective user QoE in VDCs.This architecture eliminates the need for expensive,time-consuming subjective testing.It involves offline benchmarking of VD application tasks,such as the time taken to open an Excel application or the time for a video to play back,in ideal network conditions.Performancedegradation ismodeled for different thin-client configurations in a broad range of deteriorated network conditions.
In our offline benchmarking methodology,we leverage finite-state machine representations to characterize the states of user workload tasks,and we use slow-motion benchmarking for deep-packet inspection of VD application task performance affected by QoS variations[4].To define VD application task states and identify them in network traces during deep-packet inspection,we usemarker packetsthat areinstrumented in the traffic between the thin client and server-side VD ends.Our framework is implemented in the form of a VDBench benchmarking engine,which can be easily deployed in an existing VD hypervisor environment such as ESXi,Hyper-V,or Xen.VDBench can be used to instrument a wide variety of thin clients based on Windows and Linux platforms,such as embedded Windows 7,Windows/Linux VNC,Linux Thinstation,and Linux Rdesktop[8],[9].The engine monitors VD user QoEby jointly analyzing the system,network,and application performance.
By using our offline benchmarking methodology in a closed-network testbed,we derive a novel composite-quality metric model of user QoEand show how the model can be customized for particular user-group profiles with different application sets.The model can be used during online monitoring to a)identify dominant performance indicators for numerous factors affecting user QoE and to troubleshoot bottlenecks,and b)obtain both absolute and relative objective user QoE measurements for pertinent selection/adaptation of thin-client encoding configurations.Absolute objective user QoE measurements allow the performance of a thin-client protocol(e.g.RDP)to be compared with that of another thin-client protocol(e.g.PCoIP)when there is latency and packet loss in the path between the thin client and server side.Relative objective user QoE measurements allow the performance of a thin-client protocol in degraded QoSconditions to be compared with the performance of the same protocol in ideal QoSconditions(where there islow latency and no loss).
We determine the effectiveness of our composite-quality modeling and assessment methodology by taking subjective and objective user QoE measurements in a real-world VDCin which RDPand PCoIPthin-client protocols are used.The actual end users are faculty and students in a virtual classroom lab within a federated university system.The high correlation between subjective and objective user QoE from this real-work test allows us to determine the most suitable thin-client protocol for the use cases.It also allows us to verify that the configuration of the VDC infrastructure for the use cases had no inherent bottlenecks and delivered satisfactory user QoE.
The remainder of this paper is organized as follows:In section 2,we describe related work.In section 3,we present the reference architectureand itscomponent functionsand interactions,particularly user workload generation and slow-motion benchmarking.In section 4,we describe how our human-centric,composite-quality metric isformulated through closed network testbed experiments.In section 5,we validate the composite quality metric by using it in a real-world VDC.Section 6 concludesthepaper.
2 Related Work
There are several works that outline the general architecture and requirements(e.g.isolation,scalability,dynamism,and privacy)of an end-to-end system-and-network-monitoring framework in cloud environments[10]-[13].In most cases,the authorshaveproposed reusingtraditional tools(e.g.activemeasurement tools,such as Ping,and passive measurement tools,such as Wireshark)as well as server-side methods to monitor QoS-related factors.The authors of[11]only instrument the server-side virtual machine with measurement-collection scripts.
In contrast,we emphasize human-centric quality assessment,and our method involves instrumenting both the thin clients and server-side VDs with measurement-collection scripts.These scripts feed measurements taken by traditional active and passive measurement tools into a benchmarking engine in order to correlate QoSand QoE measurements and to build a corresponding historical monitoring data set.Moreover,our method is very similar to that in[13].Performance bottlenecks are detected during runtime or online,when QoE-related metrics exceed known benchmarks that are obtained through offline testing and analysis.Similar to the approach in[2],our approach involves the use of an historical monitoring dataset in the framework so that resources can be flexibly allocated;specifically,we improve user QoE and avoid overprovisioning resources.
The importance of human-centric quality-assessment frameworks for cloud environments has been highlighted in works such as[14].The authors of[14]suggest that offline assessment and online monitoring should be based on profiles of user workloads and corresponding user QoE expectations.Our workload-generation methodology is based on the realistic emulation of user-group profiles,which are themselves based on application setsand correspondingtasks.Weuse the hierarchical-state-based workload-generation method described in[15].In this method,the behavior of the actual user of the system represents the workload characteristics at a high level.
This,in turn,results in a sequence of workload requests at the lower level that can be customized for a particular user-group profile and that are distinguishable(in our case,with marker packets)in network traces.
Along with workload generation,we use slow-motion benchmarking for network trace analysis in order to select suitable thin-client protocol configurations for particular user-group profiles.Our motivation for using slow-motion benchmarking for thin-client performance assessment is as follows:In advanced thin-client protocols(e.g.RDP and PCoIP),the server does all the compression and sends“screen scraping with multimedia redirection,”which opens up a separate channel between thethin client and server-side VD.In thisway,multimedia content can be sent in its original format to be rendered in the appropriate screen portion at the thin client.As a result,traditional packet-capture techniques using TCPdump or Wireshark do not directly allow VD application task performance to be measured.To overcome this challenge,we use and significantly expand on the slow-motion benchmarking technique originally developed in[4]and[5]for legacy thin-client protocols such as Sun Ray.In thistechnique,artificial delay is introduced between screen events of the tasks being benchmarked,and this allows isolation and full rendering of the visual components of the benchmarks.Alternative approaches have been taken in thin-client performance benchmarking toolkits[6],[7].Such approaches involve recording and playing back keyboard and mouse events at the client side.However,in early thin-client benchmarking toolkits,server-side events and thin-client objective user QoE for degraded network conditions were not modeled and mapped in an integrated way(asproposed in our approach).
In earlier studies,different thin-client protocols,such as RDP and PCoIP,have been compared using metrics such as bandwidth/memory consumption in order to determine the suitability of these protocols for different application tasks[16].Our implementation of the framework is based on our earlier work on the VDBench toolkit,which can be used for offline benchmarking of VDCs offline to create user group files based on system and network resource consumption[3].Online monitoring was not taken into consideration for the VDBench toolkit.Compared with these works,this paper deals more with the framework architecture,framework implementation,and comparison and selection of thin-client protocols in VDCs(a process that is based on offline benchmarking and online monitoring).We propose a novel composite-quality metric function that maps QoSand QoE metrics related to any of the thin-client protocols,especially dominant metrics for profiles of VD application setsof user groups.
In other works,such as[17]and[18],neural networks and regression techniques were used to establish a relationship between QoSand QoE in specific multimedia delivery contexts.We use curve-fitting techniques to obtain absolute and relative objective user QoE,which are used together to compare thin-client protocols in a broad range of degraded QoSconditions under different interactive operations.We validate these protocols by correlating them with subjective user QoE scores.The authors in[19]emphasize the need for new metrics to quantify user QoE.To date,metrics related to user QoE have not been precise,especially at thecloud scale.
3 Reference Architecture
In this section,we first describe the conceptual workflow of our offline/online objective user QoE modeling and assessment steps for VDCs.Then,we describe in detail the user workload generation and slow-motion benchmarking approaches used within thesesteps.
3.1 Conceptual Workflow
Fig.2 shows the two main steps in our VD user QoE modeling and assessment:1)offline benchmarking and modeling and 2)online monitoring.In the offline step,we collect a set of benchmarks by generating user workflow and performing slow-motion benchmarking under different emulated QoSconditions where the VDC configurations are controlled for testing.QoSemulation involves varying the delay and loss levels between the thin client and server-side VD over a broad sample range.The benchmarks are collected by averaging the results from multiple experimental runs in the form of objective QoE metrics that correspond to VD application tasks(e.g.time taken to open an Excel application,time for a video file to play,or quality of a video file playback).
The benchmark data collected for a particular user group profile with a certain application set allows a CSPto determine the VD application performance in ideal conditions.The benchmark data also provides a model for mapping how performance may degrade for different thin-client configurations in deteriorated network conditions,which are measured using common active or passive measurement tools.By analyzing VD application performance in degraded conditions,metrics that are most sensitive to network fluctuations can be identified as dominant metrics.Dominant metrics are key performance indicators,as in the case of online monitoring.They can be relied on to confirm that the VDC is functioning well and also in some cases,to diagnose the cause of unsatisfactory user QoE feedback given by actual users while using the VDC.Subjective user QoE is measured using the popular mean opinion score on a scale from one to five[20]:[1,3)is poor;[3,4)is acceptable;and[4,5]is good.Hence,models can be obtained(as closed-form expressions)for objective QoE metrics.These models are composite quality functions of dominant metrics,and higher weightsare assigned to more dominant metrics.Objective QoE metrics can,in turn,be used to correlate performance with actual user QoEmean opinion scores.
3.2 User Workload Generation
Fig.3 shows a finite-state machine used in user workload generation.It has various VD application states that correspond to actions performed by the user:productivity start(application is opened),productivity progress(application functions are in use),and productivity end(application is closed).The VD application states can be scripted using Windows GUI frameworks such as AutoIT,and these scripts can be launched on VDs within the VDC[21].The progress of these states on the server side can be measured by recording and analyzing timestamps for different actions.This can be useful for understanding the interaction response times of VDapplications perceived at the thin-client side.Controllable delays caused by user behaviors,such as think time,can be introduced for morerealistic user workload generation.

Figure3.▶Finite-statemachinefor generating user workload.
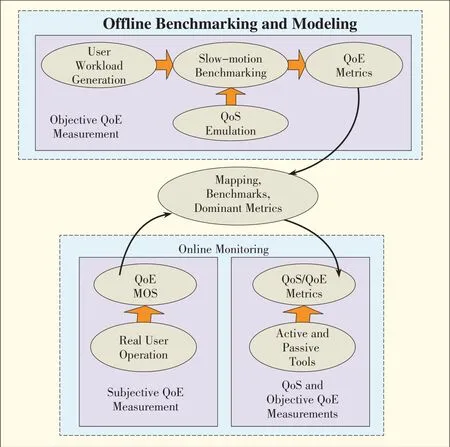
▲Figure2.Conceptual workflow for virtual desktop user QoEmodeling and assessment.
Workload templates can be created by combining a series of individual finite-state machines into a parent-state machine.These templates are used to orchestrate different VD applications,such as Microsoft Excel,Internet Explorer,and Windows Media Player,in random sequences.Depending on the workload performancemeasurement needson the VDs,thestatemachines can be modified and redistributed on the VDs by using appropriate“marker”packets.The marker packets are needed to identify the different tasks within the network traces and are sent from the workload scripts between the server-side VD and the thin client.The marker packets are sent for subsequent filtering(as part of post-processing)via ports that are not standard in protocol communications.Marker packets contain information that describes the application being tested(e.g.Internet Explorer),the activity(e.g.type of webpage being downloaded),the event start/stop timestamps,and other metadata(e.g.network conditionsemulated in thetest).
3.3 Slow-Motion Benchmarking
Figs.4 and 5 show the slow-motion benchmarking packet traces with marker packets(red dots)for PCoIP and RDP,respectively.Wireshark is used to view the packet traces and marker packets for a page with low-resolution images that is loaded in Internet Explorer.Through deep-packet inspection,we observe that artificial delays are introduced between screen events of VD application tasks,mainly to ensure that the visual components of the tasks are isolated and fully rendered on the thin client.The network packet traces are analyzed both at the client and server sides to measure VD task performance in ideal and degraded network conditions.Figs.4 and 5 show how VD task performance degrades at the thin-client side across a broad rangeof network conditions.
For the systematic emulation of network conditions,we use a Netem network emulator to introduce combinations of 0 ms,50 ms,and 200 ms delay and 0%and 3%losses between the client side and server side[22].These combinations are typical for well-managed,moderately well-managed,and poorly managed network paths on the Internet and are used hereafter as a representative sample space of network conditions to describe our proposed composite-quality modeling approach.They also are sufficient for showing the best-case and worst-case performance of the VD application tasks.More detailed samples of network conditions may be considered in order to obtain finer-grained composite-quality models.However,such data collection and modeling is beyond the scope of thispaper.

▲Figure4.PCoIPslow-motion benchmark tracesfor apagewith low-resolution imagesloaded by Internet Explorer.
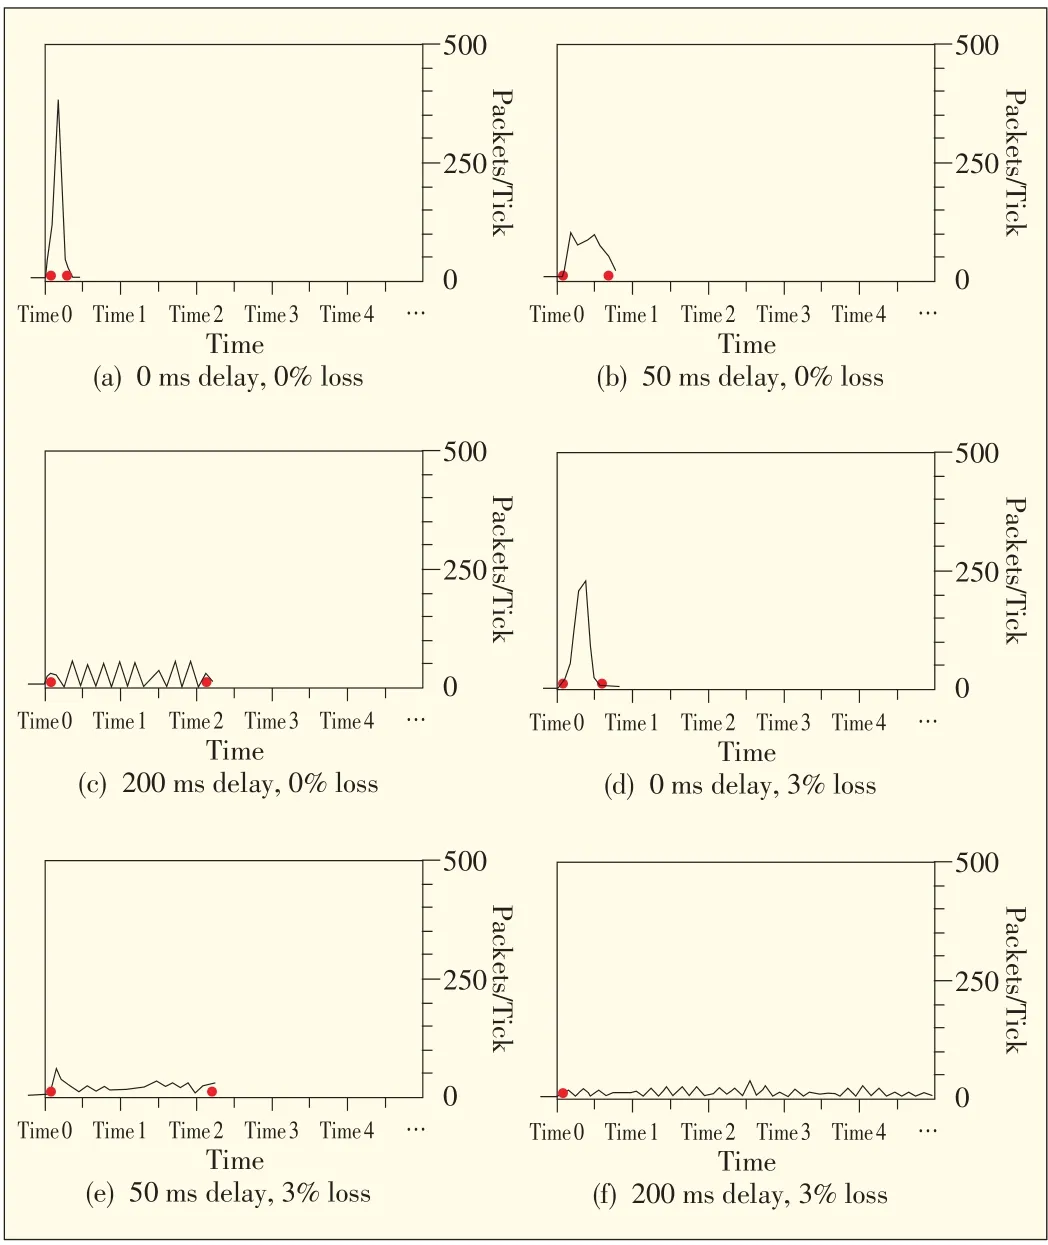
▲Figure5.RDPslow-motion benchmark tracesfor apagewith low-resolution imagesloaded by Internet Explorer.
Performance differences are apparent in the crispness of network utilization patterns and in the higher bandwidth consumption(indicated by the packet count along the y axis)and lower task times in ideal conditions.In degraded conditions,bandwidth consumption is lower and task times are longer.In addition,Figs.4 and 5 show how the popular PCoIP and RDP thin-client protocols handle the degraded conditions while completing a particular application task(e.g.loading a page with a low-resolution image in Internet Explorer)and applying protocol-specific compensations.The compensations manifest in thetransmission of thevisual componentsof the VDapplications to the client side and affect remote user consumption and productivity.Ultimately,the compensations affect user QoE.
PCoIP provides the same satisfactory user QoE as RDP in ideal conditions but consumes less bandwidth.Compared with RDP,PCoIPhasatighter renderingtime,even in theworst cases(i.e.delay 200 ms and loss 3%),in our sample space.If the values for delay and loss are greater than those we chose for the worst-case network degradation,user QoE is always poor(as is evident in the slow-motion benchmarking traces).Hence,higher sample values were not used in our setup.This difference is due to the fact that PCoIPuses UDPas the underlying transmission protocol,whereas RDPis based on TCPand retransmits when network conditionsare lossy.
4 Composite Quality Formulation
In this section,we describe the closed-network setup and experiments used to formulate the composite quality functions for PCoIPand RDPthin-client protocols.
4.1 Closed-Network Testbed
Fig.6 shows the reference architecture described in section 3 implemented as a VDBench benchmarking engine in a VDC at VMLab[23].The physical components are set up and interactions are organized in three layers:thin-client sites,middleware services,and server-side VDs.At the thin-client sites,an offline,closed-network testing environment is used to formulatethecomposite quality functions.In the validation experiments described in section 3,the same infrastructure is used for themiddlewareservices and server side;however,they connect via the Internet from geographically distributed locations.We set up two VD environments,one with the open-source Apache VCL[24]and the other with VMware VDI[25].The default thin-client protocols for VD access in the Apache VCL environment was RDP,and the default thin-client protocol for VDaccessin the VMwareenvironment was PCoIP.
The VDBench benchmarking engine automates and orchestrates 1)initial workflow steps 1 to 5 shown in Fig.6,2)the use of RDPor PCoIPto set up a thin-client session,and 3)the final objective user QoE measurements obtained by integrating user workload generation and slow-motion benchmarking in various network conditions.Our implementation can be easily deployed in any existing VD hypervisor environment(e.g.ESXi,Hyper-V,and Xen)and relies on APIs to authenticate and authorize VDrequests and allocate and reserve resources.Utilitiessuch aspsexec areused to remotely invoke workload-generation scripts;hence,our implementation can also be used to instrument existing thin-clients based on Windows or Linux platforms,such as embedded Windows 7,Windows/Linux VNC,Linus Thinstation,and Linux Rdesktop)[8],[9].Moreover,our implementation allows for the storing of performance measurements and for the joint analysis of system,network,and application performance in order to measure and monitor VDuser QoEonline.
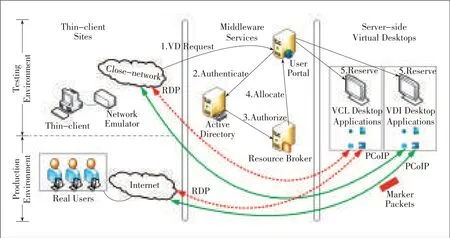
▲Figure6.User QoEmodelingand assessment framework:Physical component setup and interactions.
4.2 Closed-Form Expressions
Table 1 shows the objective QoE metrics collected by the VDBench benchmarking engine.Although we collected and analyzed more than 20 metrics,we only chose seven(M1to M7,Table 1)that were observed to significantly affect user QoE as network conditions degraded for both the RDPand PCoIPprotocols.We ignored the metrics of tasks whose packet count variations over task times were not significant in the best and worst network conditions.Such metrics are not helpful in identifying QoEbottleneck scenariosin VDapplications.
Metrics M1to M6are obtained by subtracting the timestamps between the marker packets and comparing them with the ideal QoSvalues.However,M7is calculated differently:A video is first played back at 1 frame per second(fps)in an atomic manner,and network trace statistics are captured.The video is then replayed at full speed a number of times in an aggregate manner using the thin-client protocol being tested and in various network conditions.A challenge in comparing the performance of UDP-based and TCP-based thin-client protocols in terms of video quality is to derive a normalized metric.The normalized metric should account for fast completion times with image impairments in UDP-based thin-client protocols(as opposed to long completion times in TCP-based thin-clients with no impairments but long frame freezes).To meet this challenge,we use the video quality metric given by(1)and originally developed in[5].The M7metric relates slow-motion atomic playback to full-speed aggregate playback in order to determine how many frames are dropped,merged,or otherwise not transmitted.

▼Table1.Notation

Of these seven metrics,those that were most sensitive to change in network conditions are the more dominant metrics that affect user QoE.For other application sets and user expectations of VD application performance,the number of metrics may vary.In any case,the composite quality function used to predict user QoEgiven n metrics{M1,M2,...,Mn}can be calculated using a general form,W1M1+W2M2+...+WnMn,where each metric Mifor i∈{1,n}has a corresponding weight Wifor i∈{1,n}.Each corresponding weight is based on how sensitive the metric is to network degradation or how much of a key performance indicator the metric is.We assign a weight by calculating the change in the measurement value of the metric per unit change in QoS(i.e.the change in delay and loss).Table 2 shows the normalized weights of the dominant metrics derived for PCoIP and RDP protocols from the packet traces in our closed-network testbed experiments that involved the systematic emulation of network conditions described in section 3.3.By combining these weights and metrics,we derive a closed-formexpression(2)that can beused to predict thecomposite-quality function for our setup:

Equation(2)is derived through trial and error with increasing complexity in relation to(1)in order to obtain closed-form expressions that best fit the training data curve.Because the dominant metrics in our case were the same for both RDPand PCoIP,the same equation can be used to estimate CQS for RDP and PCoIP.Note that M7was found to be a highly dominant metric compared to the rest of the metrics;hence,we used the square root of this metric to balance its influence in relation to M1to M6.
To compare the thin-client protocols in relative and absoluteterms,wegive RCQSand ACQSas

RCQS and ACQS are normalized between 0 and 1 and are given as percentages.They are calculated using the CQS for the current,ideal,and worst network conditions for RDP and PCoIP thin-client protocols.In our experiments,CQScurr,the composite-quality score being calculated for a given network condition,is compared with the CQSfor ideal(0 ms,0%)and worst-case(200 ms,3%)delay and loss.This allows us to compare how well user QoE performance conforms to ideal performance(the relative objective QoE score)for a thin-client protocol being tested.Moreover,it allows us to compare the thin-client protocols that may have different weights applied to the same metrics in degraded conditions(the absolute objective QoE score).Tables 3 and 4 respectively show RDP and PCoIP composite-quality calculations in relation to the RCQS and ACQS values obtained in our closed-network testbed.RDPand PCoIPprotocolsperformdifferently in different application contextsand network conditions.
5 Validation of Results
In this section,we validate our composite-quality modelingand assessment methodology in a real-world VDC.We describe how the validation testbed was set up for user trials.Following this,we give the results of our analysis of subjective and objectiveuser QoEmeasurements.
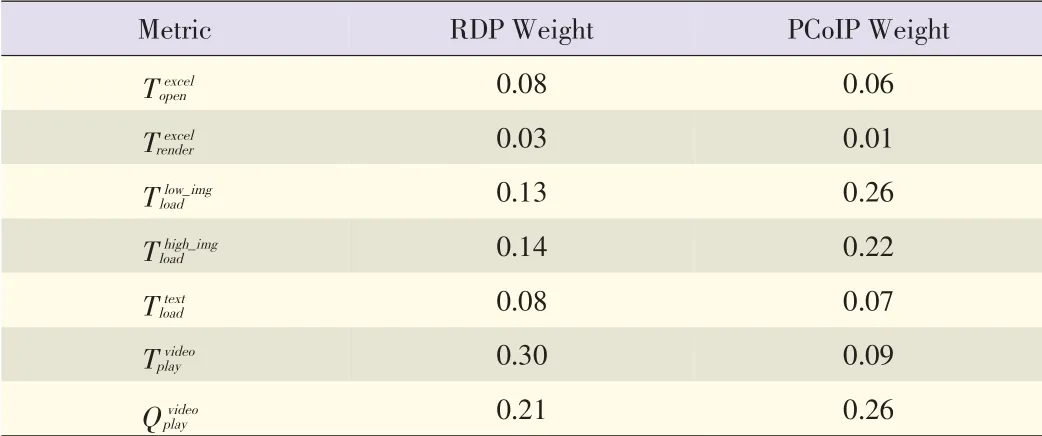
▼Table2.Normalized weightsshowingdominant metrics
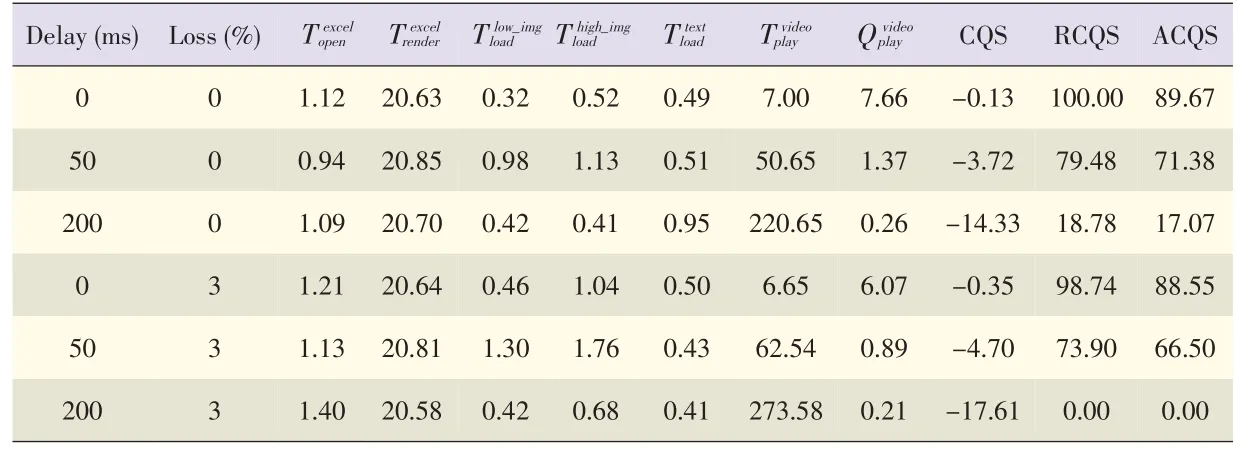
▼Table3.RDPcompositequality calculationsin closed-network testbed

▼Table4.PCoIPcompositequality calculationsin aclosed-network testbed
5.1 VDPilot Testbed
We used the production environment shown in Fig.6,which is similar to the testing environment(without the network emulator),as a VDPilot testbed for our validation experiments.The testbed uses RDPand PCoIPthin-client protocols,and actual users are present in virtual classrooms within a federated university system.A total of 36 users registered in the VDPilot,most of whom were faculty and students from diverse selection of Ohio-based universities.These universities included Ohio State University,University of Dayton,University of Akron,Ohio University,Denison University,Walsh University,Sinclair University,Ashland University,and Baldwin Wallace College.
As part of subjective testing in the VDPilot testbed,participants were asked to compare Apache VCL(configured with default RDP)with VMware VDI(configured with default PCoIP)remote thin clients while using Excel,Windows Media Player,and Internet Explorer to complete tasks in VDs.After completing the subjective tests,participantswere asked to complete an online survey to provide feedback about their perception of QoE while accessing VD applications with Apache VCL and VMware VDI.
Subsequently,the participants were asked to perform objective QoEteststo more objectively compare user QoEat the different sites and eliminate any outlier biases or mood effects of the participants that may have affected their subjective judgment of VD application QoE.As part of the objective QoE testing,participants downloaded,installed,and ran the OSC/OARnet VDBench software shown in Fig.7 for both Apache VCL and VMware VDIremote thin clients.The installation prerequisites included the latest Java runtime environment,Wireshark,and two clients in the form of JAR files(one for Apache VCL and the other for VMware VDI).The VDBench client software implements the client-side aspects of our user workload generation and slow-motion benchmarking methodologies explained in sections 3.2 and 3.3.It can run on both Windows and Linux platforms and is capable of NICselection to initiate tests.It interacts with the VDBench benchmarking engine at the server side through messages encoded in marker packets.It can also be securely used in VDCs because it requires a participant to input a username and password that is valid in the Active Directory on theserver side.
The VDBench client executes a series of automated tests over several minutes.These tests are performed in the participant's remote thin client in order to simulate or mimic the actions performed by participants during subjective testing over the Internet.While performing the tests within an Apache VCL or VMware VDI instance,the software records interactive application response times and video playback quality metrics(M1to M7,Table 1).Thisquantitative performance information can be used to identify bottlenecks and can be correlated with subjective user QoE ratings,that is,the mean opinion scores of participants.Measurements taken during a test run in an instance of either Apache VCL or VMware VDIaredisplayed tothe user in the VDBench client user interscores are the averages of the user QoEfeedback.The absolute mean opinion scores for both RDP and PCoIP were greater than four(i.e.PCoIPwas 4.74 and RDPwas 4.21),which is in the“good”range of user QoE.In addition,the ACQSs were high and correlated with the baseline results from the closed-network testbed for a network with approximately 50 ms delay and 0%packet loss.Such correlation was expected given that the participants were dispersed over a regional wide-area network.Thus,we were able to determine that the VDCinfrastructure configuration used in the VDPilot case had no inherent usability bottlenecks and could provide satisfactory user QoEfor Ohio-based universities.face,and a copy of these measurements is automatically stored in adatabaseon theserver side.

▲Figure7.Java VDBench client.
5.2 Correlating Subjective QoE Measurements
Table 5 shows the subjective and objective user QoE results from testing in the VDPilot testbed.Absolute mean opinion

▼Table5.Correlation resultsfor subjectiveand objective QoEmeasurements
We also observed that the AMOSs closely correlated with the objective user QoE measurements given by ACQSand calculated using(4)for both the RDP and PCoIP protocols.Further,we can conclude that the PCoIP thin-client protocol is more suitable than the thin-client protocol for the virtual classroom lab use cases.The PCoIPACQSwas 95.76,and the RDP ACQSwas 81.11.ACQSis a more relevant objective QoE metric than RCQSfor making a comparison with AMOSbecause we are comparing the performance of two different thin-client protocols.
6 Conclusion
In thispaper,wehave presented a novel,human-centric reference architecture and described how it can be used to model and assessobjectiveuser QoEin VDCswithout theneed for expensive,time-consuming subjective testing.The architecture incorporates finite-state machine representations for user workload generation and also incorporates slow-motion benchmarking,in which deep packet inspection is used to determine the performance application tasks affected by QoS variations.In this way,a composite-quality metric model of user QoE can be derived.We have shown how this metric can be customized to a particular user-group profile with different application sets and can be used to a)identify dominant performance indicators and troubleshoot bottlenecks and b)obtain both absolute and relative objective user QoE measurements needed for pertinent selection of thin-client encoding configurations in VDCs.
Our framework and its implementation in the form of a VDBench benchmarking engine on the server side and Java-based VDBench client on the thin-client side can be used by CSPs within existing VD hypervsior environments(e.g.ESXi,Hyper-V and Xen)and can be extended to instrument a wide variety of existing thin clients based on Windows and Linux platforms(e.g.embedded Windows 7,Windows/Linux VNC,Linux Thinstation,and Linux Rdesktop).CSPs can use our framework and implementation to monitor VD user QoE by jointly analyzing system,network,and application contexts.This ensures that a CSP's VD users are satisfied,VD applications are highly productive,and VDC support costs are reduced becauseperformanceismoretransparent.
We validated our composite-quality modeling and assessment methodology by using subjective and objective user QoE measurements in a real-world VDC called VDPilot,uses RDP and PCoIP thin-client protocols.In our case study,actual users were present in virtual classrooms in a regional,federated university system.There was high correlation between the subjective and objective user QoEresults fromtesting,and this allowed us to determine that PCoIP was the more suitable thin-client protocol for the virtual classroom case.We also determined that the configuration of the VDC infrastructure for this case had no inherent bottlenecks and could provide satisfactory user QoEover the Internet at aregional level.
Acknowledgements
This material is based on work supported by VMware and the National Science Foundation under award numbers CNS-1050225 and CNS-1205658.Any opinions,findings,and conclusionsor recommendationsexpressed in thispublication are those of the author(s)and do not necessarily reflect the views of VMware or the National Science Foundation.
- ZTE Communications的其它文章
- ZTEConverged FDD/TDDSolution Wins GTIInnovation Award
- Introduction to ZTECommunications
- Android Apps:Static Analysis Based on Permission Classification
- Data Center Network Architecture
- FBAR-Based Radio Frequency Bandpass Filter for 3GTD-SCDMA
- Battery Voltage Discharge Rate Prediction and Video Content Adaptation in Mobile Deviceson 3G Access Networks

