
THE NATURAL CONVECTION OF AQUIFERS WITH CONSTANT HEAT SOURCES AND ITS INFLUENCE ON TEMPERATURE FIELDS*
2012-08-22 08:31:49LIUGuoqingZHOUZhifang
水动力学研究与进展 B辑 2012年4期
LIU Guo-qing, ZHOU Zhi-fang
School of Earth Science and Engineering, Hohai University, Nanjing 210098, China, E-mail: lgqno111@126.com
(Received December 6, 2011, Revised May 4, 2012)
THE NATURAL CONVECTION OF AQUIFERS WITH CONSTANT HEAT SOURCES AND ITS INFLUENCE ON TEMPERATURE FIELDS*
LIU Guo-qing, ZHOU Zhi-fang
School of Earth Science and Engineering, Hohai University, Nanjing 210098, China, E-mail: lgqno111@126.com
(Received December 6, 2011, Revised May 4, 2012)
By combining sand tank tests with numerical simulations, this paper studies the temperature fields around constant heat sources to reveal the mechanism of the natural convection and its influence on the temperature fields in the process of energy storage. Using the “24-channel temperature auto acquisition system” developed by our research group in the tests, the temperatures are recorded at measuring points within the research area in the tests, the revised Brinkman equation and a transfer-convection balance model are used for solving the aquifer water-thermal coupling problems, and through comparison of the test results with the calculation results, it is discovered that the influence ranges and the variations of the two temperature fields are consistent, which validates the mathematical model. On the basis of this, we also study the influences of the heat source positions and the boundary conditions on the temperature fields, and the results show that, under the natural convection, the heat source positions may influence the distribution of the temperature fields, thus affect the energy storage. For the same energy storage layer, the temperature field for the top energy storage is characterized by a smaller heat influence range and a relatively concentrated temperature distribution. However, when the heat source is at the bottom, the range of a temperature field, and the temperature is relatively dispersed, which is not favorable to heat recycle, with the same heat source position, the boundary conditions determine the size of the critical Rayleigh number, and thus have an influence on the occurrence and the strength of the natural convection, and accordingly, on the temperature fields.
porous media, natural convection, water-thermal coupling, sand tank test, numerical simulation
Introduction
The underground aquifer energy storage is a new energy saving and environmental protection technology closely related with the development of the heat pump technology, and is one of the most effective ways to face the challenges in the energy crisis and to expand energy resources[1]. It is very important to accurately predict the distributions of the temperature fields around energy storage wells for the effective recovery of the stored energy, which are influenced by the flow and the heat transfer, and are the couplingresults of two physical fields in the same medium, the velocity field and the temperature field. The mass, the momentum and the energy transfer are issues of porous media, and concern with many areas, and constitute the basic processes of many natural phenomena[2]. The underground hot and cold water explorations, the oil explorations, the nuclear waste disposals, the enhanced heat transfers and other related engineering projects provide the researches of the heat and mass transfers of porous media with broad practical backgrounds, and also serve as potential growth points to form an inter-discipline. The natural convection heat transfer driven by the thermal buoyancy force in porous media has received a considerable attention in the past decades[3], due to its importance in many geophysical and engineering applications. Such applications include the movement of contaminants in the groundwater, the moisture transport in a thermal insulation underground, the geothermal and nuclear energy development and utilization technology, and the grain storage installations[4]. Much effort is focused
on
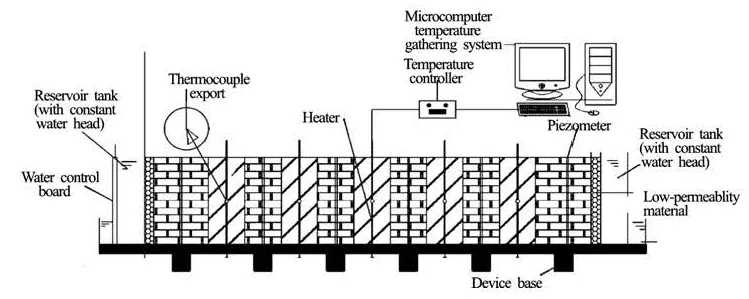
Fig.1 Sand tank simulation system
thetheoretical studies, the mathematical models and the numerical solutions of the heat migration under complex conditions. The natural convection arising from the vertical constant heat source studied in this paper is the horizontal convection, which is caused by the temperature gradient in the horizontal direction[5]. In the coupled water-heat fields, the convection can be divided into the forced convection through the external hydraulic gradient and the natural convection caused by the uneven distribution of temperatures. In the process of heat migration of a natural groundwater flow system, the forced convection plays a leading role, and the general groundwater heat migration is by and large a forced convection, and the natural convection may only be considered as a factor. However, in the deep rock groundwater migration, due to the high temperature, the natural convection can not be ignored[6]. It is recognized that the heat exchange model of the natural convection sees successful applications in the aquifer[7], but experimental studies of the natural convection coupled with the aquifer thermal energy storage and hydrothermal processes are rare, Nagano et al.[8]numerically simulated the influence of the natural convection on the aquifer temperature fields with the presence of the forced convection in the porous media, and it is concluded that in the calculation of the aquifer temperature field, it is necessary to consider the natural convection; Zhang et al. (1999) established a new model of the aquifer energy storage by considering the impact of the temperature gradient on the water flow, and it is shown that when the temperature difference at various points is not significant, the impact of the temperature gradient on the groundwater flow can be ignored. From the previous studies, it can be seen that under the isothermal conditions, a mathematical model can be built to describe the process of the underground water flow at room temperature (low temperature difference), but when the groundwater in the aquifer media is a hightemperature (or high temperature difference) fluid, the temperature-dependent density of the groundwater will influence the process of the underground flow, its viscosity will also be affected, and the flow equation established under the conventional assumptions and conditions will not be adequate to describe the flow process of the underground water at high temperature or high temperature difference[9,10]. There is no relevant study made to judge when the natural convection is present in the process of the heat migration, there are no enough indoor porous media energy storage tests, and test data, and especially no enough numerical calculations and experimental verifications to show whether in the coupled water-heat migration, the influence of the natural convection on the temperature field can be ignored in the energy storage project. According to previous research results on the influence of the natural convection in the aquifer heat transport, the aquifer is affected by the horizontal flow of the original groundwater in a long time period, the permeability coefficient in the horizontal direction would be far greater than that in the vertical direction, therefore, the natural convection is difficult to work. Studies show that a significant natural convection can be present only when the seepage velocity is small. In this paper, based on the indoor sand tank experiments and numerical simulations, the natural convection in aquifers under conditions of constant heat sources and its influence on the temperature fields are studied. With considerations of the flow of water in porous media due to density changes caused by temperature changes, by means of introduction of Bujalsk items, the free convection problem is defined, the temperature change is introduced into the Brinkman equation, and then the fluid velocity obtained in the Brinkman equation is used in the heat transfer application model to obtain the solution. The comparative analysis of the test results and numerical results shows the feasibility of test methods and the validity of the simulation results.
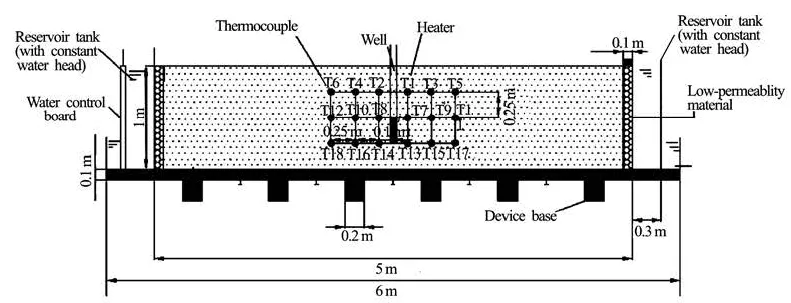
Fig.2 Geometry and layout of the model
1. Experiments
1.1 Experimental apparatus
An indoor sand tank simulation test system is built, as shown in Fig.1, which is composed of four main components: the sand tank body, the water-level adjusting device, the constant heat control device and the 24-channel temperature acquisition system. The sand tank is 5 m in length, 0.4 m in width and 1 m in height, the simulation well is 0.015 m in inner diameter, with a drainage device at the bottom to control the pumping and the drainage flows in order to adjust the aquifer hydro geological parameters, and with a constant heat source closed and fixed in the simulation well. The main function of the heat source of 0.25 m in length, is to simulate the water body in the upper and lower closed spaces of the simulation well for constant temperature heating. The heat is exchanged with the aquifer through the wall, and during heating, a temperature controller maintains a constant temperature of the heat water source to ensure the heat output to the aquifer at a constant heat power.
In the system, the density, the average particle size, the thermal conductivity, the permeability and other physical parameters for the heat reservoir sand remain unchanged during the test. To study the influence of the natural convection caused by the uneven distribution of temperatures on the temperature fields, this paper takes measures to eliminate the effect of the forced convection on the test results, the water inside the porous medium can flow freely within the model, but not out from the inside of the model, and the convection can only exist in the form of the natural convection. Therefore, the density difference caused by the temperature difference during the test is the only driving force for the natural convection, and the fluid flow and heat transfer characteristics in the presence of the heat sources in the well can reveal the nature of the natural convection and its effect on the temperature fields caused by the internal heat sources.
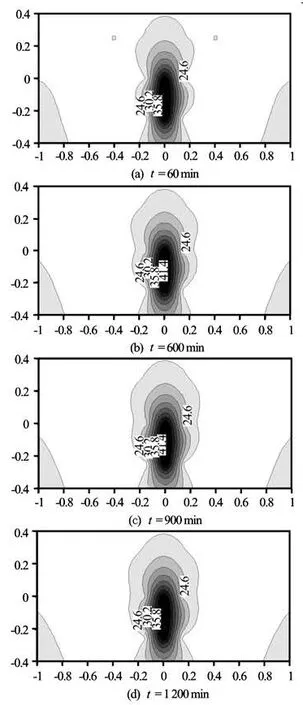
Fig.3 (Test I) for constant heat source temperature 45oC (Ra=15.36), the temperature fields at different time instants
In the model, the aquifer top is a constant tempe-rature boundary, the bottom and both sides are the adiabatic boundaries. Figure 2 shows the geometry of the model and the layout diagram of probes in the porous media aquifers. Using the DS18B20 temperature sensor, the temperature on the heat source center section is measured, and the measuring points are arranged at different depths and radial distances, to reflect the distribution of the temperature fields during the heat migration.
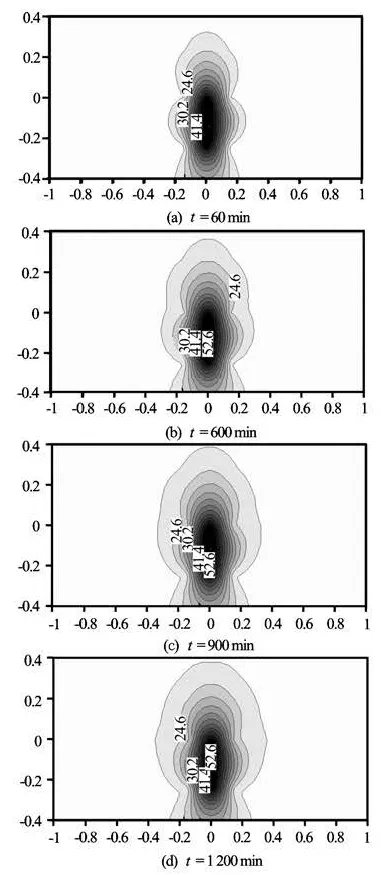
Fig.4 (Test II) for constant heat source temperature 54oC (Ra=20.27), the temperature fields at different time instants
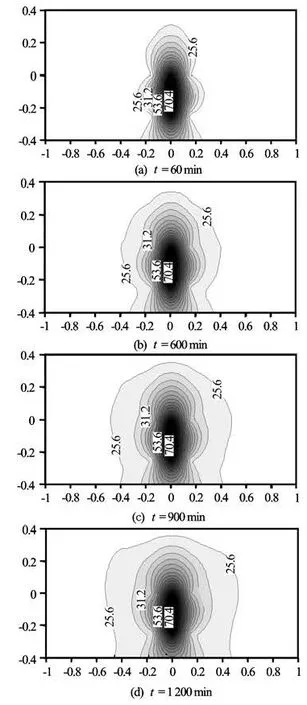
Fig.5 (Test III) for constant heat source temperature 72oC (Ra=29.48), the temperature fields at different time instants
1.2 Analyses of experimental results In the experiment, three constant heat sources are chosen, i.e., those of 45oC, 54oC and 72oC, and the characteristics of a temperature field varying with time under different conditions of heat sources are obtained. Based on the temperature data of measuring points, using surfer software, two-dimensional section isothermal diagrams of temperature distribution under temperature conditions of different heat sources are obtained, as shown in Figs.3, 4 and 5. The overall characteristics are shown in cases under the same heat source, and it is shown that the temperature field range expands over time, and the heat migration is slow when the difference between the heat source temperature and the background temperature is small. As the heat migration process goes on, the temperature field distribution gradually changes from a symmetrical shape with the heat source as a center into a left and right symmetrical distribution with the “Ω”shape, large in the top and small in the bottom, and this feature is intensified with the increase of the temperature of the constant heat source, and the shape of the temperature field is different from a pure temperature diffusion process of the heat transfer. With the same temperature increase for the heat source, thechange of the shape of the temperature fields in Figs.3 and 4 is obviously less than that in Figs.4 and 5, due possibly to the natural convection. It is understood that the portion of the natural convection in porous media is strongly dependent on the Rayleigh number Ra, which determines the flow characteristics of water in porous media. Usually, the revised Rayleigh number Ra of porous media is defined as[11]
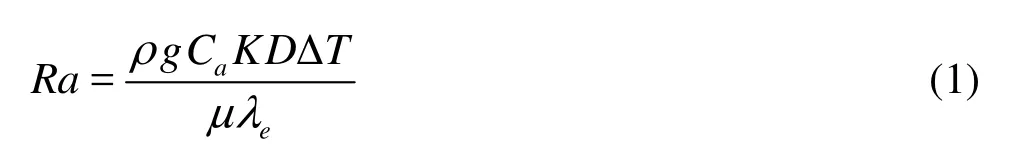
where TΔ is the temperature difference between the heat source temperatures in porous media in the horizontal direction, D is the horizontal distance from the heat source to the boundary,aC is the volumetric heat capacity,eλ is the effective thermal conductivity, μ is the dynamic viscosity of water, and ρ is the reference density.
Based on the revised calculation formula for the Rayleigh number Ra of porous medium, the Rayleigh numbers corresponding to the three temperatures 45oC, 54oC, and 72oC in the test are 29.48, 20.27 and 15.36, respectively, and by comparing with the boundary conditions of this test, Neild[12]gives the critical Rayleigh number
From the results at the temperature measuring points, two-dimensional profiles of the temperature field are obtained, and it is found that under the action of a constant temperature heat source, during the heat transfer, a part of the heat is absorbed by the aquifer, causing the temperature increase in the aquifer, the other part of the heat is dissipated through the sand tank model boundary, and both processes can lead to the change of the aquifer temperature gradient, thus affecting the distribution of the temperature fields. From the three groups of tests, the curves of the temperature value vs. time at the same measuring point T are obtained, as shown in Fig.6. It can be seen that, the temperature-time curve of a point in the aquifer is divided into two sections, a rapid warming section and a smooth section, and the temperature of the porous media in the rapid warming section can reach at least 95% of the final equilibrium temperature in a short time. During the pre-heating, the temperature at a measuring point increases rapidly at the beginning of heating, the temperature gradient between the aquifer and the heat source is large, so is the heat transfer rate. In the continuation of the heating time, the aquifer continues to absorb heat from the heat source, the temperature gradually approaches the temperature of the heat source, the temperature gradient between the heat source and aquifer gradually decreases, the heat transfer rate begins to decline until it is equal to the rate of dissipation of heat through the boundary. At this time, the heat budget of the aquifer reaches an equilibrium, the temperature stabilizes, and the time for reaching a stable state is proportional to the rise of the heat source temperature. The analysis of the test phenomena shows that for the purpose of numerical calculations, the final steady-state temperature field can be chosen for the study.
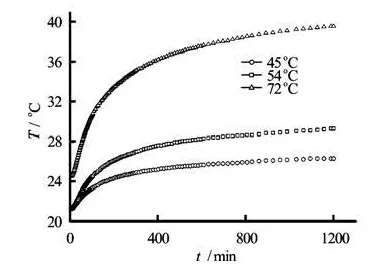
Fig.6 Temperature vs. time curve of the measuring point T at different heat source temperatures
2. Physical assumptions and mathematical models
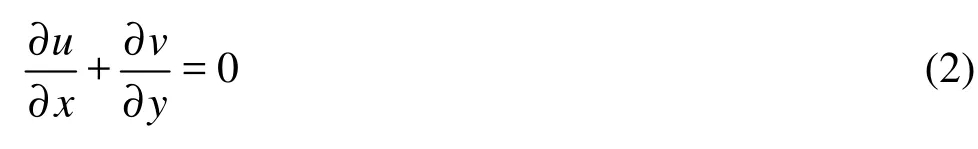
The water-heat coupling in the test tank is a seepage issue for the single-phase incompressible liquid in porous media. The porous medium aquifers are homogeneous and saturated with water, and the watersand is in a local thermal equilibrium. In addition, due to the small enough water density gradient caused bythe heat dispersion and the temperature difference in the porous media aquifer, the Boussinesq assumptions can be valid as an approximation[13], and as the characteristic dimension of the study object is much larger than the mean free path of the heat-carrying porous medium particles, the continuous media assumption is valid. This paper is to discuss the influences of the natural convection on the temperature fields in a large scale porous medium by the method of numerical methods within the range of the valid continuous medium assumption. Based on the above assumptions, we can get continuity momentum and energy conservation Eqs.(2)-(5), which are expressed as follows in the two-dimensional Cartesian coordinates:

where u and v are the velocity components of fluid in the x and y directions, t is the time, P is the pressure,0Q is the constant heat generated by the heat source, T is the temperature, g is the gravity acceleration, ρ is the reference density, κ is the permeability of the aquifer sample,eα is the effective thermal diffusion coefficient,Tβ,fμ andpC are the aquifer thermal expansion coefficient, the dynamic viscosity coefficient and the specific heat capacity at a constant pressure, respectively. In Eqs.(3)-(4), the porous medium aquifer permeability κ can be defined by the Darcy’s law[6]as
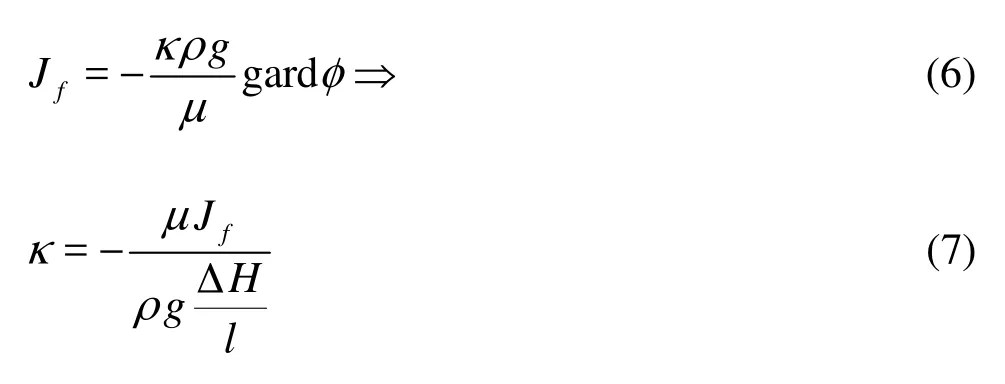
wherefJ is the speed flux, HΔ is the water level difference across the sand tank, l is the aquifer width in the flow direction. Based on the Maxwell model, this paper calculates the total thermal conductivity of the porous media

Fig.7 The initial and boundary conditions in the simulation and the sand tank test
eλ[14]
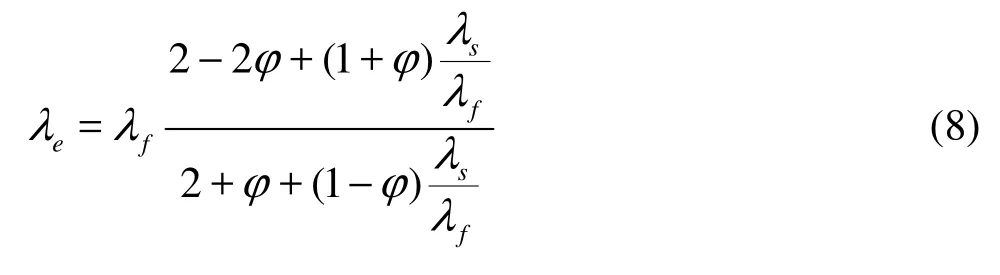
wheresλ andfλ are the solid and the liquid thermal conductivity of the aquifer, respectively. The effective thermal diffusivity of the porous mediaeα is calculated according to Equation
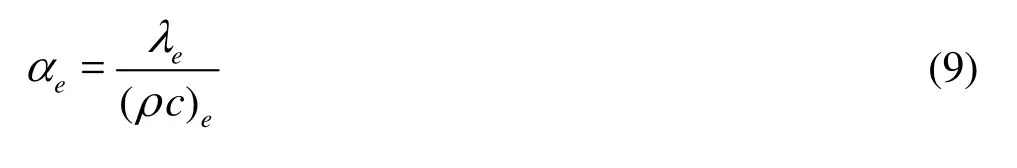
where
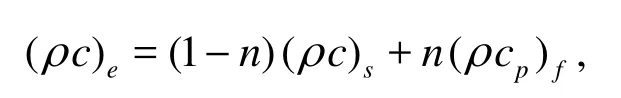
λeis the effective thermal conductivity, ρ is the corresponding density of the different state, C and Cpare the specific heat of the solid phase and the specific heat of water at a constant pressure, respectively, and the subscripts s and f represent the solid and the liquid phases.
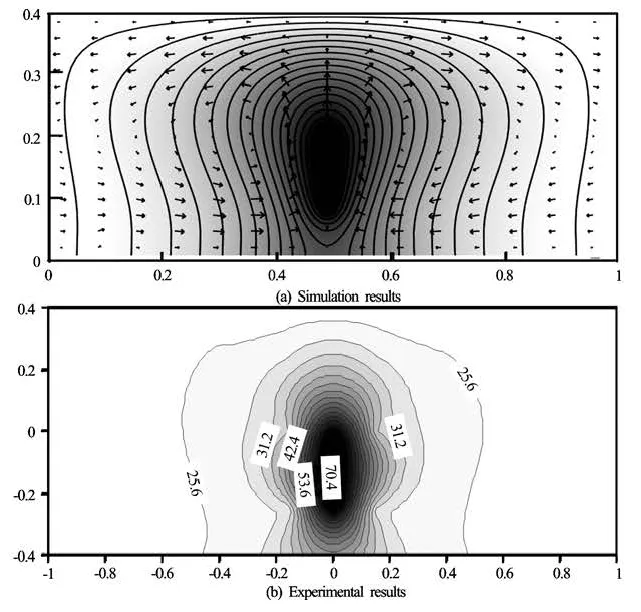
Fig.8 Comparison of temperature field patterns for the numerical simulation results and test results
The initial and boundary conditions are shown in Fig.7.
To calculate for models of different sizes, we can define the model properties by using the dimensionless quantities and through the dimensionless treatment. The dimensionless variables and dimensionless equations are as follows:
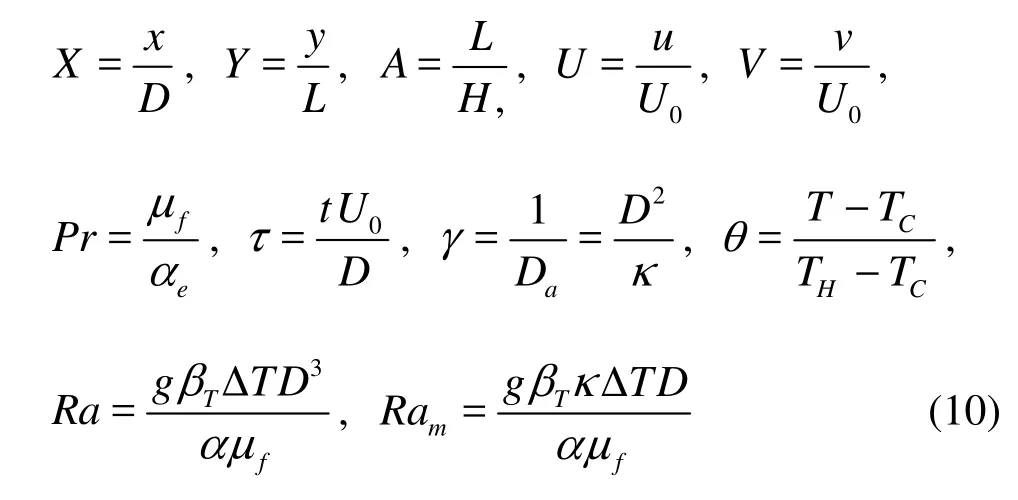
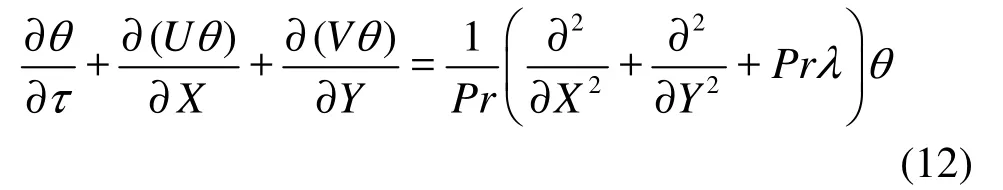
in which Ramis the Rayleigh number, Pr is the Prandtl number, γ(=1/Da) the porosity parameter. With the definitions in Eqs.(10), Eqs.(3)-(5) are turned into:

where
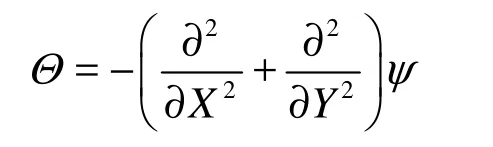
is the vortex function. To eliminate the stress phase, the stream function is defined as follows:
The dimensionless initial and boundary conditions are:
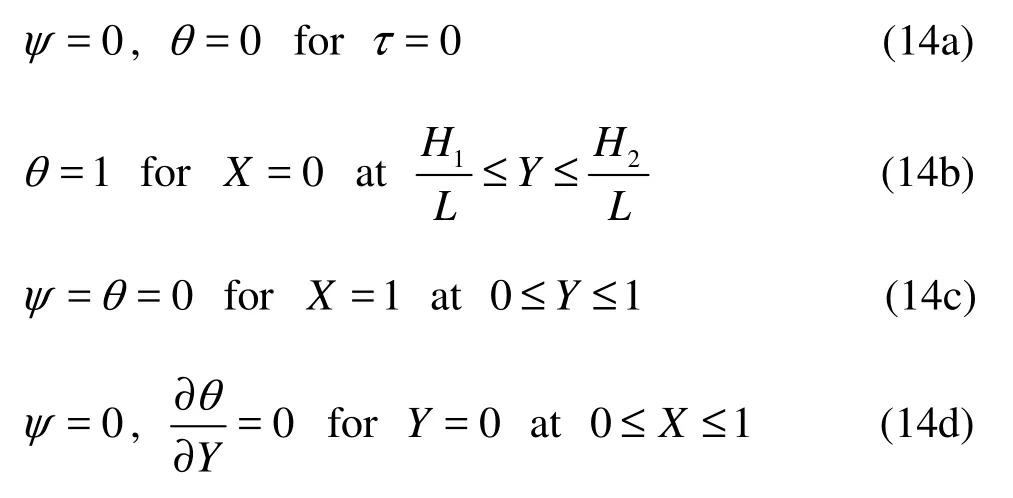

In the above expressions, X and Y are the dimensionless coordinates, U and V are the dimensionless velocity components, τ is the dimensionless time, θ is the dimensionless temperature, and ψ is the stream function, D, H and2H,1H are the the width and the length of the model and the heat source, respectively.
In this paper, COMSOL Multiphysics 3.5 multifield coupling software is used for the numerical calculation and the built-in physical model is modified by programming codes developed by our research group. In addition, the computational domain is discretized into the unstructured triangular element grid. In the calculation, the discretized dimensionless equations based on the control volume method are used, and for the strongly nonlinear problem described above, it is quite difficult to obtain a converged solution with any non-linear solver. Even if there is no new Boussinesq item, the Brinkman equation is nonlinear, in order to reduce the difficulty of the numerical simulation, in front of the Boussinesq item gρβ(T-T0), a relaxation damping factor is added to help gradually reach the static initial conditions for solving the real problem, when ω=0 (where ω is relaxation factor), there is no coupling in the flow and temperature equations, so the convergence is easy to reach for the model, then the damping factor increases gradually, with the previous solution as the initial value for the solution of parameters in a next step until the ω=1. For the solution, the Gauss-Seidel method is used in iteration and with the Successive Over-Relaxation (SOR) method, the convergence is accelerated. The convergence judgment is based on the relativechangeerrorsfor the dimensionless temperatures on all lattice points, which should be less than10–6, expressed as follows
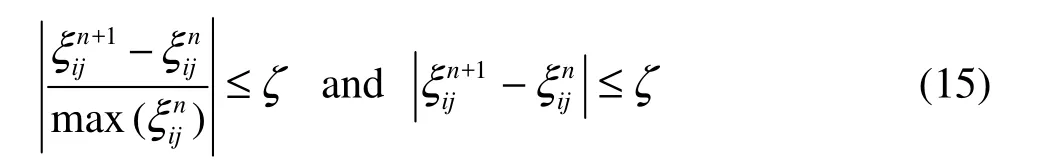
where, for ψ and T, ζ=10-6, the superscript n is the number of iterations, and i,j are subscripts.
3. Numerical simulations and discussions
Figure 8(a) is the simulation results obtained by considering the same heat source and boundary conditions as in Test III of the sand tank, which are compared with the rest results in Fig.8(b), where the isotherms reflect the impact of the natural convection on the temperature. The distribution of isotherms at the bottom of the heat source is denser than that on the top, and the temperature gradient is greater. This is decided by the flow mode of the natural convection in porous media under such conditions, and the arrow diagram of the velocity field gives a good description of the flow characteristics, in which the temperature of the central heat sourcehT is higher than that near the porous mediumcT. The fluid near the heat source, under the action of buoyancy, moves upwards, and meanwhile; the fluid in the vicinity of the left and right interfaces flows downwards. As seen from the diagram, the generation of the vertical wall natural convection[15]makes the fluid being accumulated in the upper left and the lower right to form a high-pressure center, so in the horizontal direction, produces a forced flow due to the pressure difference. We can see from the diagram that the temperature field patterns for the numerical simulation results and the test results are consistent.
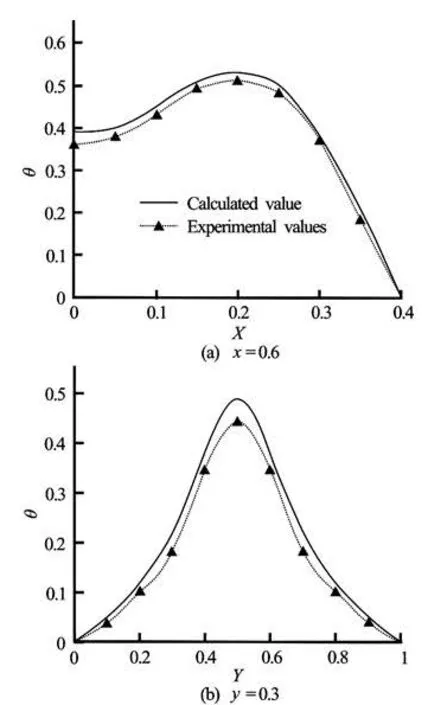
Fig.9 Comparisons of dimensionless temperature test values and the calculation values for =0.6x and =0.3y sections
To further compare the simulation results and the test results, the vertical section =0.6x and the cross section =0.3y are considered in the simulation results as well as the dimensionless temperature curves for calculated values and test values on the sections. In Fig.9, the measured dimensionless temperature is converted as in formula (10), and the resultsshow the consistency of the temperature change trends. The temperature change trend reflects well the effect on the temperature fields under the action of the natural convection, but there is still a fitting error to consider, and the calculated value is smaller, mainly because of test errors. This paper shows that it takes a fairly long time for the temperature field, under the action of a constant heat source to reach a relatively stable state, and it is not easy to control this process, with a limited test time within the sand tank, in addition, the temperature transfer exists in the width direction of the sand tank, resulting in a temperature reduction on the studied horizontal section, therefore, the existence of such errors does not mean a problem in mechanism, and the model calculation results are reliable.
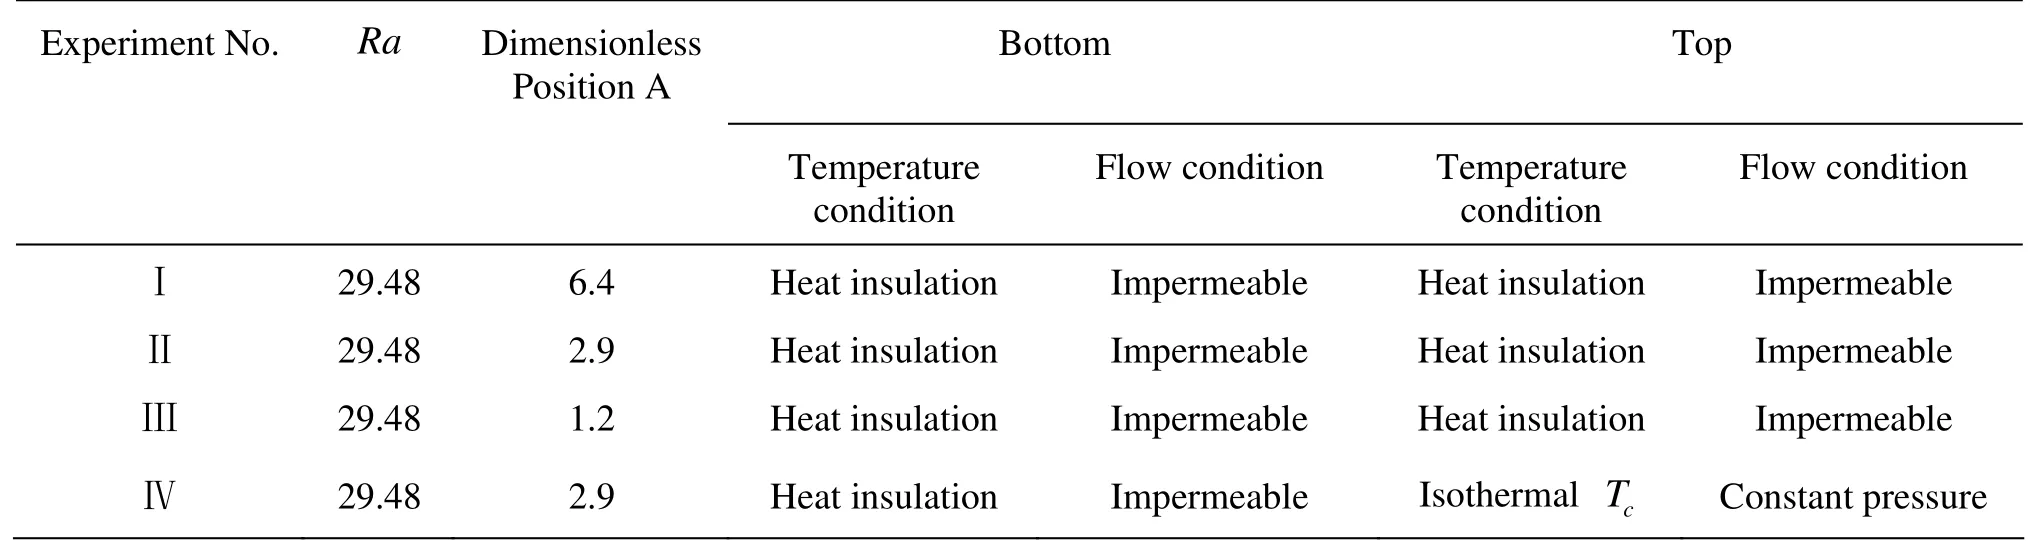
Table 1 Four groups of numerical simulation parameters
On the basis of the mutual verification of calculation results and test results, the influences of the heat source positions and the boundary conditions on the temperature fields under conditions of the natural convection can be seen, with the selected four groups of simulation tests shown in Table 1.
3.1 The effect of the heat source positions
The isotherm reflects the influence of the relative position of the dimensionless heat source on the temperature field under the natural convection conditions. By a comparison of Figs.10(a), 10(b) and 10(c), the heat coming from the top of the heat source is mainly concentrated in the top of the aquifer, and under the influence of the natural convection, the heat meets with the thermal resistance between the upper and lower layers, which impedes the downward migration of heat. The top heat source has a very weak influence on the bottom of the aquifer, but the heat produced by the heat sources in the middle and lower parts behaves otherwise, the heat in the lower part is generated with the natural convection, and migrates upwards along with the water flow heat. The high temperature areas are relatively dispersed, and not concentrated in the center of the heat source, thereby promoting the heat run-through between the upper and lower layers. In the context of the energy storage, the relatively concentrated heat distribution is good for the heat recovery, thus in the process of the energy storage, the heat source position should be considered.
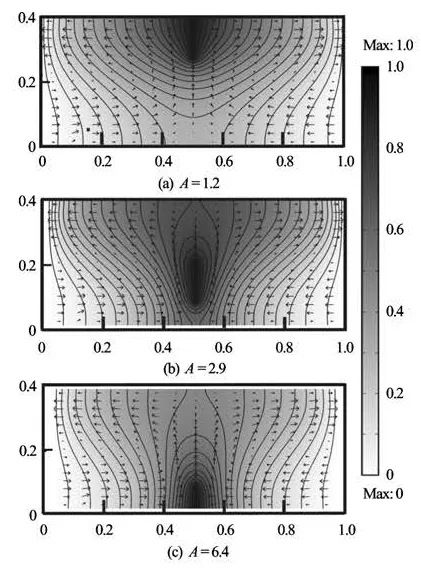
Fig.10 Arrow chart of surface, equipotential and velocity field for temperature fields in simulation tests
The arrow chart of the velocity field reflects the water flow tendency when the natural convection occurs, forming a state where, with the heat source as a center, the water flows counterclockwise on the left and clockwise on the right. On the vertical section x=0.6, we calculate the magnitude of the velocity, shown in Fig.11, where the overall velocity distribution features peaks at both ends of the heat source, but it varies with the heat source positions. Through comparison of results of A=2.9 and A=1.2, the change trends of the velocity fields along the section line are seen to be completely opposite. However, if the section direction is changed, the trends will be consistent completely, indicating that the location of the heat source has little effect on the flow patterns,but a greater effect on the convection intensity. The magnitude of the velocity field changes with the heat source location, showing the non-monotonic characteristics: Velocity for =2.9A>velocity for =6.4A>velocity for =1.2A. The maximum strength of the velocity field is reached when the heat source is in the middle, followed by that on the bottom, and the minimum is reached at the top.
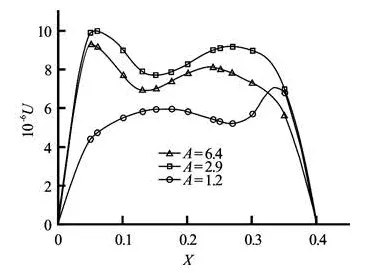
Fig.11 Velocity curves for different heat source locations on x=0.6 section
3.2 The effect of boundary conditions
The simulation results of the dimensionless temperature in Fig.12 show that the boundary conditions has a notable impact on the shape of the temperature field, with 0ω= and 1 representing, respectively, two states, the non-coupling state and the full coupling state of the flow field and the temperature field during the simulation. From the results, the amplitude of the temperature change under the top heat insulation boundary conditions is larger than that of the constant temperature change, caused by the difference of the natural convection temperature. From Fig.12(a), it is found that the bottom heat of the aquifer gradually migrates upwards, the tendency of the temperature change on the section under the condition of “high bottom and low top” of the non-coupling state is turned to that under the condition of “low bottom and high top” of the full coupling state, and Fig.12(b) shows similar change characteristics but an obviously less change range, with the same Rayleigh number of Ra, the different boundary conditions make a difference to the natural convection intensity, which indicates that the different boundaries corresponds to different critical Rayleigh numbers, as we know, the heat exchange coefficient of the boundary surface is decided by the heat boundary conditions and with the two kinds of extreme boundary conditions, it is shown that we should not neglect the impact of the interface heat exchange on the temperature field when considering the influence range of the energy storage heat. test conditions give the critical Rayleigh range of 15.36<Rac<20.27 for the occurrence of the natural convectio n, whic h is consistent wi th t he critical Rayleighnumberof Rac*=17.65 fortheconditions
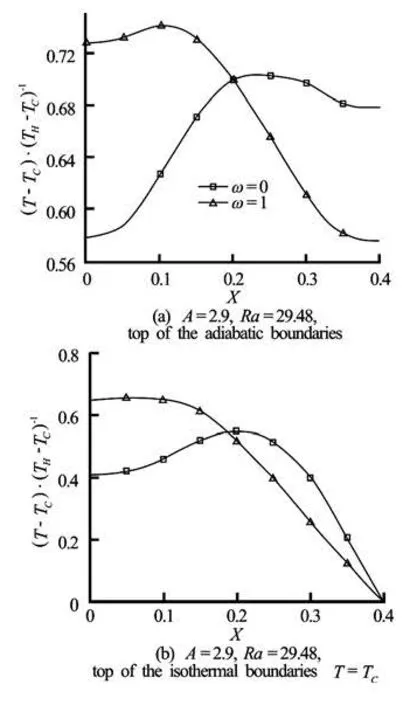
Fig.12 Dimensionless temperature curve with damping factor is 0 and 11, on the section of =0.6x
4. Conclusions
The physical model of the aquifer sand tank in porous medium and the test acquisition system developed in this paper have good operability and precision, which provides a good platform for carrying out indoor temperature field tests in the future; with the combination of the Brinkman governing equation and the conduction-convective equilibrium equation of the Boussinesq buoyancy item, two new coupling models are established, and the model calculation results can truly reflect the state of the indoor temperature field in the aquifer, and we reach the following conclusions:
(1) The consistency of the test results and the numerical results shows that there is a natural heat convection in the course of the heat migration process in the aquifer. The natural convection is influenced by various factors; this paper considers whether the natural convection can occur as well as its effects through introducing the dimensionless Rayleigh number of Ra, under the action of a constant heat source, theobtained by Neild, the results show that when the Rayleigh number Ra>Rac, a certain degree of natural convection shall appear inside the aquifer, the form of the heat migration will change from the simple heat conduction to the two heat transfer ways covering the convection-heat conduction, the section temperature field will have the characteristics of “big upside and small downside”, and the convection temperature will increase along with the increase of Ra. All of these indicate that the influence of the natural convection on the temperature field can not be neglected under the conditions of high heat flow density, hence the mathe- matical model that only considers the heat conduction can not correctly describe the temperature field and the internal heat transfer process.
(2) The numerical simulation shows that the position of the heat source has some effect on the flow state, but a great effect on the convection intensity. When the heat source is located at the top, under the influence of the natural convection, due to the heat resistance between the upper and lower layers, we will have the downward heat migration, and the heat mainly concentrates on the top, which is more concentrated and with a small heat influence range as compared to the middle and bottom parts, the velocity has the characteristics of non-monotonicity with the change of the heat source position, VA=2.9>VA=6.4>VA=1.2, and the velocity field intensity for the middle part heat source is the biggest, followed by that for the bottom heat source and then that for the top heat source; the calculation results show that with the same heat source position, the heat exchange intensity between the aquifer and the boundary has an impact on the temperature field, which is not described by the Rayleigh number Ra and shall be discussed in the future research, hence the heat exchange intensity of the boundary layer in the energy storage research is a factor which must be considered, because the boundary conditions decide the value of the critical Rayleigh numbercRa, and further have an impact on the occurrence and intensity of the natural convection. In addition, the research of this problem enables us to have a clearer understanding of the mechanism of heat being migrated in the aquifer, thus has a certain theoretical significance. In the end, on the aspect of choosing the energy storage well for the energy storage, it is suggested to choose the energy storage top with a small boundary heat exchange intensity for the energy storage, which can not only save the energy storage space, but also be conducive to the heat recovery.
[1] LONG Xiang, WAN Mang-ying and MA Jie. Temperature field mathematical model study and flow conditions research and discussion in underground aquifers[J]. Research and Explore, 2005, 1(1): 14-18(in Chinese).
[2] DOU Zhi, ZHOU Zhi-fang and HUANG Yong et al. Numerical study of non-aqueous phase liquid transport in a single filled fracture by lattice Boltzmann method[J]. Journal of Hydrodynamics, 2012, 24(1): 130-137.
[3] GROSAN T., REVNIC C. and POP I. et al. Magnetic field and internal heat generation effects on the free convection in a rectangular cavity filled with a porous medium[J]. International Journal of Heat and Mass Transfer, 2004, 60(5): 1-38.
[4] AL-HARBI S. M. Numerical study of natural convection heat transfer with variable viscosity and thermal radiation from a cone and wedge in porous media[J]. Applied Mathematics and Computation, 2005, 170(1): 64-75.
[5] SHIINA Y., HISHIDA M. Critical Rayleigh number of natural convection in high porosity anisotropic horizontal porous layers[J]. International Journal of Heat and Mass Transfer, 2010, 53(7-8): 1507-1513.
[6] ZHOU Zhi-fang, WANG Jing-guo. Hydrodynamic theory in fractured media[M]. Beijing: Higher Education Press, 2007, 181-194(in Chinese).
[7] CAROTENUTO A., CASAROSA C. and DELL'ISOLA M. et al. An aquifer-well thermal and fluid dynamic model for downhole heat exchangers with a natural convection promoter[J]. International Journal of Heat and Mass Transfer, 2002, 40(18): 4461-4472.
[8] NAGANO K., MOCHIDA T. and OCHIFUJI K. Influence of natural convection on forced horizontal flow in saturated porous media for aquifer thermal energy storage[J]. Applied Thermal Engineering, 2002, 22(12): 1299-1311.
[9] CHENG Ching-Yang. Non-Darcy natural convection heat and mass transfer from a vertical wavy surface in saturated porous media[J]. Applied Mathematics and Computation, 2006, 182(2): 1488-1500.
[10] HUANG T., RUDNICKI J. W. A mathematical model for seepage of deeply buried groundwater under higher pressure and temperature[J]. Journal of Hydrology, 2006, 327(1-2): 42-54.
[11] WANG Shuang-jie, SUN Bing-xiang and XU Xue-zu et al. Mechanism research of natural convection in stone embankment by using indoor simulation experiment[J]. China Journal of Highway, 2004, 17(2): 18-23(in Chinese).
[12] AGARWAL S., BHADAURIA B. S. Natural convection in a nanofluid saturated rotating porous layer with thermal non-equilibrium model[J]. Transport in Porous Media, 2011, 90(2): 627-654.
[13] LEROY P., REVIL A. and KEMNA A. Complex conductivity of water-saturated packs of glass beads[J]. Journal of Colloid and Interface Science, 2008, 321(1): 103-117.
[14] NIELD D. A., BEJAN A. Convection in porous media[M]. 3rd, New York: Springer, 2005
[15] BILGEN E. Conjugate heat transfer by conduction and natural convection on a heated vertical wall[J]. Applied Thermal Engineering, 2009, 29(2-3): 334-339.
10.1016/S1001-6058(11)60285-0
* Project supported by the National Natural Science Foundation of China (Grant Nos. 51079043, 41102144), the Program for Non-profit Industry Financial Program of Ministry of Water Resources (Grant Nos. 200901064, 201001020) and 2011 of Provincial Young Talents Fund in Anhui Province (Grant No. 2011sQRL171).
Biography: LIU Guo-qing (1984-), Male, Ph. D. Candidate
ZHOU Zhi-fang,
E-mail: zhouzf@hhu.edu.cn

- 水动力学研究与进展 B辑的其它文章
- EXPERIMENTAL STUDY OF CONDENSATION HEAT TRANSFER CHARACTERISTICS OF HORIZONTAL TUBE BUNDLES IN VACUUM STATES*
- EFFECT OF ESCAPE DEVICE FOR SUBMERGED FLOATING TUNNEL (SFT) ON HYDRODYNAMIC LOADS APPLIED TO SFT*
- EXPERIMENTAL STUDY OF AIRFLOW INDUCED BY PUMPING TESTS IN UNCONFINED AQUIFER WITH LOW-PERMEABILITY CAP*
- SIMULATION OF HYDRAULIC TRANSIENTS IN HYDROPOWER SYSTEMS USING THE 1-D-3-D COUPLING APPROACH*
- TOTAL PHOSPHORUS RELEASE FROM BOTTOM SEDIMENTS IN FLOWING WATER*
- EFFECTS OF UNDERSCOUR DEPTH AND HORIZONTAL SPACING BETWEEN TWO BED PROTECTION BLOCKS ON STABILITY OF FRONTAL BLOCK*