
EXPERIMENTAL STUDY OF AIRFLOW INDUCED BY PUMPING TESTS IN UNCONFINED AQUIFER WITH LOW-PERMEABILITY CAP*
2012-08-22 08:31:49HUANGHuiQIANJiazhong
水动力学研究与进展 B辑 2012年4期
HUANG Hui, QIAN Jia-zhong
School of Resources and Environmental Engineering, Hefei University of Technology, Hefei 230009, China, E-mail:huanghuifengye@163.com
KUANG Xing-xing
Department of Earth Sciences, The University of Hong Kong, Hong Kong, China
CHEN Zhou, LI Ru-zhong
School of Resources and Environmental Engineering, Hefei University of Technology, Hefei 230009, China
(Received November 9, 2011, Revised February 21, 2012)
EXPERIMENTAL STUDY OF AIRFLOW INDUCED BY PUMPING TESTS IN UNCONFINED AQUIFER WITH LOW-PERMEABILITY CAP*
HUANG Hui, QIAN Jia-zhong
School of Resources and Environmental Engineering, Hefei University of Technology, Hefei 230009, China, E-mail:huanghuifengye@163.com
KUANG Xing-xing
Department of Earth Sciences, The University of Hong Kong, Hong Kong, China
CHEN Zhou, LI Ru-zhong
School of Resources and Environmental Engineering, Hefei University of Technology, Hefei 230009, China
(Received November 9, 2011, Revised February 21, 2012)
The airflow in unsaturated soils is an issue of great importance in various fields such as in agricultural, nuclear, environmental engineering. However, up to now, little attention was paid to the generation of the airflow induced by a pumping test in an unconfined aquifer with a low-permeability cap and its influence on the pumping test. In this paper, pumping tests were carried out experimentally in the aquifer with a low-permeability cap in order to study the influence of the airflow induced by the pumping on the drawdown of the tests. It is shown that: (1) there is an airflow with negative pressure generated by the pumping tests, (2) the Negative air Pressure (NP) is increased with the pumping rate but decreased with the radial distance, and (3) the NP also changes with the initial water table. The results provide a good basis for further theoretical study of the airflow induced by pumping.
low-permeability cap, pumping tests, airflow, unconfined aquifer, drawdown
Introduction
The air or air-water flows and their interactions in unsaturated zones were widely studied mainly in the fields of infiltration and contaminant transport[1-6], but for the airflow caused by pumping was not well studied[7-9]. Pumping tests were shown to be one of the most effective ways of assessing groundwater resources, obtaining aquifer parameters and offering data for numerical simulations. Traditionally, the pumping tests focus on the saturated flow below the water table and the soil above the initial water table prior to the pumping is considered to have little influence on the test results and is usually ignored[10-12]. However,some field studies and numerical models show that the airflow may be generated, especially with a low-permeability top layer. For example, Leung et al reported a related heaving of the airfield pavement at the Hong Kong International Airport[7]. The heave problem was mitigated when air pressure relief holes were installed. This unusual phenomenon attracted researchers’ attention on the airflow in vadose zones. For example, Guo et al.[13]and Weeks[14]proposed that the intensive rainfall infiltration can cause the Lisse effect, that is, the water-level will increase in a well by the airflow induced by an advancing wetting front during the rainfall infiltration. Jiao and Guo[7]put forward an airwater two phase flow numerical model and pointed out that if the pumping in a closed system can produce a negative pressure in the unsaturated zone, these negative pressures could impact the pumping process. Jiao and Guo speculated that if the unsaturated zone was capped by a low-permeability soil, the airflow might be caused in the unsaturated zone during the pumping and it will have an important impact on the drawdown in the aquifer. If the airflow caused by the low-permeability cap is ignored, the possible error inthe parameter and drawdown estimation would be great. But results from Jiao and Guo[7]were based on the theoretical analysis and the TOUGH2 numerical simulation, further experimental studies are needed to disclose the mechanism of the impact of the airflow on the pumping test.
This paper investigates experimentally the impact of the negative air pressure on the water flow during the pumping of an unconfined aquifer with a low permeability cap. This study will provide a basis for further investigation of the airflow induced by the pumping.
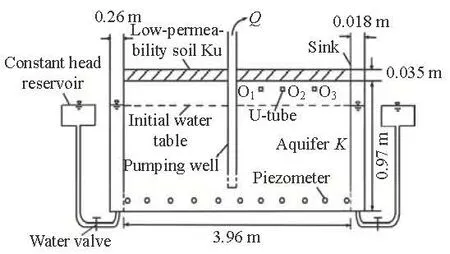
Fig.1 Schematic diagram of the experimental setup for pumping test with low-permeability cap
1. Experimental setup and methods
1.1 Experimental setup
Figure 1 shows a schematic diagram of the experimental setup which consists of a primary part and a supportive part. The primary part consists of two Plexiglas flumes for discharge and recharge and a saturated-unsaturated flow system with a Plexiglas trough of 3.96 m in length, 0.76 m in width and 0.97 m in height. The initial thickness of the aquifer and the vadose zone is 0.9 m and 0.07 m, respectively. The thickness of the aquifer and the vadose zone can be adjusted according to the need in the experiments. There is a soil layer of 0.035 m in thickness above the aquifer, used as the low-permeability cap. The inner diameter of the pumping well is 0.04 m, the screen length is 0.2 m and the bottom of the screen is 0.2 m above the impermeable bottom. Because the system is symmetrical with respect to the pumping well, three U-tubes are installed on only one side of the pumping well to measure the NP, 0.39 m, 0.905 m and 1.56 m, respectively (locations denoted as O1, O2and O3), away from the well. Eleven piezometers are installed 0.05 m away from the bottom of the model to measure the hydraulic head during the pumping, and the heads measured with two piezometers near the boundaries are regarded as the boundary condition. In order to enlarge the difference of the permeability between the aquifer and the soil, the aquifer is designed with homogeneous medium sands of the following compositions: 1.27% of sands with diameters greater than 0.002 m, 2.03% of sands with diameters between 0.001 m and 0.002 m, 88.28% of sands with diameters between 0.0005 m and 0.001 m and 6.16% of sands with diameters less than 0.00025 m. The permeability of the aquifer (K) is 6.16×10⁻⁴m/s. The upper layer is homogeneous silt with a low hydraulic conductivity of 5.31×10⁻⁷m/s, and the system is considered as airconfined. In this experiment, the following pumping rates (Q) are adopted: 28.59 ml/s, 34.28 ml/s and 36.17 ml/s.
1.2 Experimental method
The experimental model is a two-phase air-water flow model which can be approximately regarded as air confined because the permeability of the upper layer is much less than that of the aquifer. The whole model can be regarded as an air-confined system with a partially penetrating well. The hydraulic gradient of the aquifer is controlled by adjusting the water level difference between the inflow and outflow reservoirs (Fig.1). The initial conditions for the experiment are: the hydraulic gradient (J) is 0, the initial water tables which are adjusted through the overflow reservoirs are 0.07 m and 0.10 m, the initial NP is 0 and the pumping rate is constant.
To determine the relationship between the pumping rates (Q), the water table (0s) and the NP, a series of pumping experiments are performed with different Q (28.59 ml/s, 34.28 ml/s and 36.17 ml/s) and the corresponding NP are recorded. Plots of the Q versus the NP will reveal the relationship between them. To study the influence of0s before the pumping on the NP, the NP for different0s is recorded during the pumping. All experiments are repeated twice under the same condition to ensure consistency of measurements. The pumping rates are controlled by a peristaltic pump with error less than 0.5%, the water levels are measured with ten pressure transducers with errors less than 0.0005 m and the U-tube with error less than 0.5%. During the experiments, the temperature is kept at about 8oC, and the average atmospheric pressure is about 101 kPa.
2. Experimental results and discussions
Jiao and Guo[7]proposed that the NP can be generated during the pumping in the vadose zone with a low-permeability cap. That is because when the water table falls, the more pore space will be formed. However, the low-permeability soil prevents the entry of the air to fill these new pore spaces from the atmosphere, so the NP is generated and this NP is positively correlated with the thickness of the low-permeability soil. Besides, the NP gradually increases withthe drawdown until it reaches a peak value to break through obstacles of the layer. At last, the NP gradually returns to zero (the initial air pressure prior to the pumping). So the NP-time curve is V shaped, with the pressure increasing from zero to a peak value, then decreasing gradually until reaching zero. At the same time, the drawdown decreases with the radial distance from the pumping well, so the NP values are not the same in different locations with the same depth in the vadose zone. In the same depth, the pressure values gradually decrease with the increasing radial distance from the well. In this paper, the relationship between the NP, the pumping rate Q and the initial water tables are examined through a series of pumping tests.
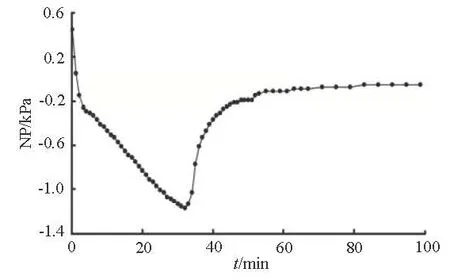
Fig.2 NP-time curve with Q=36.17ml/s at Point O1
2.1 The relationship between NP and time
Figure 2 shows the variation of the NP with time (t) for Q=36.17ml/s at O1. It can be seen that the NP-time curve is V shaped, with the NP decreasing from zero with the falling of the water table in the aquifer during the pumping and then recovering to zero after the air pressure induces enough air inflow through the low permeability layer. That is because the NP has a suction effect on the low-permeability soil. When the NP is large enough, the air will enter from the atmosphere to fill these new pore spaces. Consequently, the NP gradually recovers to the atmospheric pressure. This phenomenon is fully consistent with the theory proposed by Jiao and Guo[7]that the NP in this condition will recover to the atmospheric pressure finally.
Figure 2 also shows that the initial air pressure in the unsaturated zone of the aquifer is slightly larger than the atmospheric pressure. Theoretically, it should be the same as the atmospheric pressure. This small positive air pressure is generated during the saturation of the aquifer. The air in the unsaturated zone is compressed with the rising of the water table because the low-permeability soil prevents the air flowing from the unsaturated zone to the atmosphere. As expected, the initial positive air pressure increases with the initial water table. For instance, the initial positive air pressure is 0.3 kPa when the initial water table is 0.10 m and 0.45 kPa when the initial water table is 0.07 m.
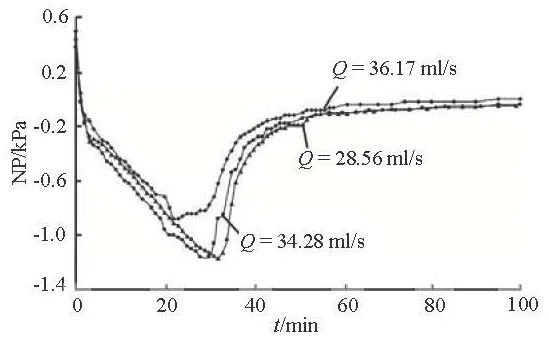
Fig.3 NP-time curve with different pumping rates at Point O1

Fig.4 Drawdown-distance curve at different time during the pumping
2.2 The relationship between NP and pumping rate
Figure 3 shows the temporal changes of the NP in the unsaturated zone for different pumping rates. As expected, the NP increases with the increase of the pumping rate. During the pumping, the low-permeability upper layer impedes the air inflow to the soil as the water level drops, so that the NP is induced. When the pumping rate is high, the water level would drop quickly, leading to an increase in the negative air pressure above the water level. This is in agreement with the study of Jiao and Guo[7]. It can be seen from Fig.3 that when Q=28.59ml/s , the time for the NP to break through the obstruction of the low-permeability soil (Tmax) at point O1is 22 min. In comparison, the Tmaxfor Q =34.28ml/s and Q=36.17ml/s are 28 min and 32 min, respectively. Meanwhile, the corresponding maximum NP values are 0.88 kPa, 1.16 kPa and 1.17 kPa, respectively. The results demonstrate that the greater the pumping rate, the greater the maximum NP value will be. Figure 4 shows the evolution of the cone of depression during the pumping recorded by the piezometers when Q= 36.17ml/s. When t=32min , the NP will reach thepeak value of 0.117 m but the maximum drawdown is only about 0.193 m, which means that the most of the drawdown at this time is caused by the NP.
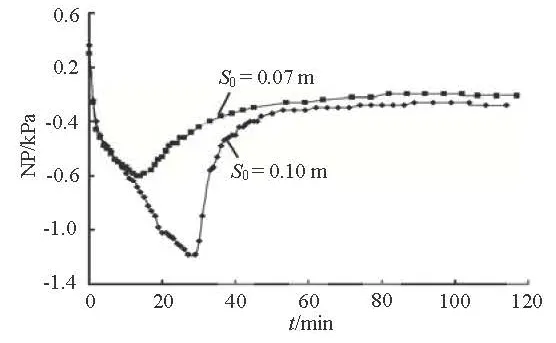
Fig.5 NP-time curve with different initial water table
2.3 The relationship between NP and initial water table
The position of the initial water table (0s) may have a direct impact on the NP because it determines the initial volume of air in the unsaturated zone. Figure 5 shows the NP-time curves at O1with different water tables (0.07 m, 0.10 m) for =Q 34.17ml/s. As shown in Fig.5, the initial water table has a significant impact on the NP. When0=s 0.07m, the maximum NP is 1.18 kPa, the corresponding time for the maximum NP (maxT) is 29 min. While s0=0.10m , the maximum NP is only 0.6 kPa, the corresponding Tmaxis just 14 min. It is shown that the maximum NP becomes smaller when the initial water table is lower.
3. Conclusion
In this paper, the pumping tests were carried out experimentally in an unconfined aquifer with a lowpermeability cap in order to investigate the airflow induced by the pumping and its impact on the drawdown. The experiment results reveal that the NP can be generated in the vadose zone of an aquifer with a low-permeability cap during the pumping. The NP increases from zero to a maximum value and decreases gradually to the atmospheric pressure if ignoring the initial positive pressure and the capillary pressure. The NP becomes more significant when Q is greater or the initial water table is higher. Furthermore, experimental results show that the NP is significant, when the drawdown is relatively small. The NP takes care of most of the drawdown. So, the impact of the NP on the drawdown can not be neglected when interpreting the pumping test data in the air-confined situation. However due to limitations of the scale of measurements, we have not considered the role of the water pressure during the pumping. This problem will be studied in the future.
Acknowledgement
This worked was supported by the Innovative Projects of Hefei University of Technology (Grant No. 2009HGCX0233).
[1] YOU K., ZHAN H. and LI J. Analysis of models for induced gas flow in the unsaturated zone[J]. Water Resources Research, 2011, 47: W04515.
[2] LI H., JIAO J. J. One-dimensional airflow in unsaturated zone induced by periodic water table fluctuation[J]. Water Resources Research, 2005, 41: W04007.
[3] ZHANG Xiao-yue, ZHU Yue-ming and FANG Chunhui. The role fore air flow in soil slope stability analysis[J]. Journal of Hydrodynamics, 2009, 21(5): 640-646.
[4] XIA Y., LI H. and WANG L. Tide-induced air pressure fluctuations in a coastal unsaturated zone: Effects of thin low-permeability pavements[J]. Ground Water Monitoring and Remediation, 2010, 31(2): 40-47.
[5] LI H., JIAO J. J. and TANG Z. Semi-numerical simulation of groundwater flow induced by periodic forcing with a case study at an island aquifer[J]. Journal of Hydrogeology, 2006, 327(3-4): 438-446.
[6] DROR I. Effects of air injection on flow through porous media: Observations and analyses of laboratory-scale processes[J]. Water Resources Research, 2004, 40: W09203.
[7] JIAO J. J., GUO H. Airflow induced by pumping tests in unconfined aquifer with a low-permeability cap[J]. Water Resources Research, 2009, 45: W10445.
[8] KUANG X., JIAO J. J. and WAN L. et al. Air and water flows in a vertical sand column[J].. Water Resources Research, 2011, 47: W04506.
[9] ENDRES A. L., JONES J. P. and BERTRAND E. A. Pumping-induced vadose zone drainage and storage in an unconfined aquifer: A comparison of analytical model predictions and field measurements[J]. Journal of Hydrology, 2007, 335(1-2): 207-218.
[10] QIAN J., ZHAN H. and WU J. et al. What can be learned from sequential multi-well pumping tests in fracture-karst media? A case study in Zhangji, China[J]. Journal of Hydrogeology, 2009, 17(7): 1749-1760.
[11] SUN Dong-mei, ZHU Yue-ming and ZHANG Ming-jin. Water-air two-phase flow model for numerical analysis of rainfall infiltration[J]. Journal of Hydraulic Engineering, 2007, 38(2):150-156(in Chinese).
[12] LUO Zu-jiang, ZENG Feng. Finite element numerical simulation of land subsidence and groundwater exploittation based on visco-elastic-plastic biot’s consolidation theory[J]. Journal of Hydrodynamics, 2011, 23(5): 615-624.
[13] GUO H., JIAO J. J. and WEEKS E. P. Rain-induced subsurface airflow and Lisse effect[J]. Water Resources Research, 2008, 44: W07409.
[14] WEEKS E. P. The Lisse effect revisited[J]. Ground Water, 2002, 40(6): 652-656.
10.1016/S1001-6058(11)60283-7
* Project supported by National Natural Science Foundation of China (Grant Nos. 40872166, 51179042), the Research Grants Council of the Hong Kong Special Administrative Region, China (Grant No. HKU7019080P).
Biography: HUANG Hui (1989-), Female, Master Candidate
QIAN Jia-Zhong,
E-mail: qjiazhong@gmail.com

- 水动力学研究与进展 B辑的其它文章
- EXPERIMENTAL STUDY OF CONDENSATION HEAT TRANSFER CHARACTERISTICS OF HORIZONTAL TUBE BUNDLES IN VACUUM STATES*
- THE NATURAL CONVECTION OF AQUIFERS WITH CONSTANT HEAT SOURCES AND ITS INFLUENCE ON TEMPERATURE FIELDS*
- EFFECT OF ESCAPE DEVICE FOR SUBMERGED FLOATING TUNNEL (SFT) ON HYDRODYNAMIC LOADS APPLIED TO SFT*
- SIMULATION OF HYDRAULIC TRANSIENTS IN HYDROPOWER SYSTEMS USING THE 1-D-3-D COUPLING APPROACH*
- TOTAL PHOSPHORUS RELEASE FROM BOTTOM SEDIMENTS IN FLOWING WATER*
- EFFECTS OF UNDERSCOUR DEPTH AND HORIZONTAL SPACING BETWEEN TWO BED PROTECTION BLOCKS ON STABILITY OF FRONTAL BLOCK*