
EFFECTS OF UNDERSCOUR DEPTH AND HORIZONTAL SPACING BETWEEN TWO BED PROTECTION BLOCKS ON STABILITY OF FRONTAL BLOCK*
2012-08-22 08:31:49SHAHPremTANAKANorioYAGISAWAJunji
水动力学研究与进展 B辑 2012年4期
SHAH Prem, TANAKA Norio, YAGISAWA Junji
Graduate School of Science and Engineering, Saitama University, Sakura-ku, Saitama-shi, Saitama, Japan, Email: prem3630@hotmail.com
(Received October 22, 2011, Revised March 15, 2012)
EFFECTS OF UNDERSCOUR DEPTH AND HORIZONTAL SPACING BETWEEN TWO BED PROTECTION BLOCKS ON STABILITY OF FRONTAL BLOCK*
SHAH Prem, TANAKA Norio, YAGISAWA Junji
Graduate School of Science and Engineering, Saitama University, Sakura-ku, Saitama-shi, Saitama, Japan, Email: prem3630@hotmail.com
(Received October 22, 2011, Revised March 15, 2012)
The stability of a river-bed protection block in a flood event is affected by underscouring of the block. The effects of block spacing on block stability were investigated in different underscour conditions. Three blocks were placed at the bottom in a flume, and the underscour depth of the frontal block and distance between the first and second blocks were changed. Drag and lift forces were measured directly in each experimental condition. Particle Image Velocimetry (PIV) was used to visualize the flow and evaluate the streamline pattern. Pressure measurements around the block to understand the pressure distribution show that the pressure distribution on the rear and bottom surfaces of the block is significantly affected by changes in block spacing and underscour depth. The experimental results show that for the same underscour gap, lift, and drag coefficients decreased with increasing space between the two blocks. In addition, if the underscour gap is increased with the same horizontal spacing, the lift coefficient increases and drag coefficient decreases. These results demonstrate that wider spacing enhance stability of the frontal block in the underscour condition. Moreover, analysis of block stability with changing underscouring and horizontal spacing shows that bed protection blocks seem to have more stability when the gap between two bed protection blocks was equal to height of the blocks.
bed protection, block stability, underscouring, Particle Image Velocimetry (PIV)
Introduction
Study of the flow around bluff bodies or obstructions such as large woody debris is very important to understand the collapse of civil engineering structures. One of the main reasons for the collapse of river bed protection blocks or obstructions is scouring of the bed around them. For example, woody debris positioned at cross streams directly affects the water flow and bed characteristics, including scour depth and the areas around it by changing the flow through the obstruction[1]. To elucidate the reasons for the collapse of the blocks, the drag and lift characteristics of the flow structures in the collapsed condition need to be understood. Previous studies on drag and lift forces acting on both river bed and bank protection blocks focused on the changes in the drag and lift coefficientdue to (1) the block configuration[2]and (2) the bed scour depth under the blocks[3]. Drag and lift forces are also influenced by the obstruction shape, and the force characteristics are utilized to reduce the fluid force. For example, Rahman and Mashud[4]discussed a method of reducing the drag and lift forces by transforming a sharp front nose of a blunt obstacle into a stepped one. However, only a few studies have been conducted to elucidate the flow field in relation to block bed scouring and block stability under scouring condition.
Shah et al.[5]conducted experiments and numerical simulations to investigate the difference in flow patterns around a single bed protection block with and without underscouring and its effects on the drag and lift coefficients. The results of an earlier experiment using a single block with and without scouring showed that the lift coefficient is decreased when scouring under the block occurs. Taylor et al.[6]discussed the flow over square, circular, and triangular models on a flat plate. In that study, distinct circulation regions were created at the leading and trailingedges and in the wake region, however, the flow patterns for different spacings between two block models were not discussed. No study has reported the flow patterns between two rectangular blocks with different block spacing and scour conditions. River protection blocks are usually chained together and placed on the bottom of the river with some space between them to protect the river bed from underscouring and to protect them from each other. An optimal distance between blocks for their stability under flood conditions may exist, but there is no information about it. In addition, the effects of different arrangements of blocks on scouring are still unclear. Laskovski et al.[7]measured the lift force of a solid material installed on a flat plate or on a slope, analyzed the collapse condition of bed protection blocks, and found that a lift force acts downward 83% of time, thus helping to keep the solid material at rest. Thus, there exists a finite probability of a positive lift force that is sufficient to permit the solid material to move. However, the stability of blocks in relation to drag and lift forces in an underscouring condition has not been discussed.
Therefore, the objective of this study is to investigate the optimal block spacing for stability in different underscouring conditions. To achieve that objective, the drag and lift characteristics are investigated with flow visualization using Particle Image Velocimetry (PIV), and the pressure around the block model was measured to give the pressure distribution. Moreover, the block stability in the underscoured condition is analyzed by using the obtained drag and lift coefficients.
1. Experimental arrangements and procedures
Blocks made of wood and 0.08 m long, 0.5 m wide, and 0.02 m high were placed on the flume bed. For practical purposes, Tamura et al.[2]conducted experiments to elucidate drag and lift characteristics of bed protection blocks using 85 block shapes and a wide range of the Reynolds numbers (Re=uH/ν, where u is an average approach velocity, H is the height of a block, and is ν the kinematic viscosity of water). The relationship between drag coefficients, lift coefficients, and the Reynolds number was investigated and indicated that if the shape of the blocks is the same, then drag and lift coefficients are not much changed at the Reynolds numbers of 1 000 or greater. However, the drag and lift coefficients varied with the change in the shape of the bed protection blocks. Later, Inoue et al.[8]conducted experiments using three different block heights with the same stream and crossstream length, 0.08 m and 0.5 m, respectively. The heights of the bed protection block models used in that experiment were respectively 0.019 m, 0.028 m, and 0.038 m. The drag and lift coefficients changed with the height, and the block of 0.019 m high expressed well the range of the coefficients investigated by Tamura et al.[2]. In this study, although the Reynolds number was different from that of Inoue et al.[8](Re=14 000 based on block height), the block height of 0.02 m was chosen considering the similarity of drag and lift coefficients of the actual block.
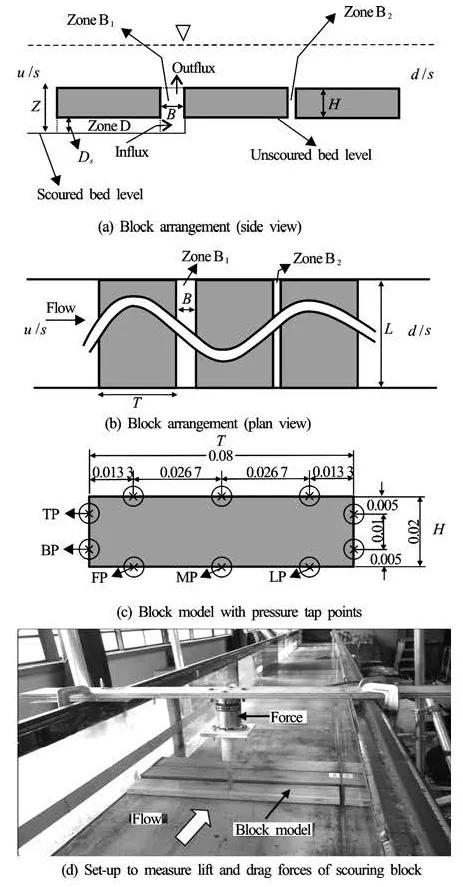
Fig.1 Experimental arrangement. X indicates pressure taps, and circles are areas covered by the instrument (m)
Fukuoka et al.[3]reported that the lift force reaches its maximum when the critical non-dimensional underscour depth Ds/H (Dsis underscour depth, H is block height) is 0.2 to 0.3. Based on that, block models were placed across the flow and the non-dimensional underscour depth Ds/H of the first block was changed from 0.05 to 0.25 with a nondimensional horizontal spacing B/H (Bis the gap between two adjacent blocks) of 0.25, 0.5, 0.75, or 1 between the first and second blocks (see Fig.1(a)).Although the objective of this study was to investigate the flow pattern between the first and second blocks, three model blocks were used because the flow pattern was affected by the downstream part of the second block when only two blocks were set. The horizontal spacing constant, /BH, between the second and third blocks was kept at 0.25. For each underscour depth (Ds/H), there were four different horizontal spacings (B/H). Thus, in total, 20 experiments were conducted.
The experiments were conducted in a water flume of 15 m long and 0.5 m wide. The experiment was carried out with a fixed 1/700 bed slope, 0.08 m water depth, and 0.35 m/s approach flow velocity. The Reynolds number based on the height of the block and mean velocity of approach flow was set at 7 000. The experimental flow condition was subcritical with a Froude number of 0.40. The ratio of water depth to block height was 4 in all cases.
In Fig.1(a) and 1(b), Zones B1and B2are defined as the horizontal gaps between the first and second blocks and the second and third blocks, respectively. Zone D is the scoured zone beneath the first block. Z is the depth from bed to the top surface of block. And FP, MP, LP, TP, BP are the first, middle, last, top, bottom points respectively. Two types of block arrangements were used depending on the experimental objective. One was to PIV and pressure measurements. For this purpose, the first block was attached to the side walls of the flume in order to keep it at a fixed position against the flow. The other experiment was the direct measurement of drag and lift forces on the first block. In this experiment, the first block was not attached to the side wall of the flume. A small gap was kept between the block side surface and flume side walls. The second and third blocks were attached to the bed and side wall of the flume at all times for all experiments.
1.1 Particle Image Velocimetry
A mixture of aluminum particles and KC Flock (the Nippon Paper Chemicals Co., Ltd., finely sieved powdered cellulose made from wood pulp) were used as tracers for visualizing flow. The mean diameter of the particles (tracers) was approximately 10 µm. A high-intensity and -frequency (200 Hz) laser (Green Laser Sheet of 200 m/G, Katoh Koken Co., Ltd.) was used to illuminate the tracers. A high-speed digital camera (K-II, Katoh Koken TV Zoom lens H851V, Katoh Koken Co., Ltd.) with a specification of 8.5-51 mm f/1.6 was used to record images.
The green laser was mounted at the top of the flume. A high-speed digital camera was placed near the flume wall. The video was taken inside the gap zone (i.e., Zone B1in Fig.1(a)) halfway from flume wall. The optimal concentration of tracer particles was determined for high video quality with a clear flow pattern before the start of actual experiment. The captured image recordings were analyzed by a commercial software named Dipp Flow V.1.21kp from the Ditect Co. Ltd.
1.2 Measurements of drag and lift forces
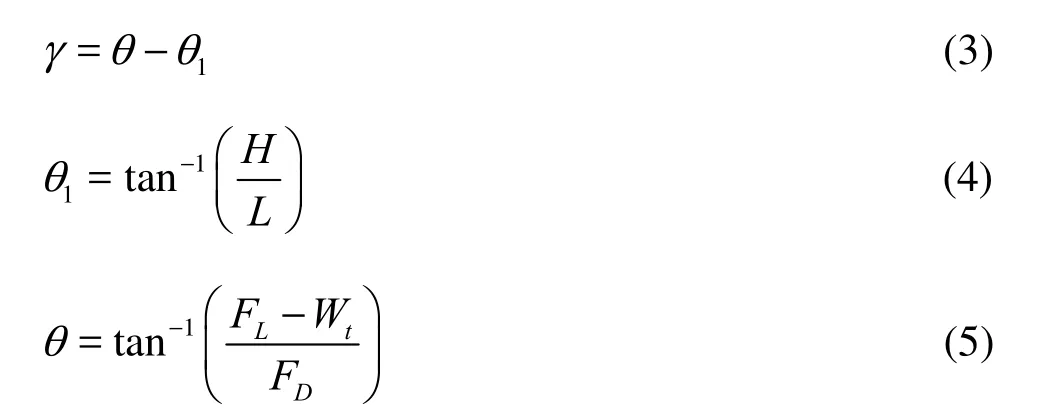
A two-axis load cell (streamwise (X) and vertical (Z) directions, type LB-60, SSK Co., Ltd.) that has a resolution of 1/1 000 and can measure the force up to 10 N was used to measure the drag and lift forces on the block model. A photograph of the model locations and measurement technique is shown in Fig.1(d). The lift force (LF) and drag force (DF) of the first block were measured directly by the two-axis load cell referring to the technique in previous similar experiments[9,10]. The lift coefficient (LC) and drag coefficient (DC) are defined as:
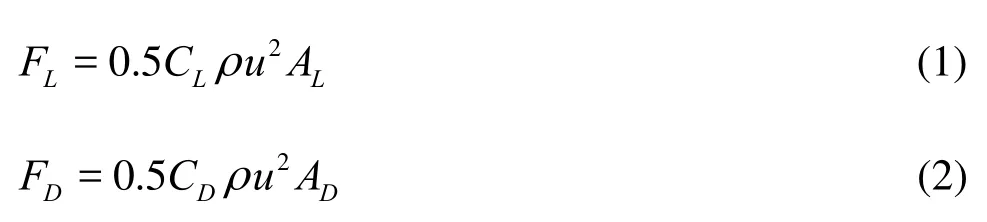
where ρ is the water density, u the average velocity in front of the block at the block height level,LA the vertical projected area (top surface area) of the block, andDA the frontal projected area of the block.
One major problem with the lift force measurements of long wooden models (such as those used in this experiment) is that the experimental results sometimes show negative lift force. It was observed that a slight tilt toward one of the sides produces such experimental results. This problem was solved by making the model absolutely horizontal.
1.3 Measurements of pressure
Micropressure transducers (P303V, SSK Co., Ltd.) with a measuring capacity of 0.2×10⁻⁴kg/m2at 5.6 kHz were placed around the surfaces of the model block at mid span. Figure 1(c) shows the tap locations. Pressure was measured at three points each on the top and bottom surfaces of the block. The pressures were also measured at two points each on the front and rear faces. The pressure data was recorded for 30 s at 100 Hz, while being low-pass filtered at 20 Hz. The surface pressures were integrated at front, back, top, and bottom sides of the model to obtain the drag and lift forces. The drag and lift forces from the pressure measurements were compared with those from the direct measurements to check their accuracy.
1.4 Analysis of block stability
The stability of the bed protection block in closed relationship with drag and lift forces acting on the block were analyzed to understand the collapse condition of the block.
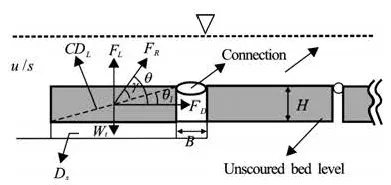
Fig.2 Analysis of collapse condition of bed protection blocks
Figure 2 demonstrates the parameters of the bed protection block that were analyzed. In most practical cases, the bed protection blocks are connected to each other. The rotation center of acting moment was set as the point at the upper corner of block at the connection edge. The line passing through the rotation center and center of gravity (C.G.) of the block is defined as the critical diagonal line (CDL). The forces acting on the block are the drag force (FD), lift force (FL), and self-weight (Wt) of the block. The size of the angle (γ) made by the resultant force (FR) on the CDLdefines the stability of the block for a flow condition. γ is determined by following formulae:
where θ is the angle made by the resultant force on the block,1θ the angle made by theLCD on the block, H the height of the block and L the length of the block in the flow direction.
The bed protection block collapses if the angle (γ) between the resultant force andLCD is between 0oto 160o[8].
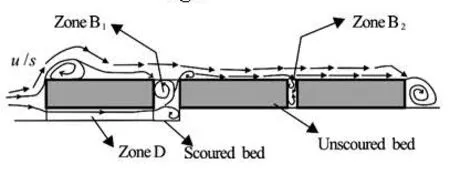
Fig.3 Flow pattern around front underscouring block
2. Result and discussions
2.1 Flow patterns around blocks under different underscouring conditions of frontal block
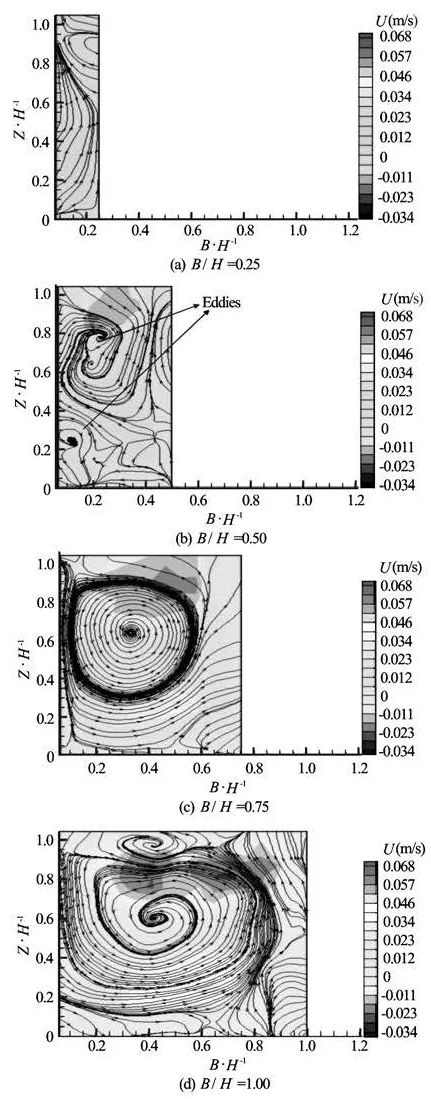
Fig.4 Flow pattern in Zone B1when non-dimensional underscour depth Ds/H is 0.05
The experimental study showed that the water flow patterns on the top surface of the first block, in the gap between the second and third blocks, and behind the third block were similar in all experiments, as shown in the Fig.3 for various combinations of underscour depth (Ds/H) and horizontal gap (B/H). The flow separated from the edge of the first block and reattached to the top surface of the first block. At the top surface of the second block, flow separationalso occurred, but the eddy was small. This kind of flow separation was absent on the top surface of the third block, but a large eddy was formed just behind the rear face of the third block as well. However, the flow pattern inside Zone B1varied with the horizontal distance between the first and second blocks as well as the depth of the underscour beneath the first block. The details of the flow pattern in between first block and second block will be discussed in the next section. The length of Zone B2, shown in Fig.1(a), was fixed to a non-dimensional value /BH of 0.25. The flow was more or less stagnant between the second and third blocks due to the smallness of the horizontal gap and the absence of underscouring. However, two small eddies were formed inside the gap. Lien et al.[11]did a wind tunnel experiment and numerical simulation to understand the flow pattern around an array of buildings. Their study showed a similar flow pattern on the front face of the first building, top surfaces of the first, second, and third buildings, and the rear faces of the second and third building.
2.2 Effects of Ds/H and B/H on flow pattern at Zone B1
All the discussion in this section will be focused on the horizontal gap between the first and second blocks (i.e., Zone B1) and the underscour depth at Zone D. Figure 4 shows the streamline pattern in Zone B1with different non-dimensional horizontal gaps (/BH) for a constant non-dimensional scour depth (Ds/H) of 0.05. Figure 4(a) shows that large eddy patterns were not created when B/H is 0.25, and the velocity inside Zone B1was not much changed. When B/H was increased to 0.5, two small eddies were created (Fig.4(b)). One was near the bottom, and the other was above. Moreover, Figs.4(c) and 4(d) show a large eddy with a distinct shape. The explanation for this is that even though the Ds/H was small, the wider /BH allowed the free passage of water between them. As a result, the velocity was increased with increasing /BH, and a large velocity difference was created between the first block’s rear wall and the central portion of the gap. Thus, a wider /BH generated a larger eddy.

Fig.5 Flow pattern in Zone B1when non-dimensional underscour depth Ds/H is 0.25

Table 1 Unit discharge influx (m2/s) to Zone B1

Table 2 Distribution of pressure (10-7kg/m2) measured on top surface, bottom surface, front face, and rear face of first block for a non-dimensional under-scour depth (Ds/H) of 0.05
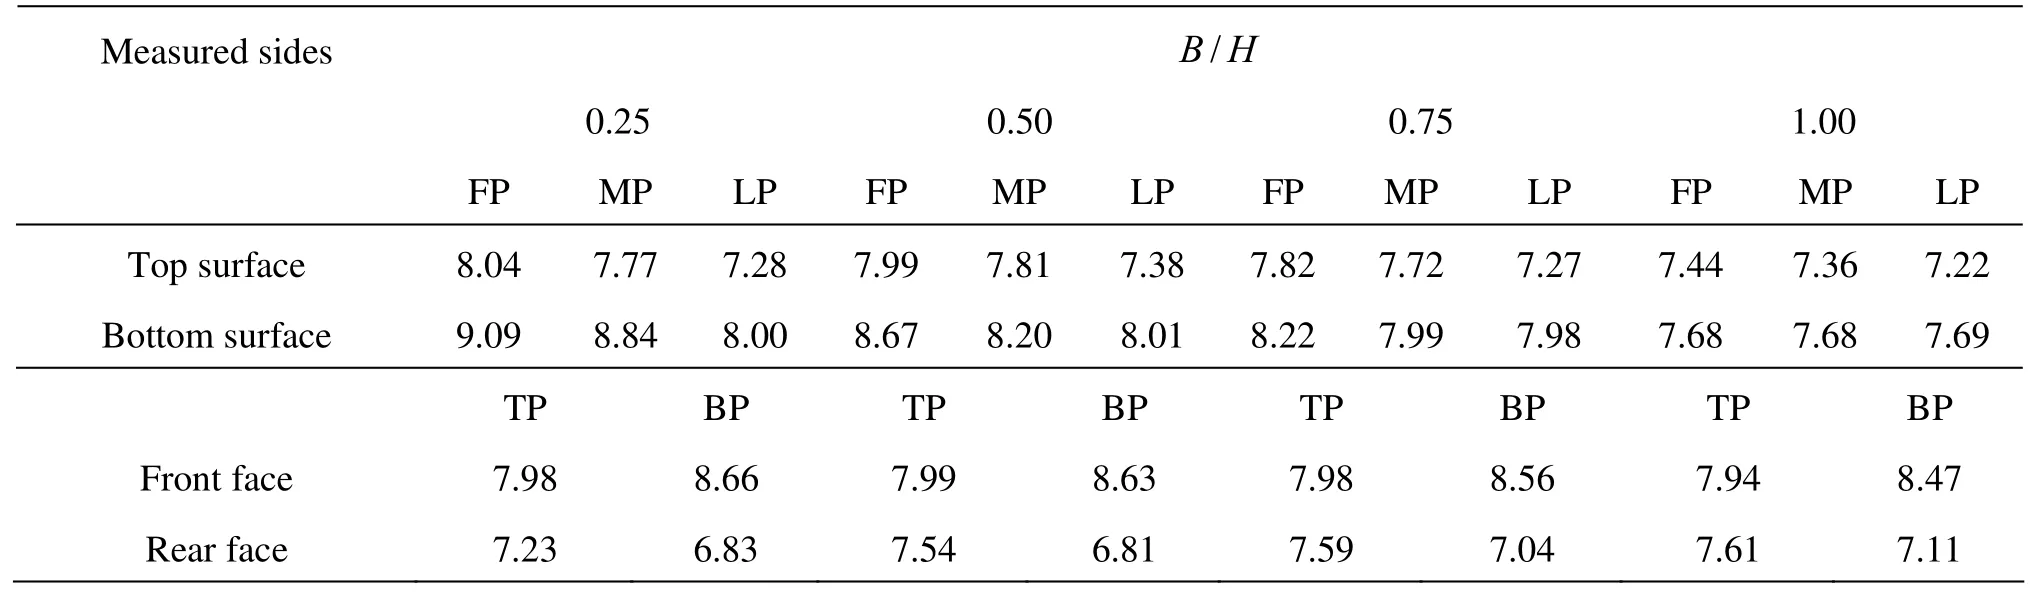
Table 3 Distribution of pressure (10-7kg/m2) measured on top and bottom surfaces and front and rear faces of first block with a non-dimensional under-scour depth (Ds/H) of 0.25
Figure 5 shows the streamlined pattern in Zone B1with different /BH and the largest Ds/H (0.25) in the experiment. Similar to Fig.4(a), the flow in Zone B1was almost stagnant when /BH was 0.25. Even when deep underscouring occurred, the flow pattern in Zone B1was not much altered in comparison with the case of shallow underscouring. When B/H was larger than 0.5, a very small eddy was formed near the rear wall of first block. In this case, unlike the small u ndersco uring case with t he same horizontalspacingwheretwoeddieswereformed, a single eddy was formed near the Zone B1exit. When B/H was further increased to 0.75, the eddy was large but not as large as with the shallower underscour (Ds/H=0.05and B/H=0.75). When the horizontal gap was further increased to a B/H of 1.0, a large eddy was formed, but it was not as strong as that in earlier cases (Ds/H of 0.05, 0.10, 0.15, and 0.20 with the same B/H=1). By comparing Fig.5(d) with 4(d), it can be seen that eddy formation was weaker for deeper underscours. This is because, for the same horizontal spacing, more flux came from Zone D to Zone B1when underscour depths (Ds/H) were deeper (Table 1).
As a result, the velocity difference occurring in the region of the first block’s rear face and the central region of Zone B1became smaller with increasing Ds/H.
The flow pattern obtained from this study can be compared with the flow pattern over boulders or cobbles forming stepped pools. Chanson[12]determined that nappe flow occurs on boulder sills when dc/H<1, where dcis the critical flow depth and H is the drop height, while transition flow develops when 0.85≤dc/H <1.15, approximately. If dc/ H>1, skimming flow develops, in which the water flows over the stepped pool in a coherent stream with recirculation in the pools beneath. In this study, dc/ H≈2, so a similar skimming flow pattern was observed with recirculation in Zone B1. However, in this case, the flow pattern, eddy size, and eddy location were affected by underscour depth and horizontal spacing between two blocks.
2.3 Effects of Ds/H and B/H on pressure and its distribution around the block
The pressure distribution around the first block (scoured block) and the effect of Ds/H and B/H is discussed in this subsection. Table 2 shows the pressure distribution on the top surface, bottom surface, front face, and rear face of the first block when B/H varies from 0.25, 0.50, and 0.75, to 1 with the same Ds/H of 0.05. B/H does not much alter the pressure distribution trend around the block. For all B/ H and Ds/H of 0.05, pressure gradually decreases on the top surface of the first block from the leading to trailing edges. The pressure distribution on the top surface of a sharp-edged object has been reported in previous research. Taylor et al.[6]showed that on the top surface, the separation of flow occurs near the sharp edge (leading edge) and the flow reattaches atsome distance from the leading edge. This is the reason for the higher pressure near the leading edge. Shortly after the flow reattachment, the velocity increases and pressure gradually decreases from halfway to trailing edge. The pressure distribution on the bottom surface is mostly affected by the horizontal space between the two blocks. If there were no gap between the two blocks, then the pressure distribution at the bottom surface would be uniform. However, due to the presence of horizontal spacing, the pressure on the bottom surface varies. For all B/H and Ds/H of 0.05, on the bottom surface of the first block, the pressure is high on the left side (entrance of Zone D) and low on the right side (exit of Zone D).
On the front face, the pressure distribution rises from low to high from top to bottom. This can be explained by the fact that little fluid can pass through the shallow underscour. As a result, the flow is slightly stagnant in front of the block even though scouring exists. At the same time, some flow will move towards the leading edge from the bottom stagnant area. Thus, high velocity and low pressure could be seen at the top of the front face, while low velocity and high pressure appears at the bottom of the front face. The pressure distribution trend at the rear face of the first block is such that the pressure is high at the top (just below the trailing edge) and low at the bottom (above the exit of Zone D). This can be seen in Figs.4(a)-4(d), which shows that there is less flow at the top rear face than at the bottom rear face. Although some flow enters from the top surface to Zone B1, the mixing of flow at Zone B1occurs far from the trailing edge. Thus, the flow near the top rear face is stagnant and the pressure is higher. However, due to the presence of the underscour region (Zone D), the flow is always active near the bottom rear face, and the pressure is consequently lower at the bottom rear face.
Table 3 shows the pressure distributions on the top surface, bottom surface, front face, and rear face of the first block when B/H varies from 0.25, 0.50, and 0.75, to 1 with the same Ds/H of 0.25. For all values of B/H, the pressure distribution trend is similar to that of Ds/H of 0.05 on the top surface, rear face, and front face. However, on the bottom surface, the pressure distribution trend is from high to low from left to right when B/H is 0.25, and the pressure is uniformly distributed when B/H is 1.
The effects of Ds/H and B/H are much clearer in Table 3. First, more flow enters Zone D with increasing underscour depth. However, the amount of flow exit from Zone B1is not much changed from the case of a small underscouring depth for the same B/H. Hence, the flow is more stagnant with deep underscouring, and high pressure occurred at the first block’s rear and bottom surfaces. Secondly, when underscouring was deep, a large horizontal spacing (/BH) is more effective for the stability of the first block. This is because high pressures are generated on the front and bottom surfaces for the initial horizontal spacing (/BH) of 0.25. As the horizontal spacing increases, the pressure on the block’s bottom surface gradually decreases while the pressure at the block’s rear face increases. The pressure on the bottom surface is reduced in such a way that the pressure distribution is uniform for a /BH of 1.00 (see Table 3). This demonstrates that for deep underscouring, blocks are more stable if wider gaps are kept between the two blocks.
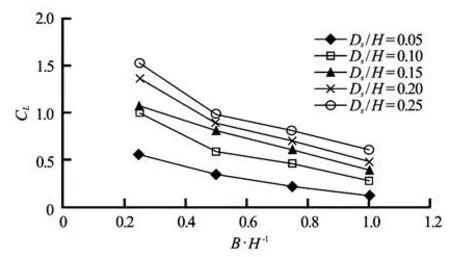
Fig.6 Varying trend of lift coefficient for different non-dimensional horizontal spacings (B/H) and non-dimensional underscour depths (Ds/H) of front block
Table 4 Pressure (10-6kg/m2) around the first block for a non-dimensional under-scour depth (Ds/H) of 0.05 and 0.25
2.4 Lift coefficient and drag coefficient
Figure 6 shows the relationship between B/H and lift coefficient for different Ds/H. For the same Ds/H, the lift coefficient decreases with increasing B/H. This is because more flux comes into Zone B1with increasing B/H (see Table 1), and the flow easily passes through Zone B1. As a result, the flow is not stagnant in Zone B1and Zone D. In addition, the pressure acting on the top surface is lower than that onthe bottom surface of the block (see Table 4). Furthermore, the horizontal gap between the two blocks does not affect the pressures on the top surface of the first block and they are not altered much, but the pressure on bottom surface is decreased as the size of the horizontal gap increases (see Table 4). Hence, the pressure differences between the top and bottom surfaces of the first block decreases with increasing /BH. Therefore, the lift coefficient decreases with increasing /B H. For the same /BH, the lift coefficient increases when Ds/H increases. In this condition, the eddy is more dominant than the flux coming into Zone B1. The flow patterns shown in Figs.4(c) and 5(c) show that the velocities at the rear face of the first block becomes lower when Ds/H increases, and thus the shear force acting downward at the rear face of the first block becomes smaller and as a result the lift coefficient increases when Ds/H increases.
Figure 7 shows changes in the relationship between B/H and drag coefficient (Cd) for different Ds/H. For the small Ds/H of 0.05, the drag coefficient is the highest, but its value is almost the same regardless of B/H. However, for Ds/H of 0.1 or greater, the drag coefficient is decreased with increasing B/H for the same underscour depth. This can be explained by the fact that the pressure at the front face was greater than at the rear face of the block, and when the value of B/H increases, the pressure acting at the first block’s front face almost keeps constant, but the pressure acting on the rear face increases (see Table 4). Thus, the pressure difference between the front and rear faces of the first block becomes smaller with increasing B/H, and the drag coefficient becomes smaller. Moreover, for the same B/H, the drag coefficient decreases when Ds/H increases. The reason is that the pressure at the front face is not changed much, but the pressure at the rear face increases (see Table 4). The pressure difference between the front and rear faces of the first block becomes smaller for larger Ds/H. Therefore, for the same B/H, drag coefficient decreases with an increase in Ds/H.
This result contrasts with theresultobtained by Shah et al.[5], who investigated the drag coefficient and lift coefficients of a single block with the underscouring Ds/H=0.25 and without underscouring (Ds/H=0). Their results showed that when Ds/H changes from 0 to 0.25, the drag coefficient increases from 0.57 to 0.66, respectively, and the lift coefficient decreases from 0.70 to 0.58, respectively.
The drag coefficient for submerged Large Woody Debris (LWD) can be compared to the drag coefficient for bed protection blocks because both obstruct the flow. As in the case of flow in open channels, as was suggested by Wallerstein et al.[13], the drag coefficient is a function of the LWD element geometry (shape and orientation), submergence ratio (/zd, where z is the depth from the water surface to the center of LWD and d is the diameter of LWD), the Froude number (Fris based on approach velocity and diameter of LWD), and the Reynolds number. However, for intermediate to very large Reynolds numbers (1 000-30 000) and submergence ratios /8zd≥, the drag coefficient depends only on the LWD element geometry. Wallerstein et al.[14]noticed that at /8zd<,dC varies considerably with the submergence ratio and Froude number. They found that the drag coefficient increases with decreasing submergence ratio and that the drag coefficient reaches a maximum at =0.5Fr.
In this experiment the effects of submergence ratios and Froude numbers have not been considered because the objective is to analyze the drag and lift coefficients for different underscour depths and horizontal distances between two bed protection blocks. However, if the values of the submergence ratio, Froude number, and slenderness ratio (db/L, where dbis the height of the block and L is the width of block) are calculated using our study, then z/db=3.5, Fr=0.45, and db/L=0.04. For these values, the drag coefficient obtained from this study is greater than that (i.e., Cd=0.175) obtained by Wallerstein et al.[14]. Shah et al.[6]obtained similar values ofdC for the case of a single block, and we would have obtained a similar drag coefficient if there had been only a single bed protection block. The larger drag coefficient is due to the presence of two bed protection blocks and the space between them.
Hygelund and Manga[15]showed thatdC varies with the depth ratio for a single wooden log lying perpendicular to the flow at a certain height from bed surface. The depth ratio was defined as the height of the water below the wooden lgb divided by the sum of the distances above and below the wooden lg(+ab). Their results showed that Cdincreases by 2.5 times when the depth ratio increases from 0.2 to 1.0 and Cdincreases by this amount only for wooden log diameters smaller than or equal to one-third of the channel water depth. In this study, the block height is smaller than 1/3 of the channel water depth and the underscour depth is comparable to the height of the water below the wooden lgb. In this case, in contrast to the results obtained by Hygelund and Manga[15], the drag coefficient decreases with increasing depth ratio. This is due to the presence of another block behind it.
Hygelund and Manga[15]also noted that when wooden logs are placed near the bottom,dC does not seem to increase in their measurements. In contrast, our results shows an increase in the drag coefficient when underscour depths are smaller for the same horizontal spacing between two blocks, which is due to the stagnant water region created upstream and downstream of the block by the shallow underscour depth compared to a larger underscour depth.
Fig.8 Stability of bed protection block at different non-dimensional horizontal spacings (B/H) and non-dimensional underscour gaps (Ds/H)
2.5 Stability of bed protection block
Figure 8 shows the relationship of γ (angle made by resultant force and critical diagonal line) to B/H (horizontal spacing between two bed protection blocks) and Ds/H (underscour depth). It can be concluded that the bed protection block is stable only for Ds/H of 0.05 with B/H of 0.9-1. For all other cases, a bed protection block will collapse in these flow conditions. However, bed protection blocks are more stable with a shallow underscour than the deep underscour. It is hard to prevent the collapse of the bed protection block when two bed protection blocks have small spacing between them and a deep underscour. Therefore, for its stability, a horizontal distance of =BH should be maintained between two bed protection blocks, especially on the front side of the block-protected region where the scouring can easily occur. Wallerstein et al.[13]have reported that flow obstructing objects such as LWD can become (relative to a constant discharge) more stable (relative to displacement) at a given location in a channel through time because the drag force generated by a given flow acting on LWD may decrease with time, due to the erosion of the channel boundary. In this study, if we assume that underscour depth increases with time, then Fig.7 shows that the drag coefficient decreases with increasing underscouring depth. This result, although obtained using multiple bed protection blocks with multiple flow-obstructing objects, is similar to that of Wallerstein et al.[13](a single flowobstructing object). However, their results did not account for the fact that the stability of the flow obstructing objects (LWD) is affected by both drag force and lift force. Thus, our result shows that bed protection blocks are less stable through time (for deep underscour) due to the combined effect of drag and lift forces acting on them (see Fig.8).
3. Conclusions
This study has been conducted to determine the water flow pattern between two neighboring blocks to elucidate the pressure distribution around the scoured block, and to investigate the optimal spacing between two neighboring blocks when underscouring of first block occurs. The following conclusions can be reached from this study.
The flow patterns between two neighboring blocks are different for different horizontal spacings and underscour depths. It is noted that eddies are not generated with small horizontal gaps between two neighboring blocks and that larger eddies will be generated with wider gaps. Further, when underscouring is deep, eddies are generated but small in size compared to eddies generated when the underscour is shallow.
The effect of wider horizontal gaps can be assumed to be significant in reducing the pressure on the bottom surface of a scouring block. For small and large underscours with a small horizontal space (/B H), the pressure distribution on the bottom surface decreases from front to back. However, for a deep underscour and a wide horizontal space (/=1BH), the pressure distribution is almost uniform on the bottom surface. Moreover, when the size of horizontal gaps is increased, the pressure acting on the top surface and front face is not altered much, while the pressure on the bottom surface decreases and pressure on the rear face increases.
The drag and lift characteristics also explain the importance of wider spacing between two neighboring blocks during underscouring of the frontal block. Under the same underscour conditions, the lift and drag coefficients decrease when the horizontal gap between two blocks increases. Moreover, with the same horizontal gap between two blocks, the lift coe-fficient increases and the drag coefficient decreases with increasing underscouring depth. The results demonstrate that wider horizontal spacing between two blocks is effective to prevent or reduce the possibility of collapse of the front block when the underscouring becomes deeper.
With shallow underscouring depths, the bed protection blocks seem to achieve stability when gaps between two bed protection blocks (B) were equal to height of the block (H). The results in this study provide fundamental information about flow patterns around a block, the drag and lift coefficients, and the effect of horizontal spacing between two blocks on reducing drag and lift forces acting on them. For practical use, additional experiments are required to investigate the effects of the Froude number and block geometry on lift and drag coefficients of the bed protection block.
Acknowledgement
The authors would gratefully like to acknowledge the Maeda Engineering Foundation and Kyoritsu International Foundation for their financial support.
[1] BEEBE J. T. Flume studies of the effect of perpendicular log obstructions on flow pattern and bed topography[J]. The Great Lakes Geographer, 2000, 7(1): 9-25.
[2] TAMURA M., KINOSHITA M. and HAMAGUCHI K. et al. The relationship between the shape of the bed protection blocks and its drag and lift characteristics[J]. Flow-Induced Forces in Hydraulics, 2003, 2: 1-8(in Japanese).
[3] FUKUOKA S., FUJITA K. and MORITA K. Research on hydraulic design of slope protective works of revetment [R]. Report of PWRI, 1988, 2635: 25-27(in Japanese).
[4] RAHMAN K. M., MASHUD M. Numerical study of flow stabilization mechanism of stepped-nosed obstacle[J]. International Journal of Engineering and Applied Sciences, 2010, 2(4): 83-92.
[5] SHAH P., TANAKA N. and YUSAIYIN M. Turbulent flow over sharp edged object on bed: Scouring and nonscouring case[C]. Proceedings of the Twelfth International Summer Symposium: Japan Society of Civil Engineers, Funabashi, Japan, 2010, 81-84.
[6] TAYLOR Z. J., PALOMBI E. and GURKA R. et al. Features of the turbulent flow around symmetric elongated bluff bodies[J]. Journal of Fluids and Structures, 2010, 27(2): 250-265.
[7] LASKOVSKI D., STEVENSON P. and ZHOU J. et al. Distribution of lift force on cubic particle exhibiting sporadic movement during hydraulic conveying[J]. Powder Technology, 2007, 179: 59-64.
[8] INOUE K., TANAKA N. and YAGISAWA J. Stability condition of river bed protection block against floods[J]. JSCE Annual Journal of Hydraulic Engineering, 2009, 53: 961-966(in Japanese).
[9] TAKEMURA T., TANAKA N. Flow structures and drag characteristics of a colony-type emergent roughness model mounted on a flat plate in uniform flow[J]. Fluid Dynamics Research, 2007, 39(9-10): 694-710.
[10] TANAKA N., YAGISAWA J. Flow structures and sedimentation characteristics around clump-type vegetation[J]. Journal of Hydro-Environment Research, 2010, 4(1): 15-25.
[11] LIEN F. S., YEE E. and CHENG Y. Simulation of mean flow and turbulence over a 2D building array using high-resolution CFD and a distributed drag force approach[J]. Journal of Wind Engineering and Industrial Aerodynamics, 2004, 92(2): 117-158.
[12] CHANSON H. The hydraulics of stepped chutes and spillways[M]. Rotterdam, The Netherlands: A. A. Balkema, 2001, 384.
[13] WALLERSTEIN N. P., ALONSO C. V. and BENNETT S. J. et al. Distorted froude-scaled flume analysis of large woody debris[J]. Earth Surface Processes and Landforms, 2001, 26(12): 1265-1283.
[14] WALLERSTEIN N. P., ALONSO C. V. and BENNETT S. J. et al. Surface wave acting on submerged logs[J]. Journal of Hydraulic Engineering, ASCE, 2002, 128(3): 349-353.
[15] HYGELUND B., MANGA M. Field measurement of drag coefficients for model large woody debris[J]. Geomorphology, 2003, 51(1-3): 175-185.
10.1016/S1001-6058(11)60280-1
* Biography: SHAH Prem (1979-), Male, Ph. D. Candidate
TANAKA Norio,
E-mail: tanaka01@mail.saitama-u.ac.jp

- 水动力学研究与进展 B辑的其它文章
- EXPERIMENTAL STUDY OF CONDENSATION HEAT TRANSFER CHARACTERISTICS OF HORIZONTAL TUBE BUNDLES IN VACUUM STATES*
- THE NATURAL CONVECTION OF AQUIFERS WITH CONSTANT HEAT SOURCES AND ITS INFLUENCE ON TEMPERATURE FIELDS*
- EFFECT OF ESCAPE DEVICE FOR SUBMERGED FLOATING TUNNEL (SFT) ON HYDRODYNAMIC LOADS APPLIED TO SFT*
- EXPERIMENTAL STUDY OF AIRFLOW INDUCED BY PUMPING TESTS IN UNCONFINED AQUIFER WITH LOW-PERMEABILITY CAP*
- SIMULATION OF HYDRAULIC TRANSIENTS IN HYDROPOWER SYSTEMS USING THE 1-D-3-D COUPLING APPROACH*
- TOTAL PHOSPHORUS RELEASE FROM BOTTOM SEDIMENTS IN FLOWING WATER*