Enforcement actions and their effectiveness in securities regulation:Empirical evidence from management earnings forecasts
Yunling Song,Xinwei Ji
aSchool of Management,Zhejiang University,China
bSchool of Economics,Nankai University,China
Enforcement actions and their effectiveness in securities regulation:Empirical evidence from management earnings forecasts
Yunling Songa,*,Xinwei Jib
aSchool of Management,Zhejiang University,China
bSchool of Economics,Nankai University,China
A R T I C L EI N F O
Article history:
Accepted 15 December 2011
Available online 11 May 2012
JEL classification:
C31
D73
M41
Due to resource constraints,securities regulators cannot find or punish all firms that have conducted irregular or even illegal activities(hereafter referred to as fraud).Those who study securities regulations can only find the instances of fraud that have been punished,not those that have not been punished,and it is these unknown cases that would make the best control sample for studies of enforcement action criteria.China’s mandatory management earnings forecasts solve this sampling problem.In the A-share market,firms that have not forecasted as mandated are likely in a position to be punished by securities regulators or are attempting to escape punishment,and their identification allows researchers to build suitable study and control samples when examining securities regulations.Our results indicate that enforcement actions taken by securities regulators are selective.The probability that a firm will be punished for irregular management forecasting is significantly related to proxies for survival rates.Specifically,fraudulent firms with lower return on assets(ROAs)or higher cash flow risk are more likely to be punished.Further analysis shows that selective enforcement of regulations has had little positive effect on the quality of listed firms’management forecasts.
ⓒ2012 China Journal of Accounting Research.Founded by Sun Yat-sen University and City University of Hong Kong.Production and hosting by Elsevier B.V.All rights reserved.
1.Introduction
Due to resource constraints,securities regulators cannot discover and punish all instances of fraud.Therefore,many firms escape exposure and/or punishment.This leads to an important line of questioning,namely how do securities regulators identify questionable firms to examine?Is their targeting random or selective? Unfortunately,due to the absence of suitable control samples,1Previous studies have only used sample firms with punished irregularities.They have not used firms that have not been punished but have actually had irregularities.explorations of securities regulation preferences are rare.Management earnings forecasts(hereafter referred to as MFs)provide us with the opportunity to solve this issue.In the A-share market,MFs are mandatory.Firms with performance that meets specific criteria must forecast within specified time periods.Since 2000,some of the firms that have not forecasted as mandated have been punished by securities regulators,but most escaped punishment.Under these conditions,samples of firms that have been fined and firms that have escaped punishment can be built simultaneously(and used as a control sample)with homogeneous instances of fraud,which solves the sampling problems confronted by researchers.
Our results indicate that the enforcement actions of securities regulators are selective.The probability that afirm will be punished for irregular forecasting is significantly correlated with proxies for survival rates.Speci fically,fraudulentfirmswithlowerreturnonassets(ROAs)orhighercash fl owriskaremorelikelytobepunished.
From a conservatism perspective,selective enforcement is unquestionable.In China’s one-way trading system,investors can only profit from increases in stock prices,and the principle of value investment states that a price increase is the result of good news,while a lower survival rate is the result of bad news.Therefore, the punishment of firms using bad news becomes a breaking point.In a market with perfect delisting regulations,most punished firms disappear from the capital markets(Beasley et al.,1999),making the study of their post-punishment disclosure behavior impossible.In the A-share market,however,the delisting mechanism plays almost no role and most punished firms survive year after year without any instances of delisting.This provides us with a good opportunity to examine the effects of enforcement actions.
The majority of the enforcement actions against MF irregularities occurred from 2000 to 2002.We examine the effects of the enforcement actions on the quality of MFs disclosed during the period from 2002 to 2009. Our results indicate that the effects of enforcement actions were different to expectations.First,the preference for selective enforcement has not proven a significant threat.The forecasting precision and accuracy of firms with a lower survival probability are still significantly lower than those with a higher survival probability.Second,the enforcement actions did not significantly improve the precision and accuracy of the subsequent forecasts issued by the punished firms.
This study makes two main contributions.First,we resolve the sampling problem that has previously limited the research on securities regulations.Specifically,we simultaneously create punished and unpunished samples with the same irregularity,complementary to the literature represented by Chen et al.(2011).Second, we examine the effects of enforcement actions on MF quality as one of the important aspects of listing firms’information disclosure(Bai,2009).
The remainder of this paper is organized as follows.Section 2 reviews the related literature and discusses our research logic.Section 3 discusses the institutional background of management forecasting in China. Section 4 analyzes the enforcement actions applied to MF irregularities.Section 5 discusses the effects of these enforcement actions.Conclusions are presented in Section 6.
2.Literature and research logic
2.1.Preferences in securities regulation
Beneish(1999)and Dechow et al.(1996)note that due to resource constraints securities regulators cannot detect and punish all instances of fraud.This reality presents the question:what types of fraud do securitiesregulators prefer to investigate?Unfortunately,there are few studies that address this question.Pincus et al. (1988)points out that the SEC pays more attention to newly listed firms because they are more likely to commit fraud.According to an analysis of select regulators,Kedia and Rajgopal(2011)suggest that securities regulators in the US prefer to target listed firms within 100 miles of their offices,but that this focus does not necessarily lead to an increase in the probability of being punished.Therefore,their research cannot be classified as a strict study of enforcement preference.Chen et al.(2011)make a breakthrough by studying firms under the special institutional environment in China.They provide evidence that fraudulent firms owned by the state received a less serious punishment than those that are not state-owned.These results only cover fraudulent firms that have been punished,however,and do not apply to those that have not.Therefore, although they can examine the degree of punishment,it is impossible for them to study the probability of being punished.It is this probability that this study aims to explore.
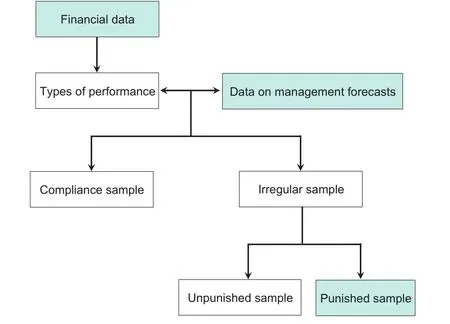
Fig.1 presents the sampling map.We use the financial data of listed firms to determine performance and infer the observations obliged by regulation to issue MFs.Comparing the MF records then allows us to find observations that are consistent with MF irregularities,called fraud firms.Based on enforcement action records,these fraud firms can be further classified into two subgroups:punished and unpunished.Then we can study the factors influencing the probability of being punished.
2.2.Effects of enforcement actions
From the perspective of securities regulators,punishment is an instrument,not the aim-the fraud occurred and while punishment cannot change history it can deter future instances of fraud.Therefore,an effective punishment warns all firms,including punished firms.Luo et al.(2005)examine the effect of enforcement actions by studying whether punished firms were punished again after the first punishment.They find that many firms have been punished again,many times in some cases,after the first punishment.This suggests that the effects of enforcement actions are not as expected,and although their results are interesting,their sample design has the same drawback as that of Chen et al.(2011).That is,they only cover the fraudulent firms that have been punished without considering their unpunished counterparts-a group that may even represent a majority.
Chen et al.(2005)analyze the market reaction to the disclosure of enforcement actions.They argue that the CSRC is far from a“toothless tiger”because the market reacts negatively to the disclosure of enforcementactions.This line of reasoning is questionable,because the market reaction reflects the informational content of fraud disclosure rather than the CSRC’s effectiveness.2Event studies usually examine information content.In the announcement of enforcement actions,the most informative is not the punishment,but the fraud.In fact,most event studies of enforcement actions(such as Feroz et al.,1991;Wu and Gao,2002)examine the information content of fraud disclosures rather than the effectiveness of securities regulators.
We argue that research on the effects of enforcement actions should focus on a longer window.For example,Farber(2005)finds that punished firms take actions to improve their governance,because investors appear to value governance improvements.3Firms that take action to improve governance have superior stock price performance,even after controlling for earnings performance.In line with that theory,Li(2007)examines how the credit-file system established in the Shanghai Securities Exchange and the Shenzhen Securities Exchange impacts the improvement of the quality of listed firms’accounting information.Li uses accounting conservatism as an indicator of accounting information quality to find that the credit-file system enhances the quality of accounting information to a certain extent,but that the result is not as significant as expected.
Another method of measuring the effect of fraud punishments is to examine whether regulatory preferences influence the behavior of listed firms.If regulators prefer to target certain fraudulent firms,the expectation would be that other firms in that category would work harder to avoid detection and punishment.In other words,regulatory preferences should push such firms to improve the quality of their information disclosure. Kedia and Rajgopal(2011)provide evidence of this,specifically that listed firms within 100 miles of the offices of securities regulators display a significantly lower probability of restatements than their counterparts that are located further away,because securities regulators in the US are inclined to pay more attention to listed firms within 100 miles of their offices.
We use MF quality as an indicator of listed firms’information disclosure quality and examine the effects of enforcement actions in two ways:regulatory preferences and punishment history.Fig.2 shows our research logic.If regulatory preferences can change the information disclosure behavior of listed firms,then other firms in similar situations should make MFs of a higher quality.In contrast,if other firms in similar situations have not provided MFs of a higher quality,or even of lower quality,then we argue that regulatory preferences do not provide a sufficiently strong deterrence.
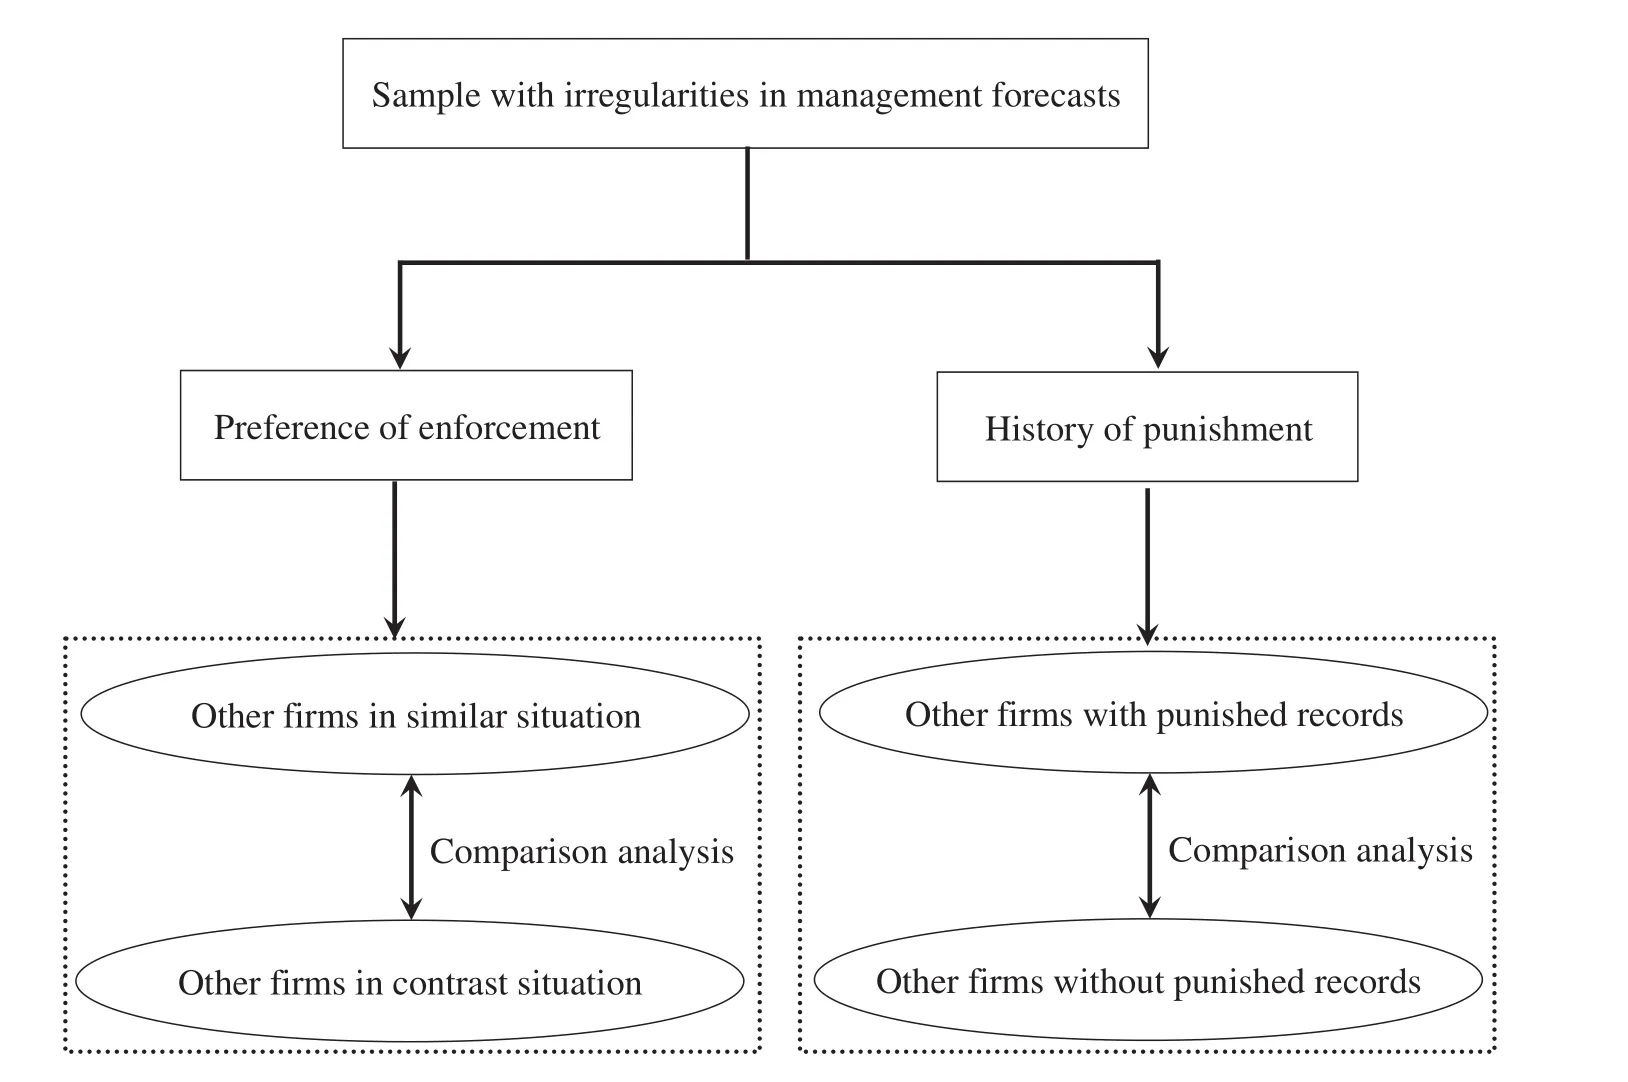
Fig.2.Research logic for studying the effects of enforcement actions.
Similarly,if regulators’punishments warn previously punished fraudulent firms,they should provide a higher quality of information when forecasting in subsequent periods.If they have not provided a higher quality of MFs in subsequent periods,we argue that the punishment did not provide a sufficiently strong deterrence.
3.Institutional background
3.1.MF regulations
A-share firms began to issue MFs in the 1998 fiscal year.Before that,listed firms only provided MFs for approximately three subsequent years when they were targeting an IPO.Following the success of an IPO,fewfirms provided additional information about future earnings.Due to this lack of information,stock prices had a tendency to fl uctuate substantially on future earnings,particularly when loss firms released their annual reports.In 1998,securities regulators in China required firms with a three-year continuous loss or a one-year material loss to make their MFs on time,4Specified in the second item of“Notice on the Work of 1998 Annual Reporting”.aiming to alleviate the information asymmetry between listed firms and their investors and reduce price fluctuations around the announcements of annual reports(Xue,2001). This regulation did not change5Specified in the seventh item of“Notice on the Work of 1999 Annual Reporting”.in 1999 and at the close of 2000,MF regulations began to evolve.Panel A of Table 1 summarizes the key changes to MF regulations.
In the first phase,the firms expected to make MFs were expanded from“a three-year continuous loss or a one-year material loss”to“a one-year loss”.Meanwhile,the deadline for forecasting was specified.According to the Notice with regards to 2000 annual reports,6Specified in the10th and8th items of“Notice on the Work of 2000 Annual Reporting”issued by the Shanghai Securities Exchange and the Shenzhen Securities Exchange,respectively.Subsequently,the contents of“Notice on the Work of××Periodic Reporting”issued by the Shanghai Securities Exchange and the Shenzhen Securities Exchange are fundamentally indeterminate.Therefore,we refer to them hereafter as Notice without pointing out the particular items.“Firms that forecast a loss in 2000 should make MFs within two months after December 31,2000.Firms that forecast a three-year continuous loss should make at least three forecasts within 2 months after December 31,2000”.
In the second phase,firms expected to make MFs also included from“loss”to“profit”firms.According to the Notice with regards to the interim reports of 2001,firms that forecast a loss or a big decline in earnings should make MFs in a timely manner before July 31,2001 and suspended firms should make their loss forecasts within 15 working days after June 30,2001.At that time,there were no clear definitions regarding what qualified as a“big”decline in earnings.On September 4,2001 the Shanghai Securities Exchange and the Shenzhen Securities Exchange simultaneously criticized firms that had experienced a big decline in earnings, but had not forecast them.7According to the Basic Maxim on the Investigation and Settlement of Securities Frauds by Chinese Securities Regulation Commission and the Maxim on the Evidence of the Investigation and Settlement of Securities Frauds by the Chinese Securities Regulation Commission,the CSRC can settle a case in one of the following ways:withdraw,circulate a notice of criticism,pay an administrative penalty or transfer to another institution.Public criticism voiced by the securities exchange is included in the administrative penalty.From August,1997 the Shanghai Securities Exchange and the Shenzhen Securities Exchange became subordinate units of the CSRC,making“the behavior preference of securities exchanges fundamentally similar to that of the CSRC”(Liu,2006,p.28).Based on the reality of the authority system,“securities exchanges really have no authority to settle instances of fraud without the permission of the CSRC”(Liu,2006,p.28). Therefore,we view the“public criticism”voiced by securities exchanges as the intention of the CSRC.The number of firms criticized quickly rose to 24,making that day one of the most notable in the history of securities punishments.
In the third phase,firms expected to make MFs extended from“bad news”to“good news”,meeting investors’fundamental information needs.According to the Notice with regards to the annual reports of 2001,after the end of the 2001 fiscal year firms that forecasted a big loss or change(an increase or decrease of 50%or more)in total income compared to the previous year should make MFs within 30 working days after December 31,2001,while firms with relatively small comparison bases were exempt from forecasting.8The comparison basis is the absolute value of total earnings per share.For annual forecasting,the exempt criterion is 0.05 or less.That Notice also implemented two changes.First,good news was included for the firms expected to make MFs,in contrastto the previous focus on bad news.Second,the definitions of performance,percent of change and comparison basis were clearly specified to improve the feasibility of MFs.
In the fourth phase,the timing of forecasts was shifted from“after the end of fiscal periods”to“before the end of fiscal periods”,making the“forecasting”more literal.9According to the definition established by King et al.(1990),MFs are the voluntary disclosure of future earnings before announcements of actual earnings are made,including forecasts disclosed after the end of fiscal periods,but before the announcements of actual earnings.Research on voluntary disclosure,however,usually focuses on forecasts that have been disclosed before the end of fiscal periods(e.g.,Baginski et al.,2008).According to the Notice with regards to the first quarter reports of 2001,firms forecasting a big loss or change(an increase or decrease of 50%or more)in interim net income should make MFs in their first quarter reports.Thus,investors could obtain information about listed firms’future earnings at least two months earlier.
In the fifth phase,beginning from the third quarter reports of 2002,the forecasting of quarterly earnings was included.Finally,“loss-to-profit”was separated from“big increase”,which makes little difference.Beforethis separation,some“loss-to-profit”firms were exempt from forecasting.After separation,there was no exemption for“loss-to-profit”firms.
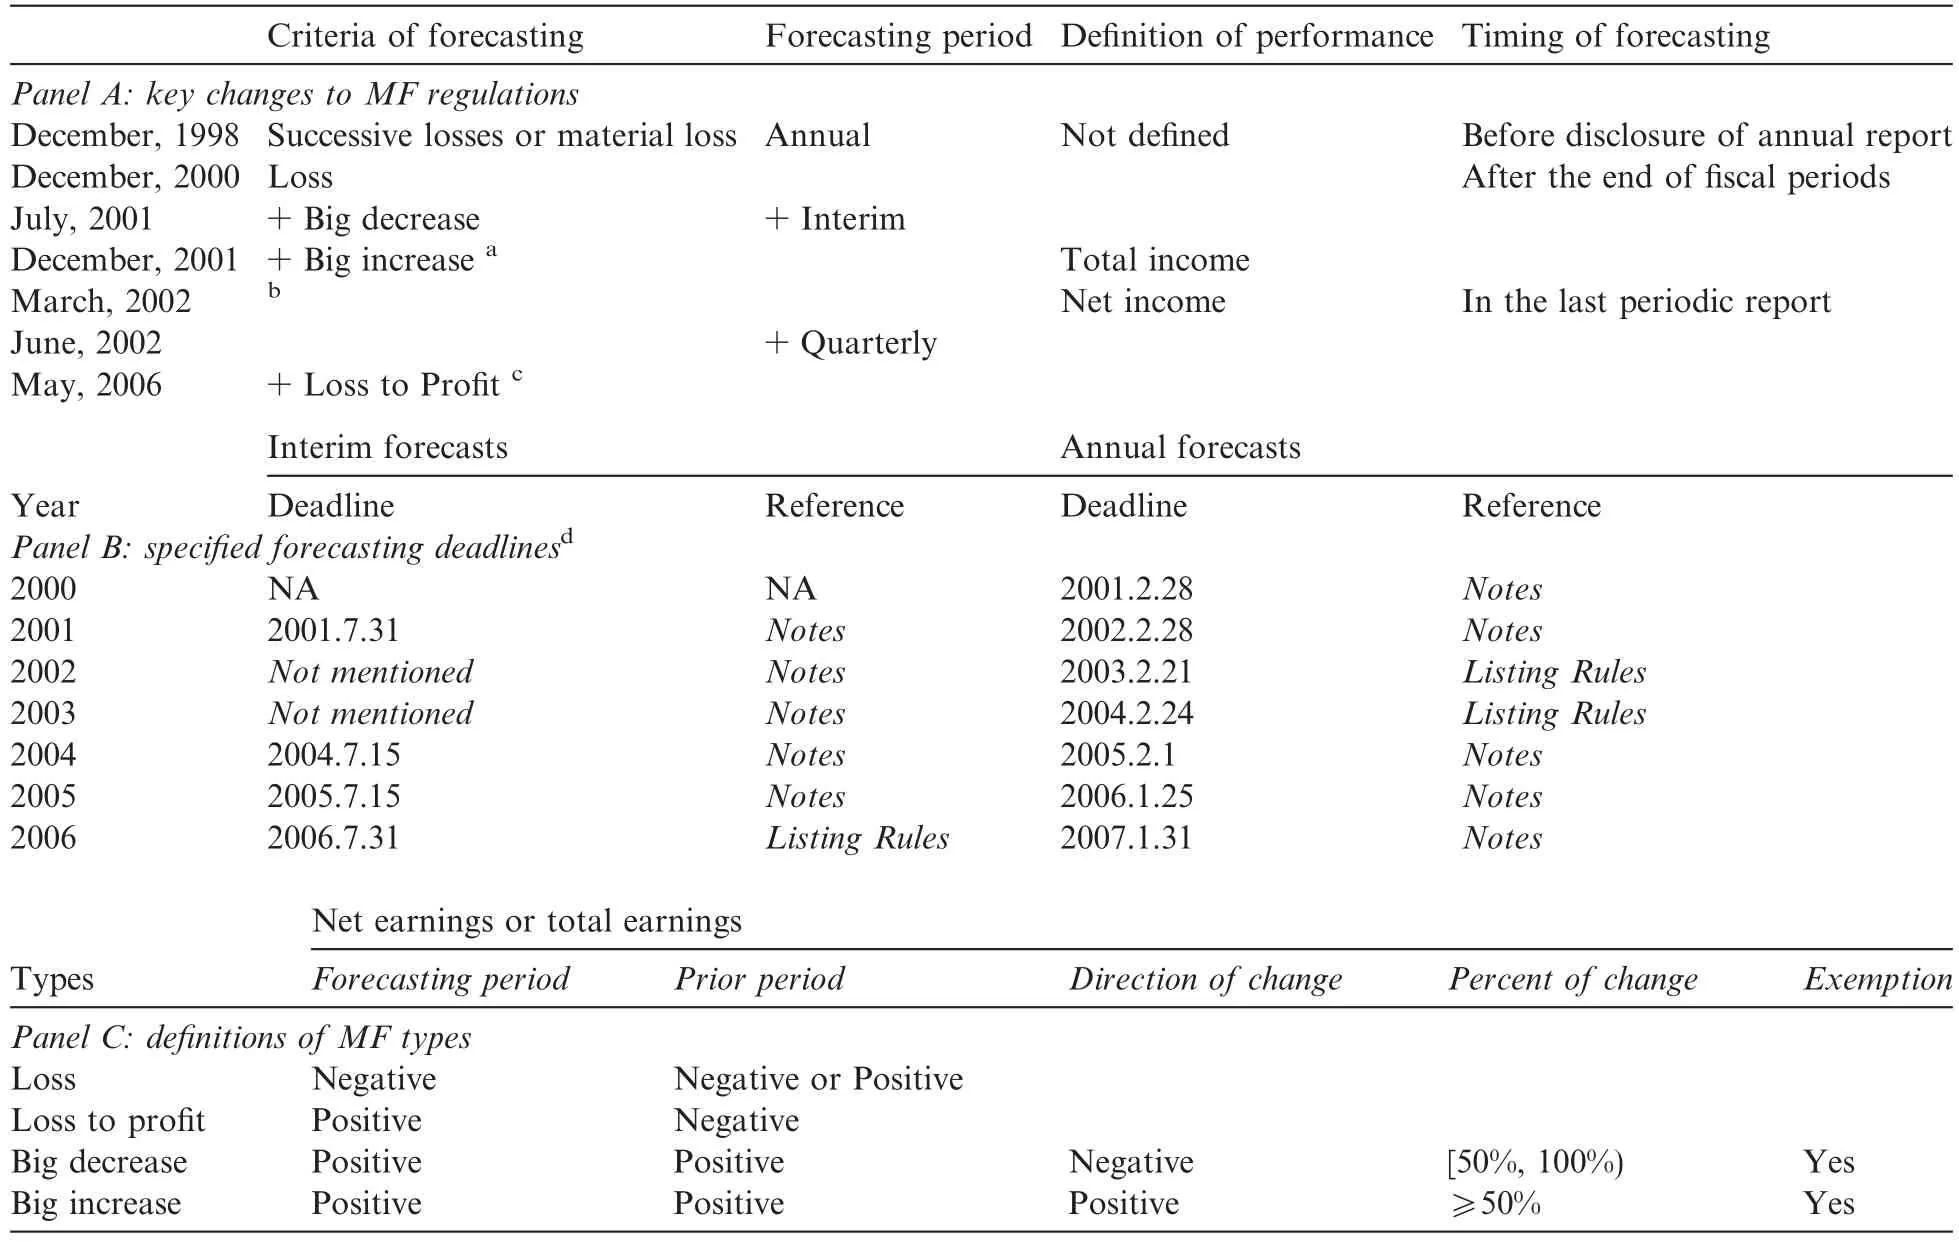
Table 1Changes and details of MF regulations in China.
The securities exchange also magnified their consideration of MFs when amending their Listing Rules. Table 2 summarizes the specifications for management forecasts in the current and historic revisions of the Listing Rules.It is clear that there is always a time lag between the amending of Listing Rules and their practice.For example,in practice,firms that experienced big changes were required to forecast from 2001,but the 2002 amendments to the Listing Rules did not reflect corresponding changes.In fact,the aforementioned changes were not made until December 2004.
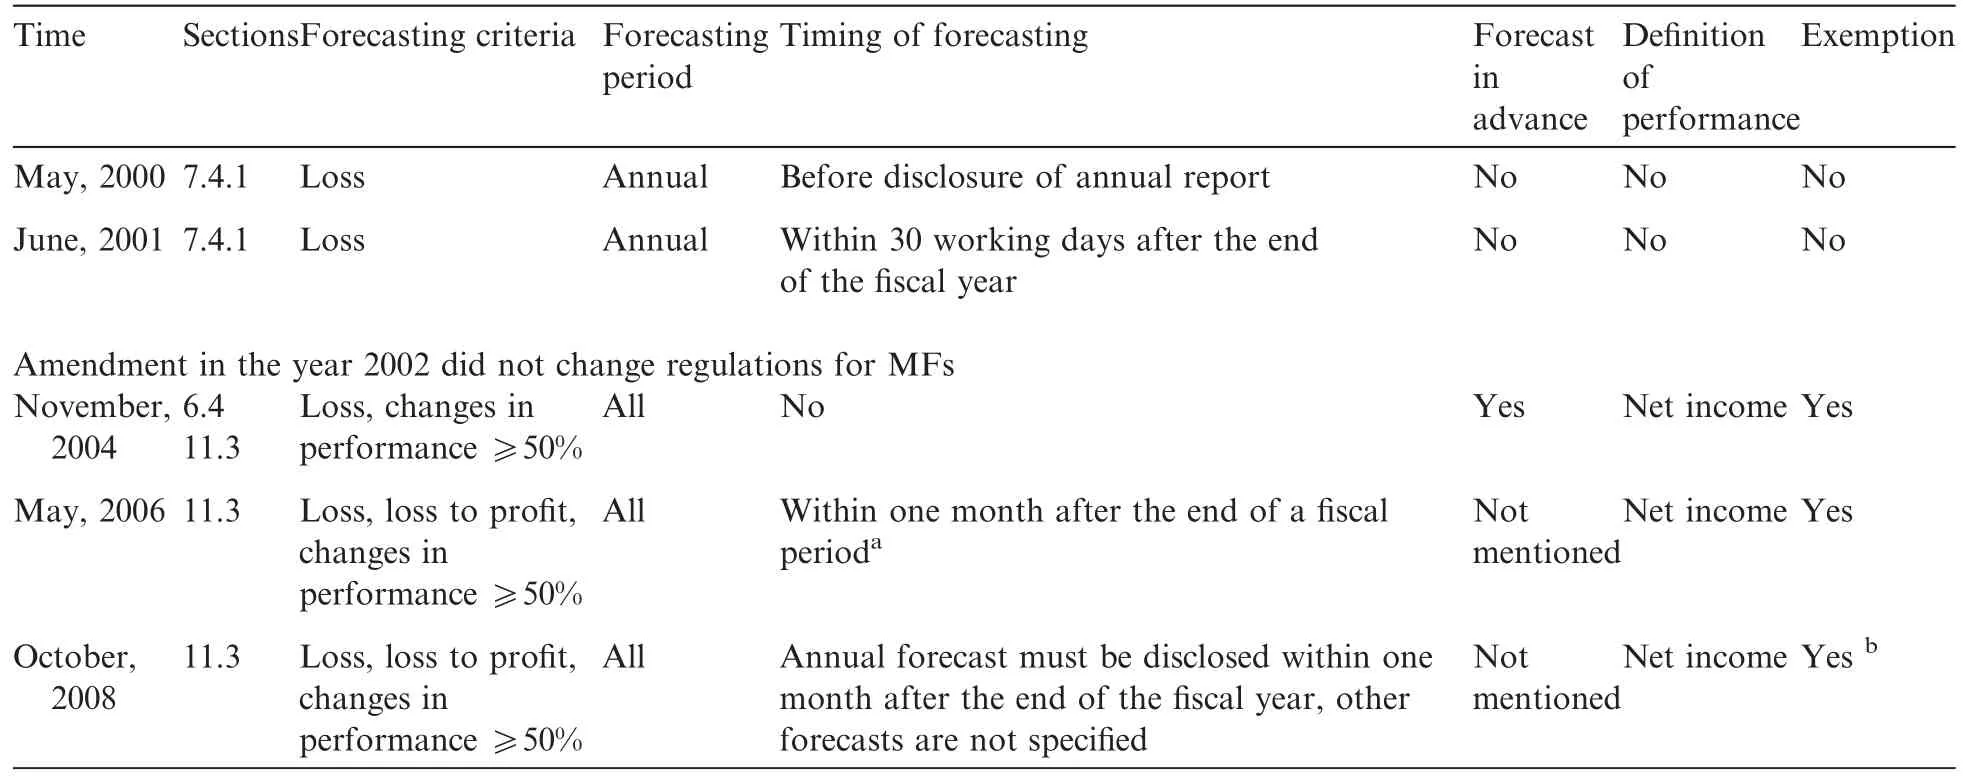
Table 2Regulations for MFs specified in Listing Rules.
3.2.Punishments for irregular management forecasts
The punishment of irregular management forecasts began with the annual forecasting of 2000 and peaked during the interim forecasting of 2001.There were sporadic instances after that period,but those punishments were usually enforced on firms that had experienced an annual loss.Table 3 summarizes the details of punishments for irregular management forecasts in the period from 2000 to 2006.10There are a total of 72 observations.We deleted one observation from the financial industry,one observation after delisting and one observation with regards to third-quarter earnings,so 69 observations remain.
The efficiency of securities regulations,with respect to the period that firms escaped punishment,is relatively high.Most irregularities are punished within three months.Unreported results indicate that the longest escape was 239 days and the shortest was a single day.
There are four types of irregular MFs:face-change forecasts,wrong forecasts,no forecasts and delayed forecasts.“No forecasts”and“delayed forecasts”are easily defined as firms that are expected to make an MF(i.e.,they fall into one of the four situations listed in Panel C of Table 1)but do not actually make a forecast or forecast after the deadline,respectively(see Table 1 for details).Because the punishment of delayed forecasts tends to associated with annual reports,delayed forecasts are usually issued in March or April,with more concentrated in April.
The term“face-change”is from a unique technique of Chuan opera in which characters appear to magically shift from one painted face to another.When related to capital markets,it is used to portray a dramatic change in the performance of listed firms.When talking about MFs specifically,a face-change forecast is whena firm issues an MF that is significantly different from an earlier one with regards to the same period.Luo and Song(2011)provide a detailed summary of this concept.Although a face-change forecast is covered by the changes between“continuous loss”and“loss-to-profit”,only firms that shift from“good news”to“bad news”or from“bad news”to“worse news”are punished(Table 3).Due to the uncertainty inherent in forecasting, regulators usually permit listed firms to revise their disclosed forecasts when necessary,but always before the deadlines listed in Panel A of Table 1.That is,firms that change their forecasts before the deadline will not be classified as irregularities by regulators.Therefore,face-change forecasts that are punished are usually disclosed in March or April of the following year,with the majority concentrated in April.
Theoretically,a wrong forecast means that the forecast performance is significantly different from actual performance.It is almost impossible to make a 100%correct forecast,however,and it is considered reasonable to allow for some error.As Table 3 shows,wrong forecasts are defined as firms that forecast profits when they actually experience losses.That is,there are qualitative errors.
As for actual performance,most of the punished observations are losses in the forecasting periods,while the others have a decline that is significant enough that only one firm is punished for overestimating a“small increase”as a“big increase”.In other words,the probability of being punished is low for firms with“good news”,even if they make irregular MFs.
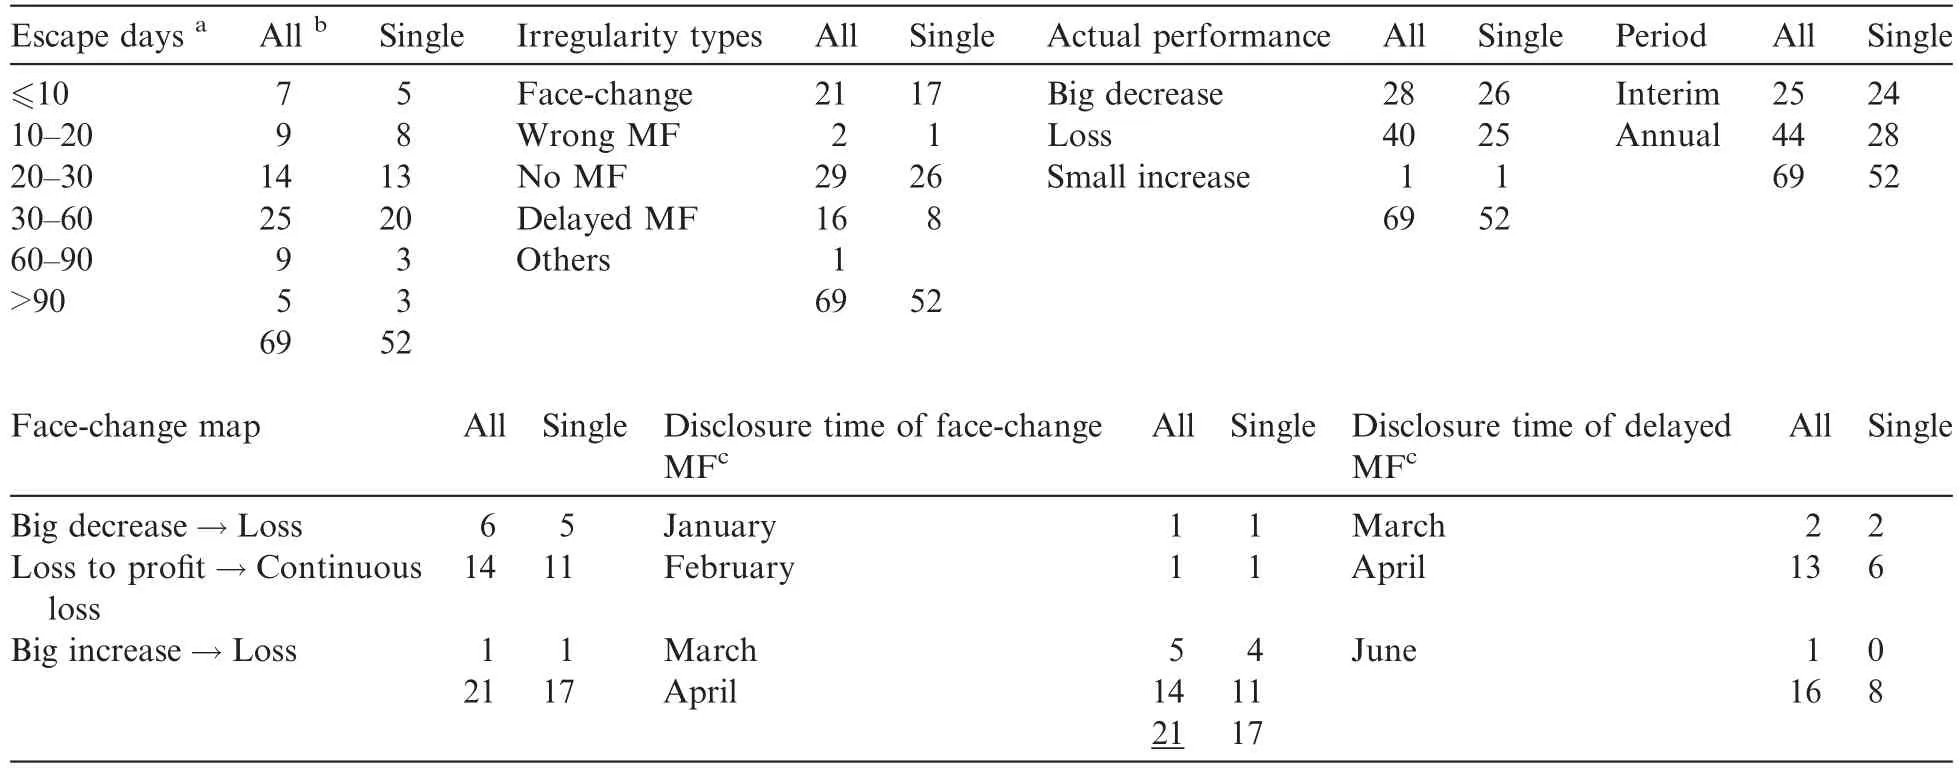
Table 3Details of MF irregularities from releases of enforcement actions.
3.3.Reasons for the existence of selective enforcement
Chen et al.(2011)provide detailed discussion of the reasons for the existence of selective enforcement in Chinese securities markets and pay particular attention to the ultimate nature of firms(i.e.,whether they are state-owned)than to the quality of listed firms,which is our focus.We argue that in a multiple-player game,the dominant strategy is to punish fraud firms whose survival rates are lower in order to maximize the utility of regulators for the following two reasons.
First,it is a self-protective incentive under the extant regulatory system.Liu(2006)portrays CSRC regulations as“all-around”,noting that,under an all-around regulatory system,the CSRC does not have the incentive to actively disclose listed firms’fraud.The CSRC has an incentive to supervise and publicly disclosethat information when,and only when,the fraudulent information is detected before a firm’s IPO,such as in the Kaili case mentioned by Chen et al.(2011).The CSRC is reluctant to publicly disclose fraudulent information detected after a firm’s IPO.For example,the suspicion that surrounded Lantian’s financial data prompted the CSRC to continuously decline Lantian’s refinancing proposals,despite the fact that the survey that generated the data did not take place until the break-down of Lantian’s cash chain(Liu,2006).
Second,it meets the political demands under government control.Luo et al.(2005)pointed out that,“under the dual pressure to develop and regulate the market,the value orientation of the CSRC is partly dissimilated as maintaining the stability of stock prices and the securities market,which acquiesces the existence of fraud. There are different penalty criteria in different times due to different regulatory demands and policies.Sometimes more firms are punished and the degree of punishment is heavier.In other times,fewer firms are punished and the degree of punishment is lighter.That is,the policy-orientation is significantly evident”. The one-way trading system enforces that effect.When investors can only profit from an increase in stock prices,firms with“good news”are inevitably protected and favored by stakeholders while firms with“bad news”may be neglected.When firms with“good news”commit fraud,stakeholders are more likely to actively lobby that those firms not be punished.When firms with“bad news”commit fraud,the resulting absence of lobby pressure allows securities regulators to exercise their authority by punishing them.At that time,stakeholders tend to stop resisting in the hope that they might receive some compensation in the future.11Chen et al.(2011)find that punished firms were given priority in their subsequent refinancing.
4.Selective enforcement actions for MF irregularities
4.1.Sample and descriptive statistics
According to the penalty records,we can classify the following observations as firms with irregular MFs:(1)firms expected to make a“loss”or“big decline”forecast that fail to make any forecast;(2)firms expected to make a“loss”or“big decline”forecast that fail to make any forecast before a stated deadline12The deadline for annual forecasting is March 1 of the subsequent year and the deadline for interim forecasting is August 1 of the current year.;(3)firms expected to make a“loss”or“big decline”forecast that fail to forecast correctly before a stated deadline13The deadline for annual forecasting is March 1 of the subsequent year and the deadline for interim forecasting is August 1 of the current year.and(4)firms not included in the previous three classes that overestimate their earnings through forecasts that are inconsistent with actual earnings.14Observations with a“small decrease”or“small increase”in performance(Table 3)fall into this class.Firms with a“small decrease”in performance might forecast a“small increase”or“big increase”.Firms with a“small increase”in performance might forecast a“big increase”.Observations with wrong forecasts also include some firms expected to forecast“big decrease”or“loss”that actually forecasted higher performance.The details of these observations are reported in Table 4.
Overall,the probability of being punished for MF irregularities is relatively low.15Among the 697 observations with MF irregularities,firms punished for irregular MFs represent less than 10%.After 2002,the attention that regulators paid to irregular annual forecasts and the probability of being punished was significantly lower than it was in 2001.Another interesting point is that about 10%of firms with MF irregularities were punished in the following year without any reference to MF irregularities in the announcements of the enforcement actions.
The financial data and market reactions of fraud observations are reported in Table 5.Because our observations include both annual and interim examples,we use the deciles of financial data to avoid potential confusion induced by the different lengths of fiscal periods.16The corresponding financial data of all A-share firms available in the database are ranked by fiscal periods and classified into ten groups(deciles).We examine the difference between the punished sample and the control sample from the perspective of survival rates.The financial variables with regards to survival rates include ROA,CFO,Growth and LEV.ROA measures accounting profitability,CFO measures liquidity,Growth measures growth ability and LEV measures solvency.The ROA of the punished observations is concentrated in the lowest quintile,while the observations with ROA in the highest quintile arerarely punished.Fraudulent firms with CFO in the lowest quintile are more likely to be punished than otherfirms,and those with CFO in the highest quintile are also rarely punished.Fraudulent firms with Growth in the highest quintile are significantly less likely to be punished than those with Growth in the lowest quintile.
Moreover,we analyze whether investor losses and the nature of the ultimate controller in fl uence the probability of being punished,as per Chen et al.(2011).As for the nature of the ultimate controller,most of the punished firms are owned by the state,which is in contrast to the results of Chen et al.(2011).We argue that the difference is due to different sample periods.As Table 4 shows,the punishment of irregular management forecasts was concentrated in 2001,when almost all firms were owned by the state.Chen et al.(2011)use a sample period that ended in 2008.From 2002 to 2008 many private firms went public through IPOs or the acquisition of listed firms,significantly lowering the percentage of SOEs among listed firms.The followingregression results also show that after controlling for timing differences,the influence of SOEs almost disappears.
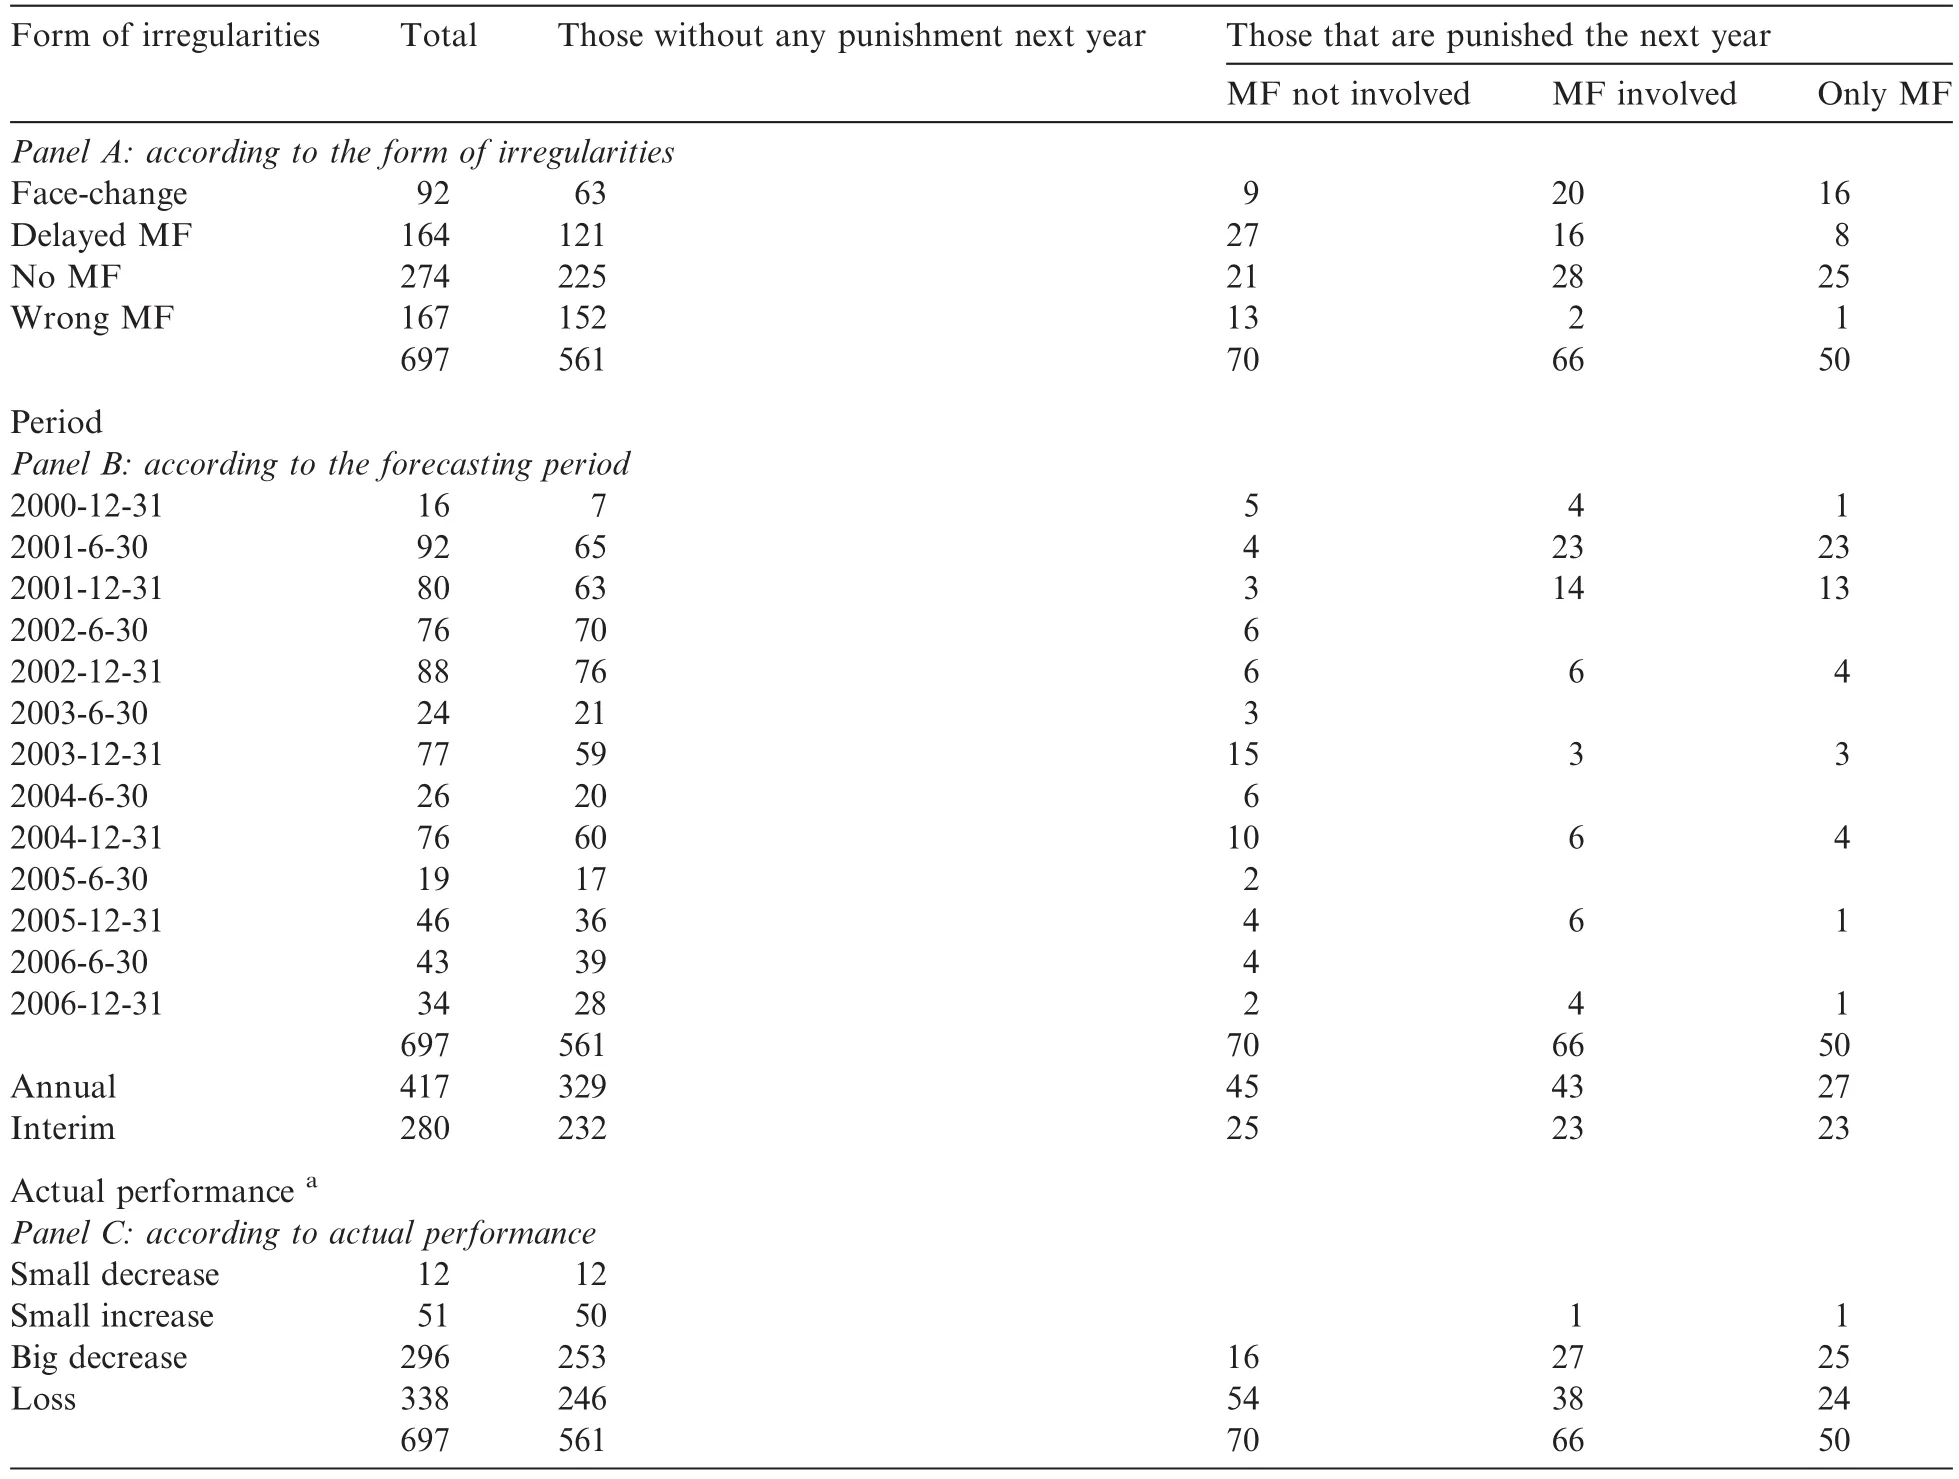
Table 4Summary of firms with MF irregularities.
Chen et al.(2011)also find that the degree of punishment is significantly positively related to investor losses. This study also examines the influence of investor losses,but through an event window around the detection day17For observations with“wrong forecasts”or“no forecasts”,the detection day is the announcement day of the corresponding periodic reports.For observations with“delayed forecasts”,the detection day is the forecasting day.For observations with“face-change forecasts”, the detection day is the day on which the face-change forecasts are released.of the fraud to measure investor losses-a much shorter period than that used by Chen et al.(2011).18In the Chen et al.(2011)sample,there is usually a two year or longer“escape period”before the fraudulent firms are punished by regulators.Before the announcements of enforcement actions,it is difficult for investors to get information on the existence of fraud by other measures.Our sample is different from theirs in three ways.First,the detection of MF irregularities is relatively simple,with no need to wait for punishment.Second,we do not find when the fraudulent activity begins for“delayed”and“no”forecasts.Finally,there might be an overlap between the announcements of MFs and actual earnings if we choose a longer event window,which would also introduce more confounding factors.As Table 5 shows,most of the punished frauds have negative CARs(losses to investors).
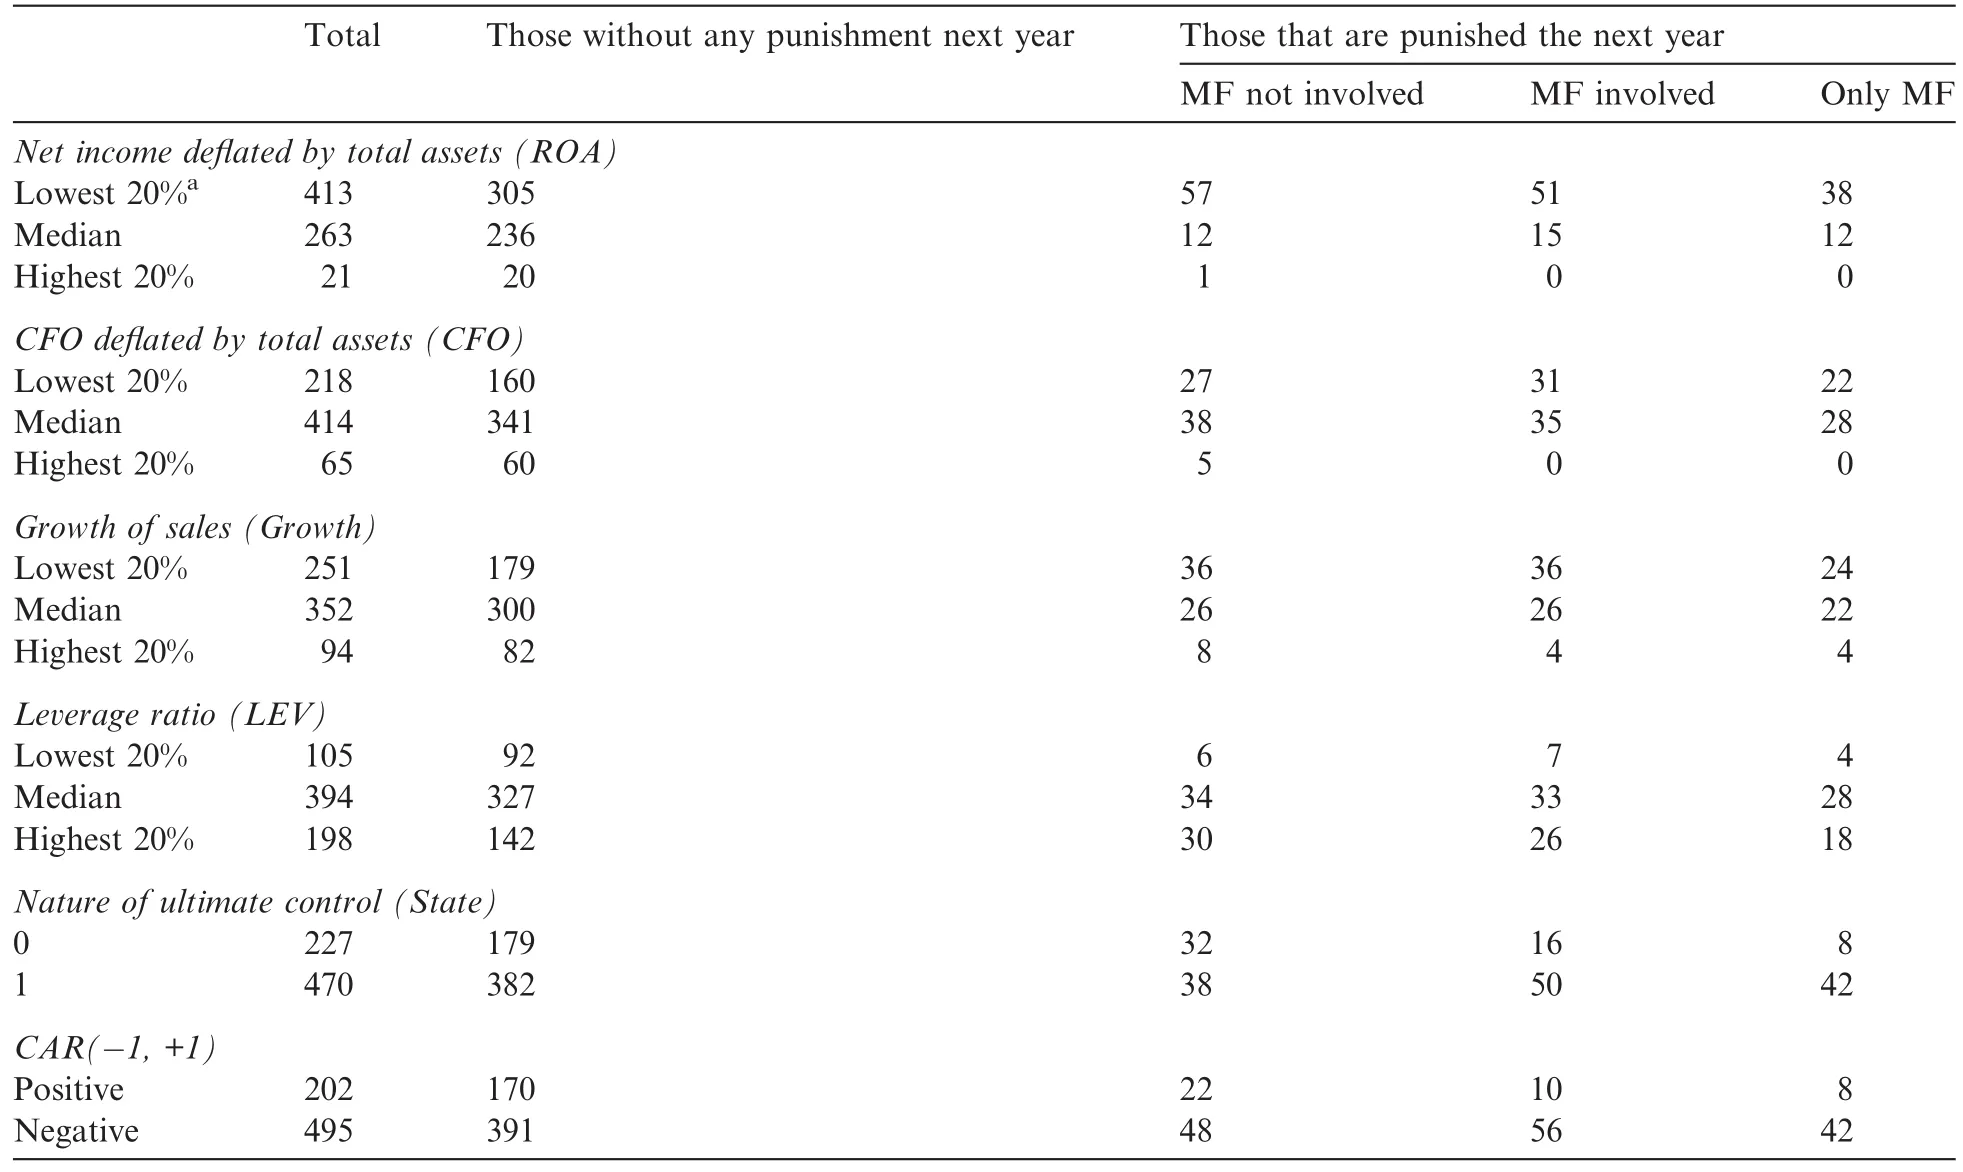
Table 5Description of independent variables.
4.2.Regression results
Because the punished observations make up a relatively small percentage of all observations and different sample sizes might influence the robustness of our results,we use both all sample observations and a matched sample in our regressions.The regression model is shown as follows:

In the regressions with the full sample,control variables include industry and year dummies.In the regressions with the matched sample,these control variables are not included because we select matched firms based on the same industry,the same forecasting period and the nearest total assets.
Because some observations are punished for reasons besides irregular management forecasts,we exclude them in the regressions reported in Table 6.That is,in the regressions reported in Table 6,we only use observations that are punished for irregular management forecasts as our study sample and those without any punishment in the following year as our control sample.The results indicate that investors’loss is the most important factor influencing the probability of being punished,which is consistent with Chen et al.(2011). After controlling for investors’loss,liquidity and growth potential also have significant influences on the probability of being punished.For example,in regression 3 of panel B,the estimated coefficient on Deciles of CFO is-0.292,significant at the 1%level.In regression 4,the estimated coefficient on Deciles of Growth is-0.156, significant at the 10%level.
4.3.Other potential factors
In the regressions reported in Table 6,observations punished for multiple reasons,including irregular management forecasts,are excluded.Does that exclusion influence the robustness of our results?We re-ran the regressions reported in Table 6 with those observations included and the results(Table 7)are fundamentally consistent with those in Table 6.
In summary,investor losses resulting from fraud is the primary factor influencing the probability of being punished.After controlling for investor losses,enforcement actions still exhibit some“selection bias”.The probability of being punished is negatively related to the fraudulent firms’accounting profitability,liquidity and growth potential.In other words,firms with lower survival rates are more likely to be punished.
5.Effects of enforcement actions on quality
In a market with perfect delisting regulations,fraudulent firms with lower survival rates delist from capital markets(Beasley et al.,1999),making the study of their post-punishment disclosure behavior impossible.In the A-share market,however,due to the scarcity of“shell resources”,19“Shell resources”means the qualification of listing.most fraudulent firms survive year after year without any instances of delisting,even if their survival rates are lower or they are technically bankrupt.This may impair the efficient allocation of resources,but it also provides us with an opportunity to examine the subsequent effects of punishments.
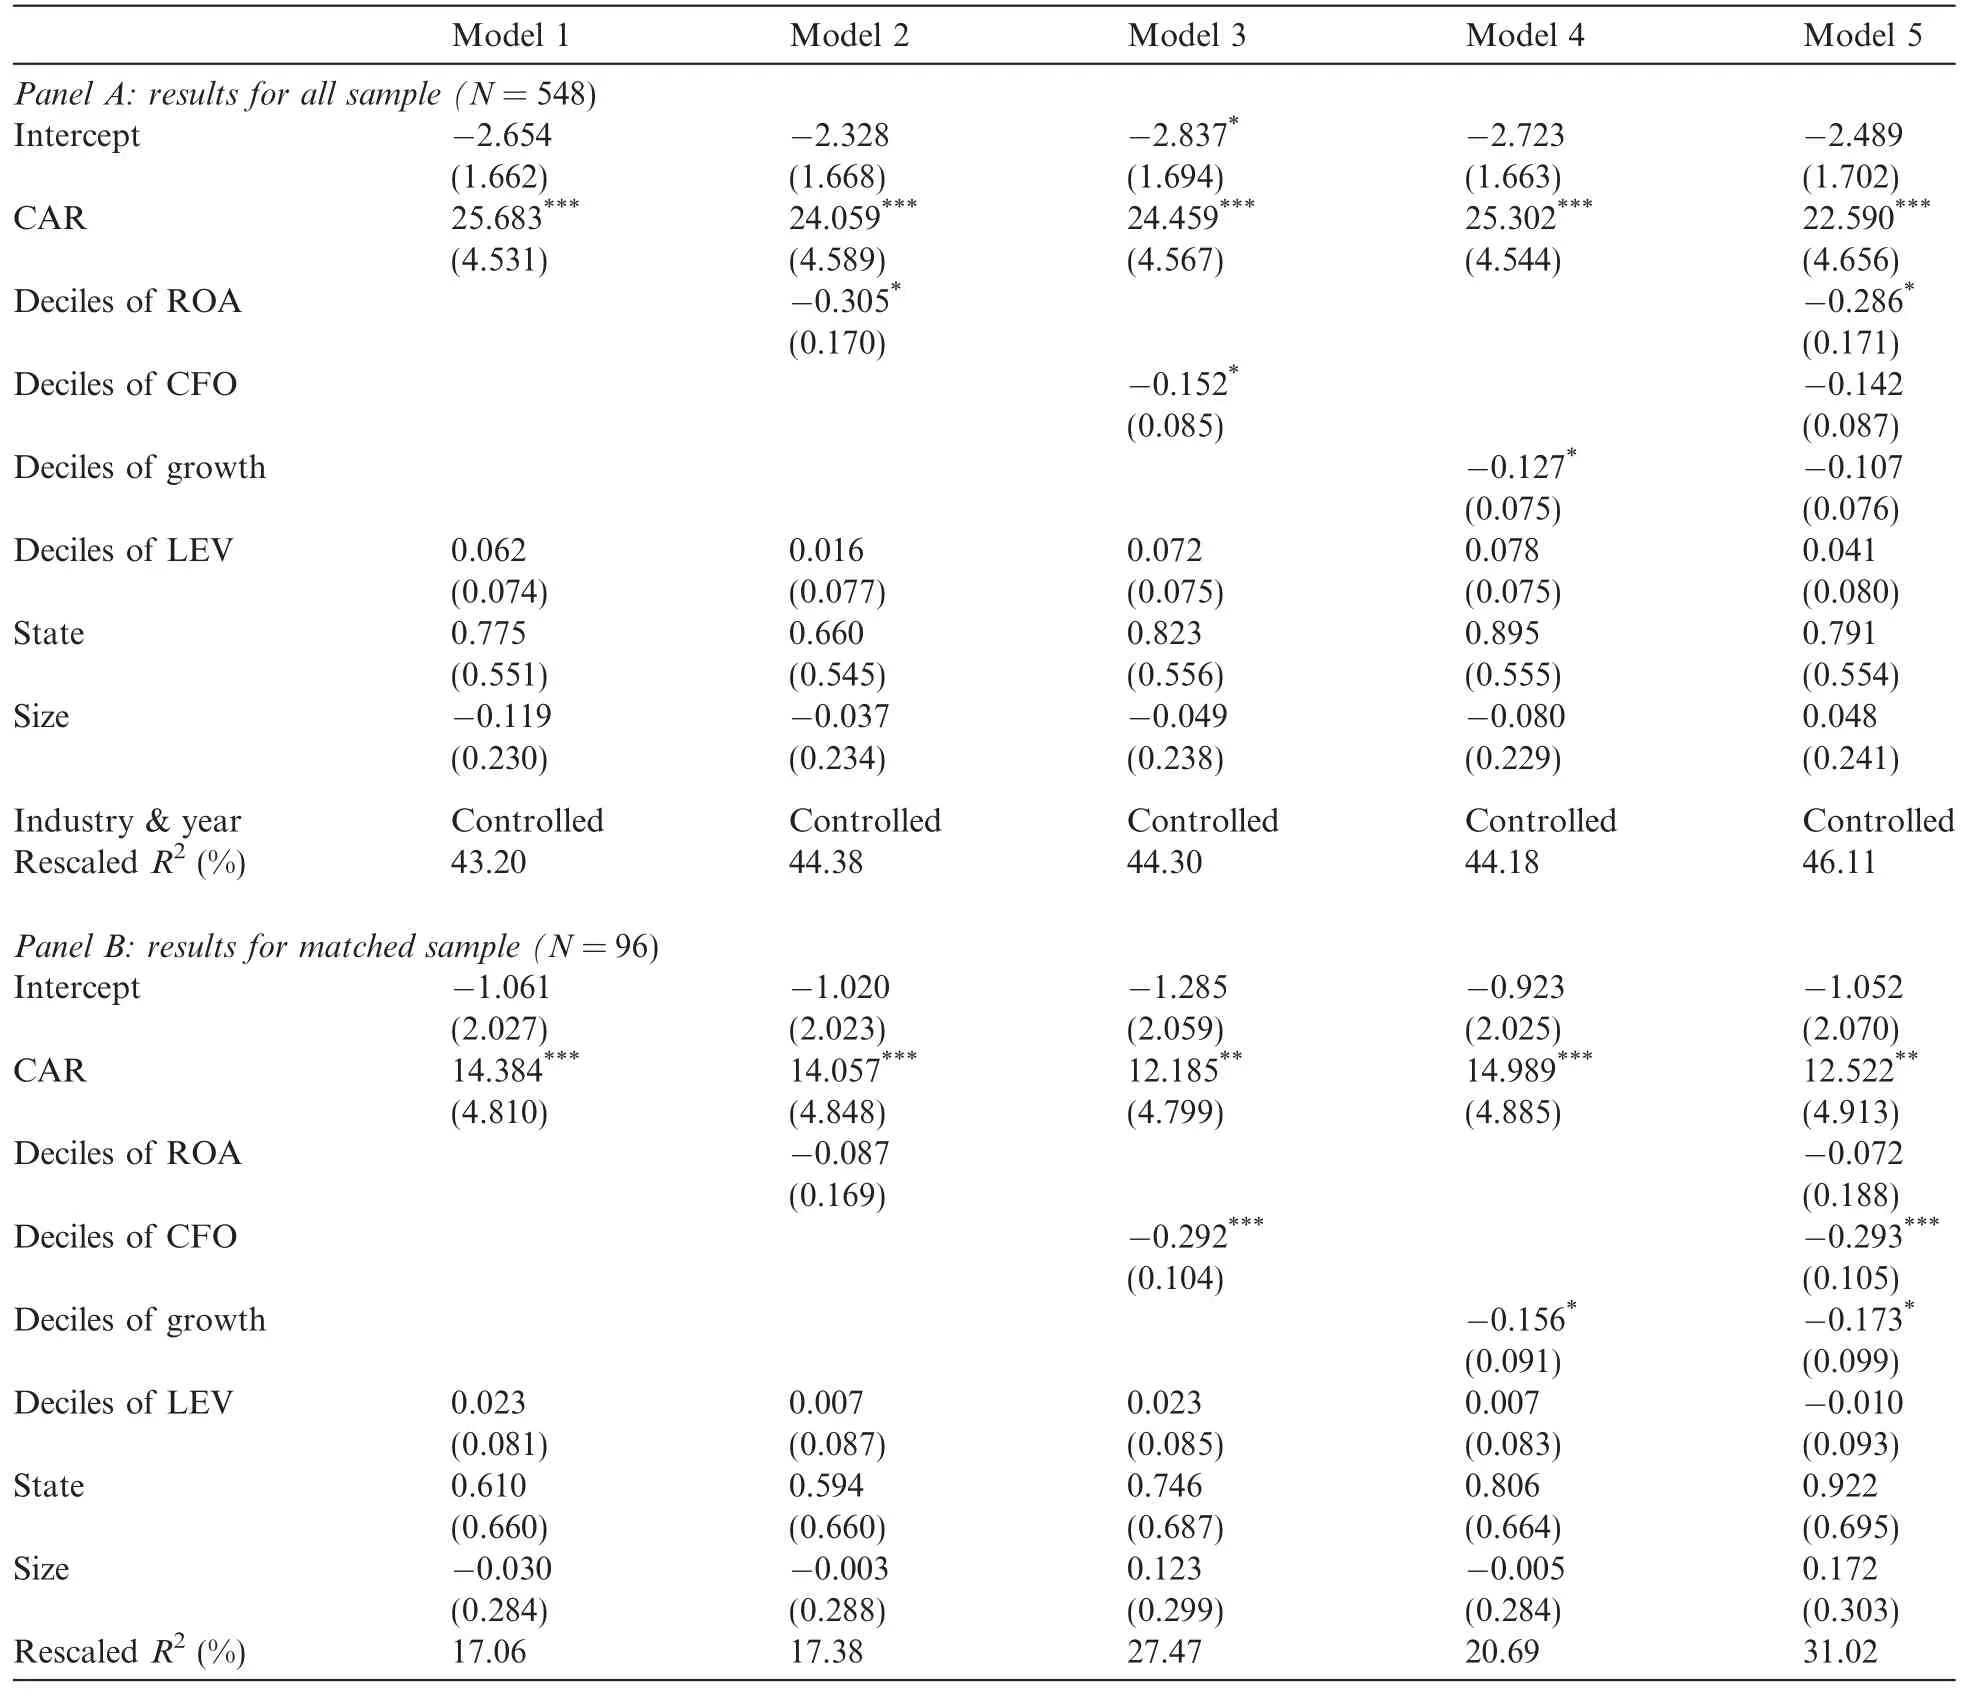
Table 6Results for sample with irregular MF only.
We examine the effects of enforcement actions through the quality of management forecasts for three reasons.First,management forecasts are an important part of listed firms’information disclosure and the quality of management forecasts can represent the quality of information disclosure(Bai,2009).20Bai(2009)finds that there is a significant positive relation between the information disclosure rating issued by the Shenzhen Securities Stock Exchange and the quality of management forecasts.Research on developed markets reveals that the quality of management forecasts is often used as a proxy for the quality of listed firms’information disclosure:see,for example,Graham et al.(2005)and Wang (2007).Second,it is easier to measure the quality of management forecasts without any sophisticated statistical models or subjectivejudgments.Third,there is consistency in the nature of the information disclosed.We examine the punishments for irregular management forecasts,but the best way to examine the effects of these punishments is to measure their effects on subsequent management forecasts.
We examine the precision and accuracy of annual MFs issued by A-share firms from 2002 to 2009.21We use the latest forecasts for firms that issue more than one forecast with regards to the same forecasting year.Extant research argues that MF quality is positively related to their precision and accuracy.
We examine the effects of punishments in two ways.First,we ask whether the preference of enforcement actions influences the disclosure behavior of other firms.Kedia and Rajgopal(2011)find that listed firmswithin 100 miles of the offices of securities regulators are significantly less likely to have restatements than their counterparts located further away because securities regulators in the US are inclined to pay more attention to listed firms within 100 miles of their offices.This means that the preferences of regulators can change the expectation of listed firms and has a significant influence on the disclosure behavior of other firms.We find that regulators are inclined to punish fraudulent firms with lower profitability,lower liquidity and lower growth potential.Does this regulatory preference improve the quality of MFs issued by firms in similar situations?We rank the corresponding financial data of all of the A-share firms available to get deciles by fiscal year.Then we choose MFs issued by firms that fall in the highest deciles or lowest deciles with the aim of examining whether there is a significant difference in the MF quality among firms in different deciles.
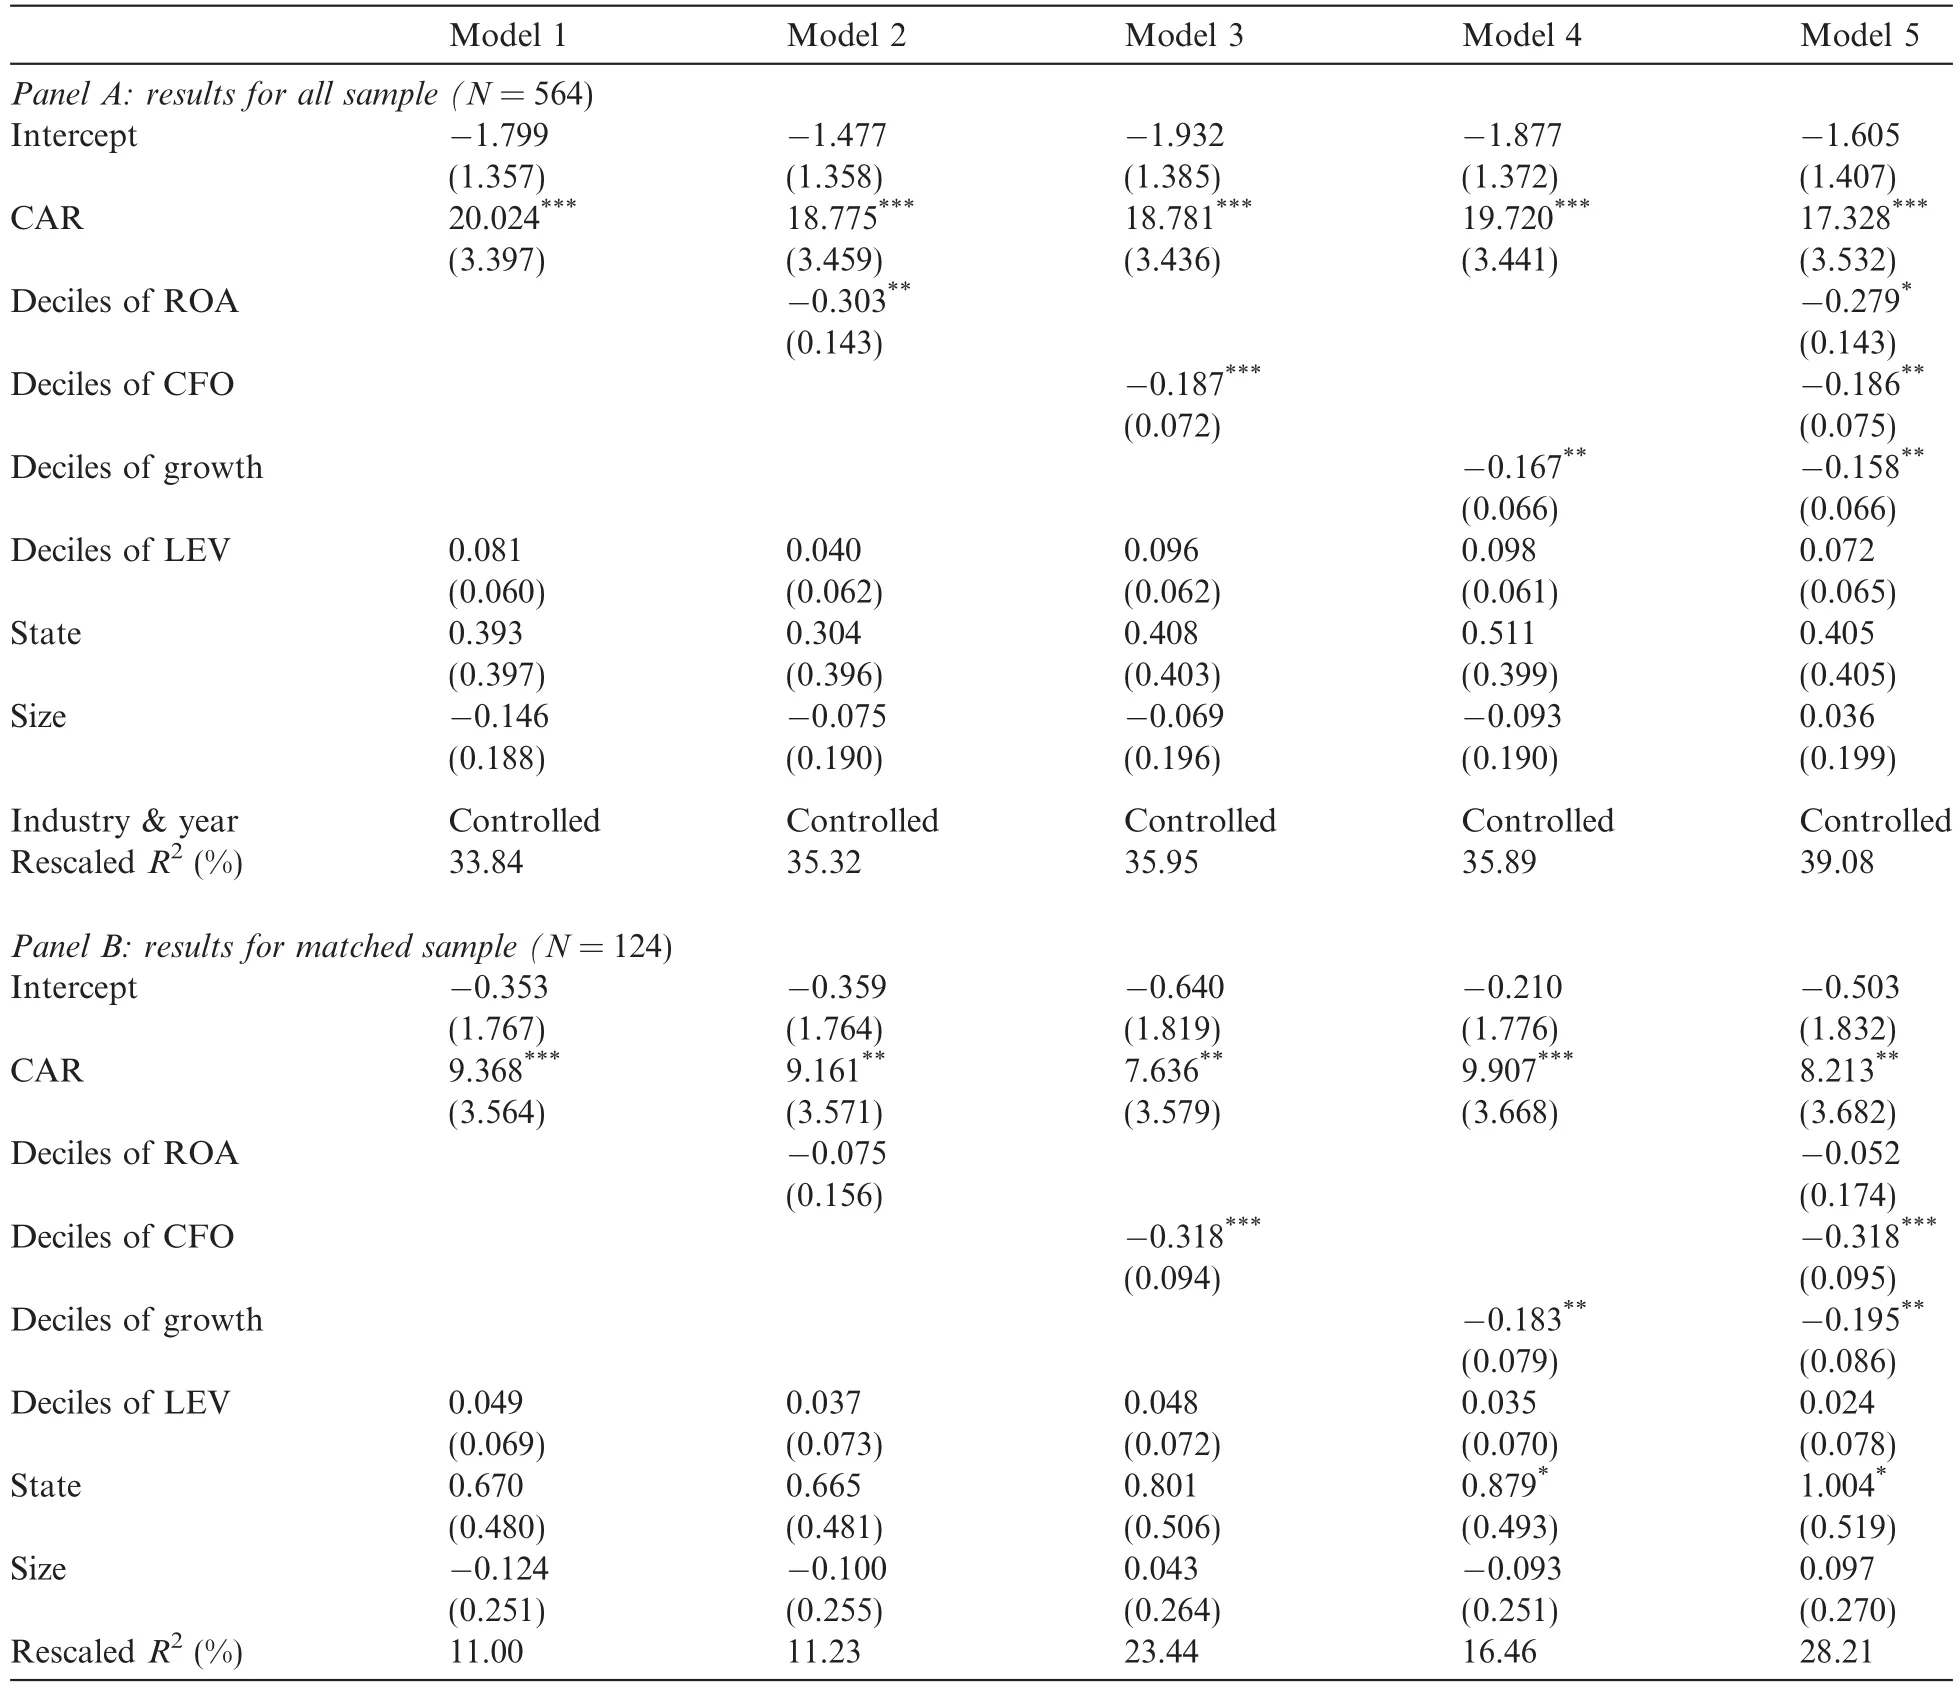
Table 7Results for sample with irregularities including irregular MF.
Second,we examine whether firms that have been punished for MF irregularities improve the quality of their subsequent forecasts to improve their image.Farber(2005)finds that punished firms take actions to improve their governance and improve the quality of their information disclosure.Because there is still controversy over whether corporate governance plays a role in A-share markets,22Another consideration is that most governance mechanisms for A-share firms are mandatorily planted,rather than voluntarily developed.we use the quality of information disclosure to directly measure the effects of punishment.The dependent variables are the precision andaccuracy of MFs,which are our proxies for MF quality.We use the models shown in Eqs.(2)and(3)to examine the effect of punishment after controlling for other factors that influence MF quality.
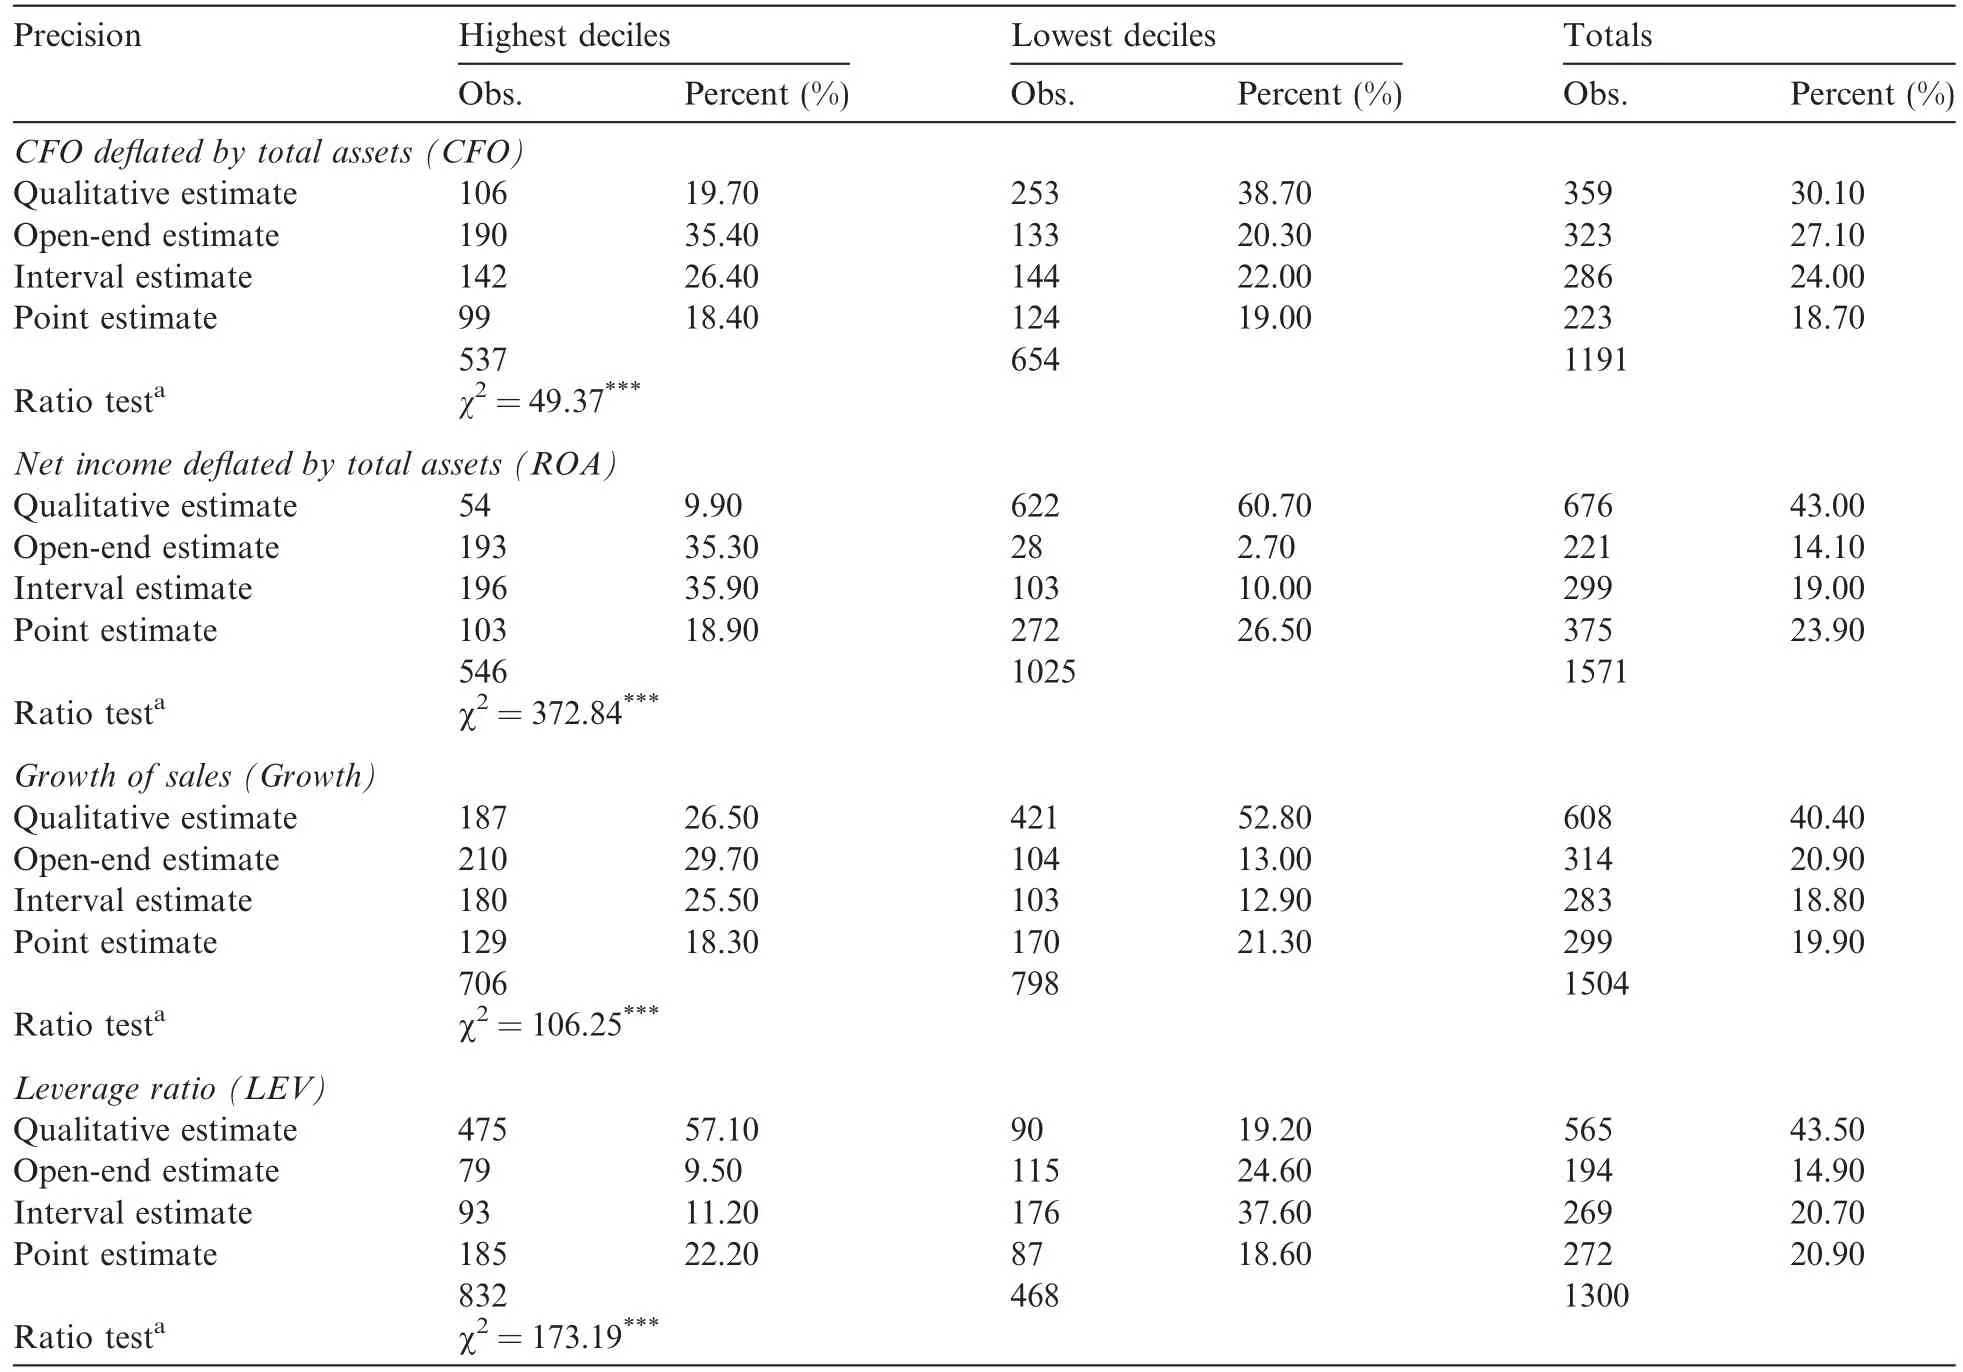
Table 8MF precision for observations with extreme values from 2002 to 2009.


Table 9Distribution of MF precision from 2002 to 2009.
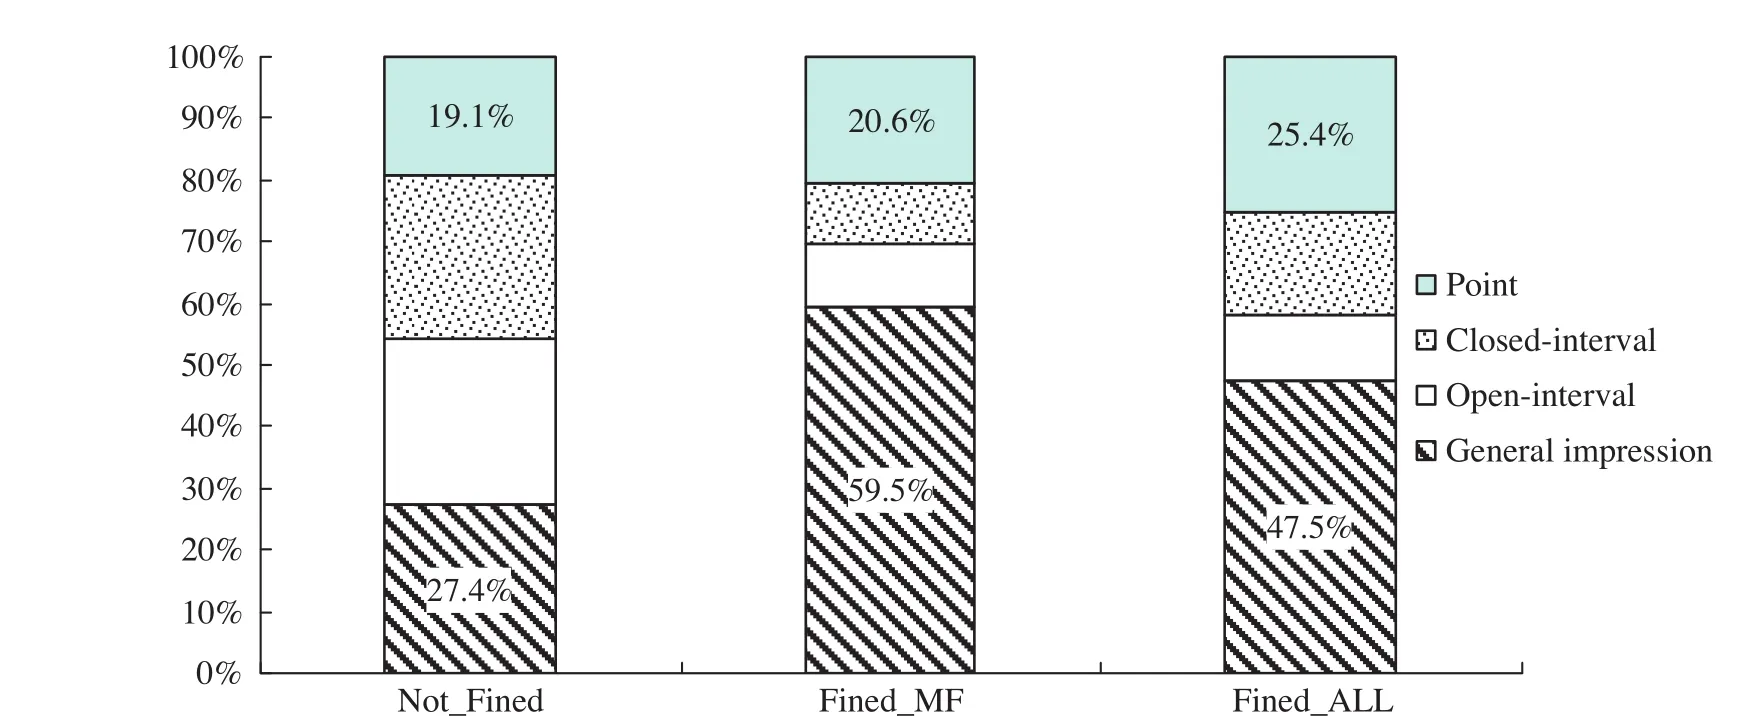
Fig.3.Distribution of forecast precision.Note:“Not-Fined”indicates firms that did not receive any punishment during the previous three years.“Fined_MF”indicates firms that were punished for MF irregularities,while“Fined_All”indicates firms that were punished for irregularities that did not necessarily include MF irregularities during the previous three years.
where Fined_MF equals 1 if the firm has been punished for an irregular MF in the past three years,and 0 otherwise.
The control variables are chosen according to the extant literature,including earnings volatility(Rank of EV,measuring forecasting difficulty),the level of earnings(ROA),the timing of forecasts(Month),an index offinancial distress(ST)and indices of corporate governance(State and Herf5),firm size,industry and year dummies.23Baginski and Hassell(1997)find that firms of small size with less earnings volatility are more likely to issue management forecasts with higher precision.Ajinkya et al.(2005)find that firms with higher earnings volatility provide less accurate management forecasts.Johnson etal.(2001),Ajinkya et al.(2005)and Karamanou and Vafeas(2005)all find that the accuracy of management forecasts that are disclosed earlier is lower than that of those that are disclosed later.Eames and Glover(2003)argue that the level of earnings must be controlled for when examining forecasting errors.Koch(2002)finds that firms in financial distress are more likely to issue misleading management forecasts.Johnson et al.(2001)find that the accuracy of management forecasts has a significantly negative relation to firm size.

We also examine whether the punishments induced by other irregularities influence MF quality.The regression models are shown as follows:where Fined_ALL equals 1 if the firm has been punished(not necessary for MF irregularities)in the past three years,and 0 otherwise.The control variables are the same as those in Eqs.(2)and(3).
5.1.Effects of punishment on MF precision
Table 8 analyzes whether regulatory punishment preferences influence MF precision.It is evident that punishment preferences do not efficiently deter other firms.For example,observations with CFO in the highestdeciles issued more quantitative forecasts than those with CFO in the lowest deciles.That is,the quality of the former’s MFs are higher than those of the latter’s.
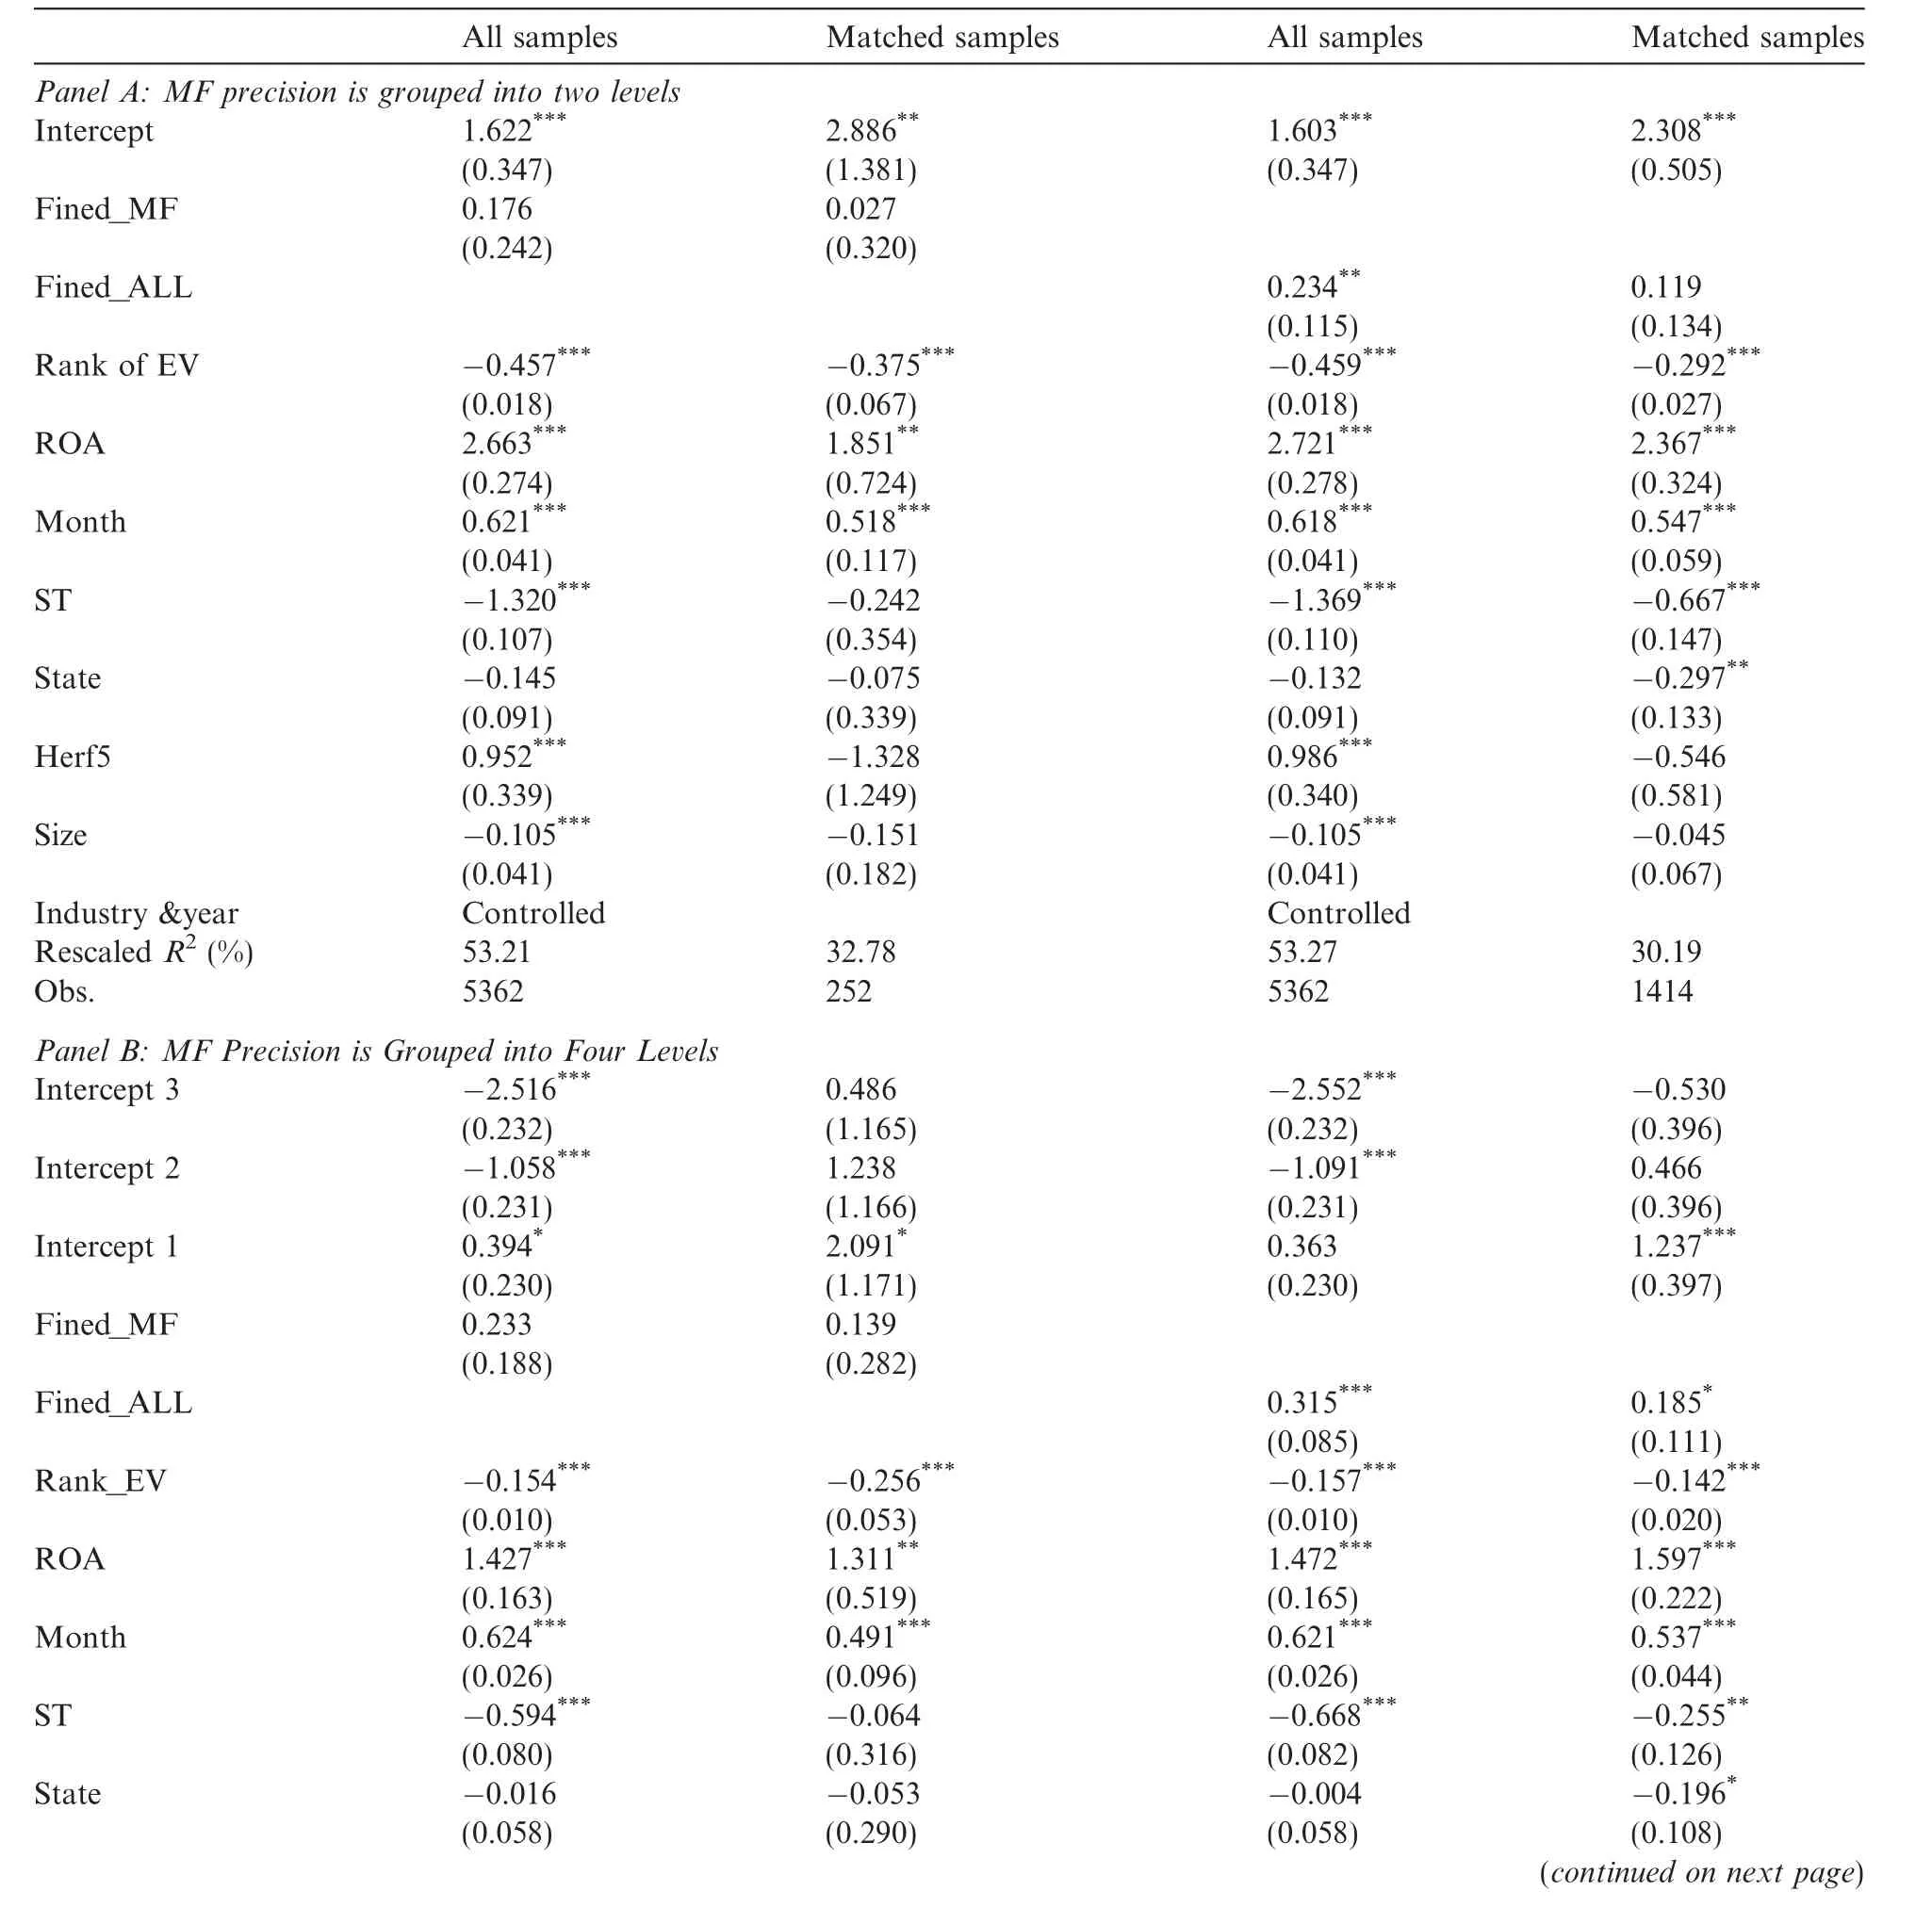
Table 10Effects of enforcement on MF precision from 2002 to 2009.

Table 10(continued)
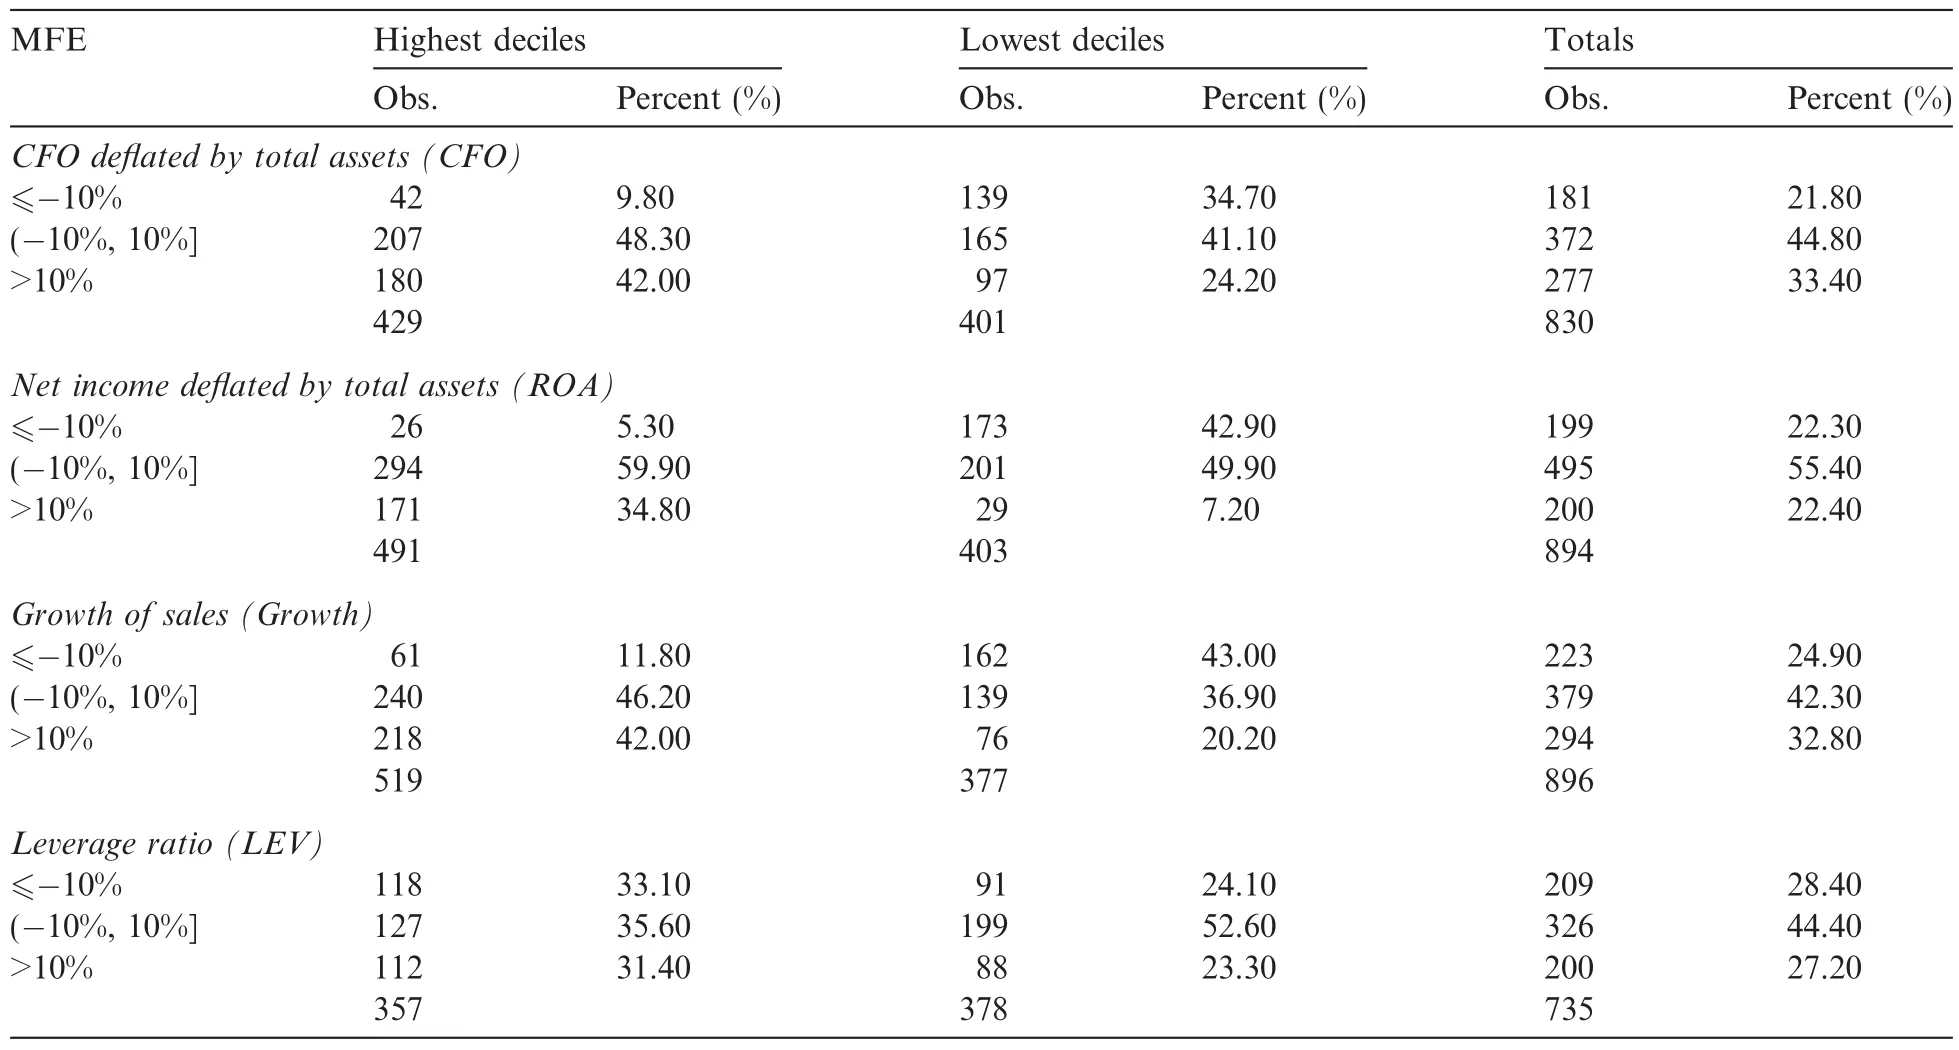
Table 11Errors of MFs for Observations with Extreme Values from 2002 to 2009.
Table 9 reports the precision of annual MFs issued by A-share firms from 2002 to 2009,and Fig.3 portrays the distribution of forecast precision.We can see that the precision of subsequent MFs issued by firms punished for irregular MFs are significantly lower than that of unpunished firms.The precision of subsequent MFs issued by firms punished for all irregularities is higher than that of unpunished firms.This difference might be the result of timing,with punishments for MF irregularities concentrated in 2001 and with subsequent MFs issued from 2002 to 2004,when the quality of all listed firms’MFs was improving.Therefore, it is necessary to control for other factors that influence MF quality.
Because the precision of MFs is an ordinal variable,we run the regressions with logit or ordered-logit.As the percentage of punished observations is relatively low,we also use a matched sample to avoid potential confusion introduced by different sample sizes.The regression results are reported in Table 10.
It is clear that after controlling for factors influencing MF precision,the estimated coefficient of Fined_MF is not significantly different from zero-indicating that the effects of such punishments are not as expected.The estimated coefficient of Fined_ALL is significantly positive,indicating that the effects of such punishments are somewhat significant.Comparing the results of Fined_MF and Fined_ALL,we argue that one explanation forthe difference might be that the degree of punishment for MF irregularities is relatively lighter,indicating an insufficiently strong deterrence effect.24Punishment for irregular management forecasts usually takes the form of public criticism,which is lighter than a public fine.For example,the influence of public criticism on the qualification of refinancing is only one year,while that of a public fine is three years. Moreover,Luo et al.(2005)find that the probability of being punished again is lower for firms that have received a public fine,suggesting that public fines offer the strongest deterrence.
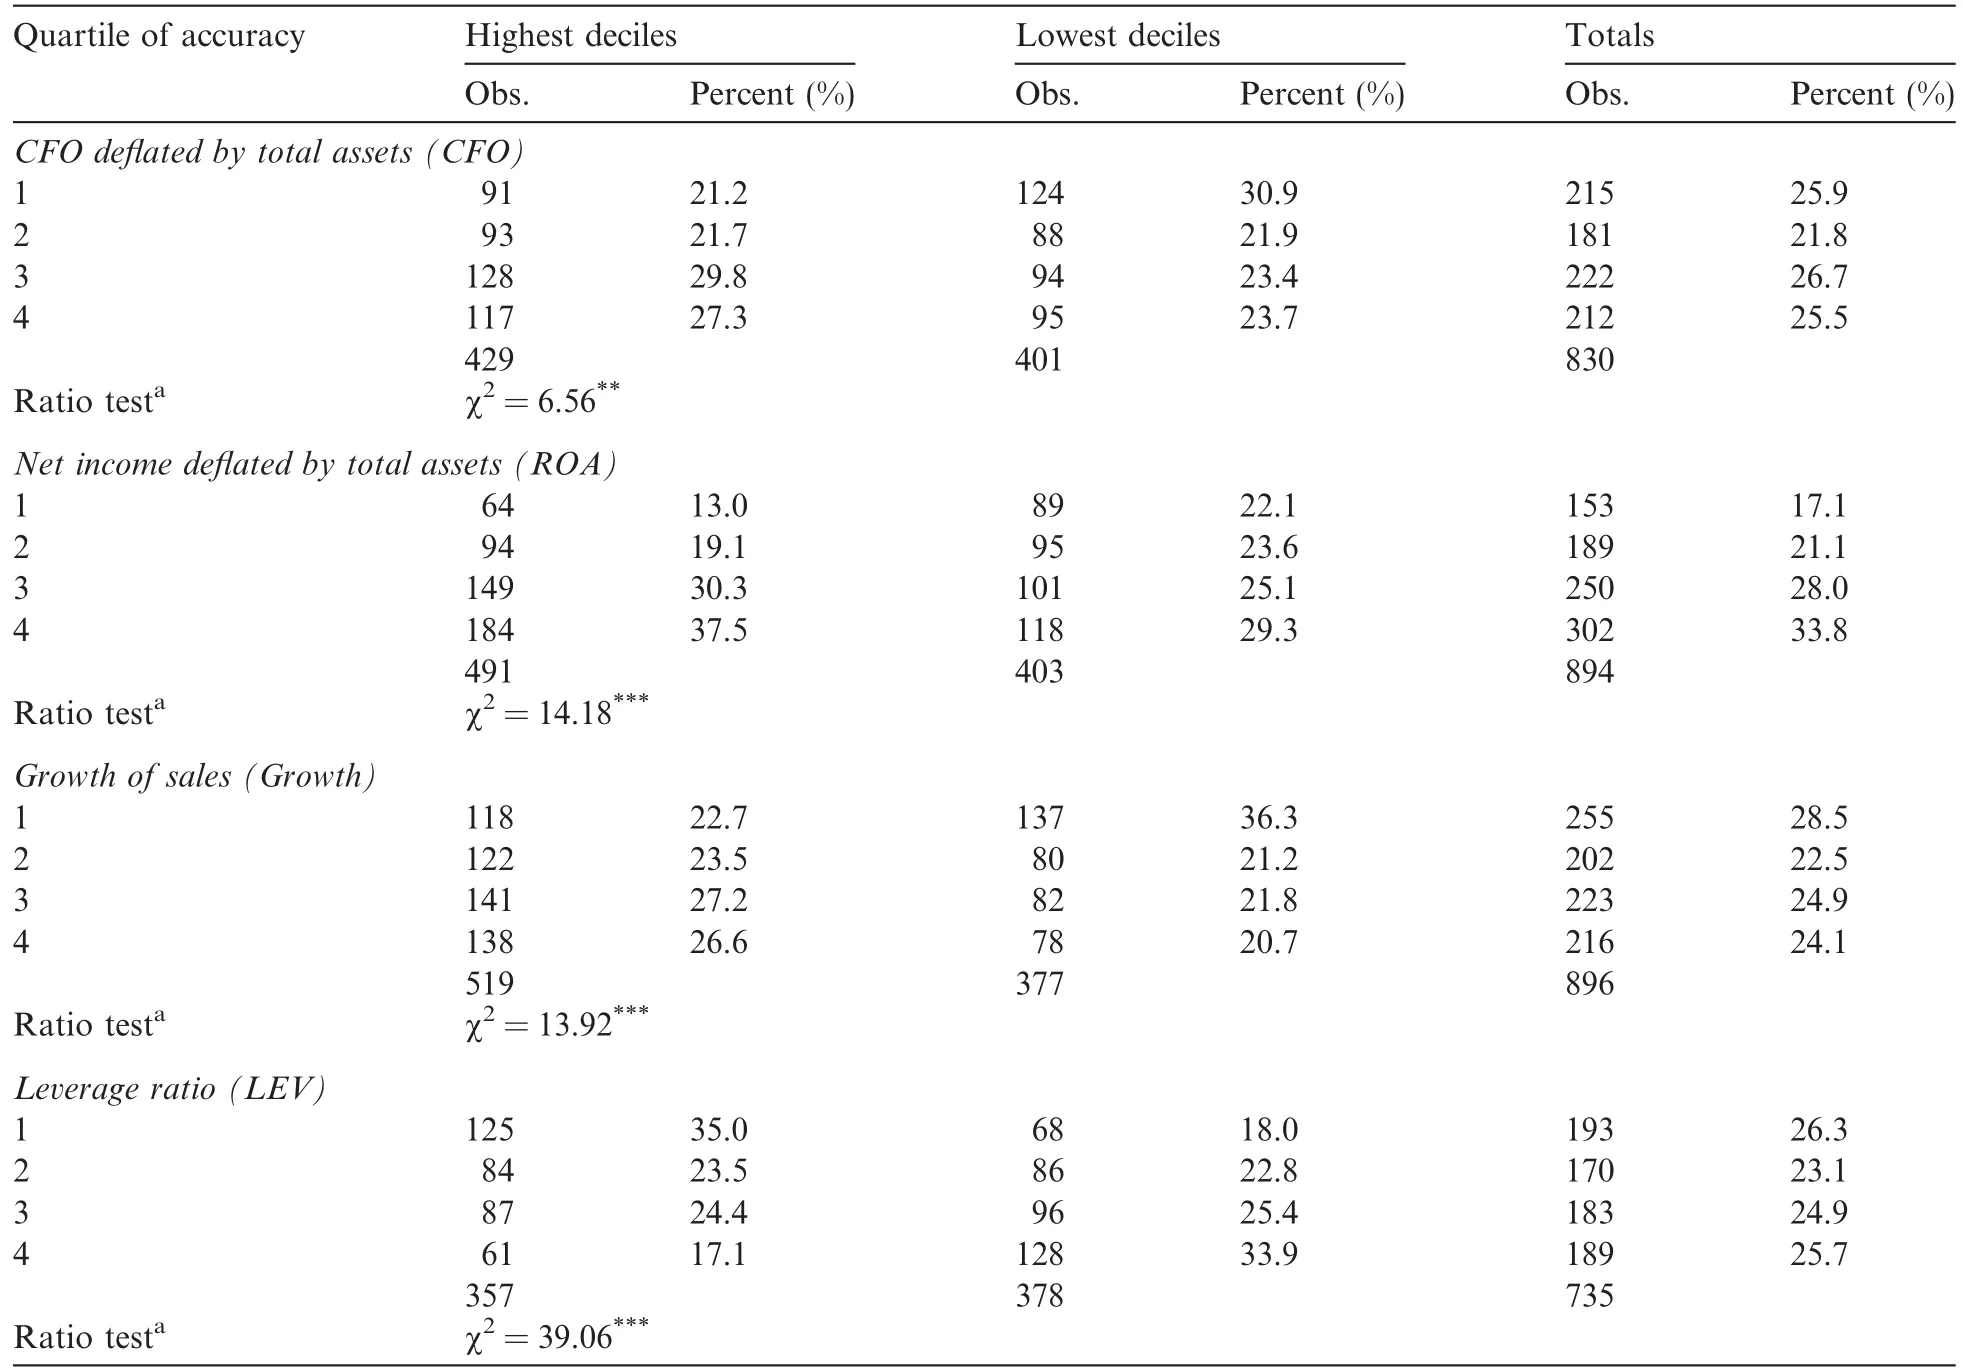
Table 12MF accuracy for observations with extreme values from 2002 to 2009.

Table 13Distribution of annual MF accuracy from 2002 to 2009.
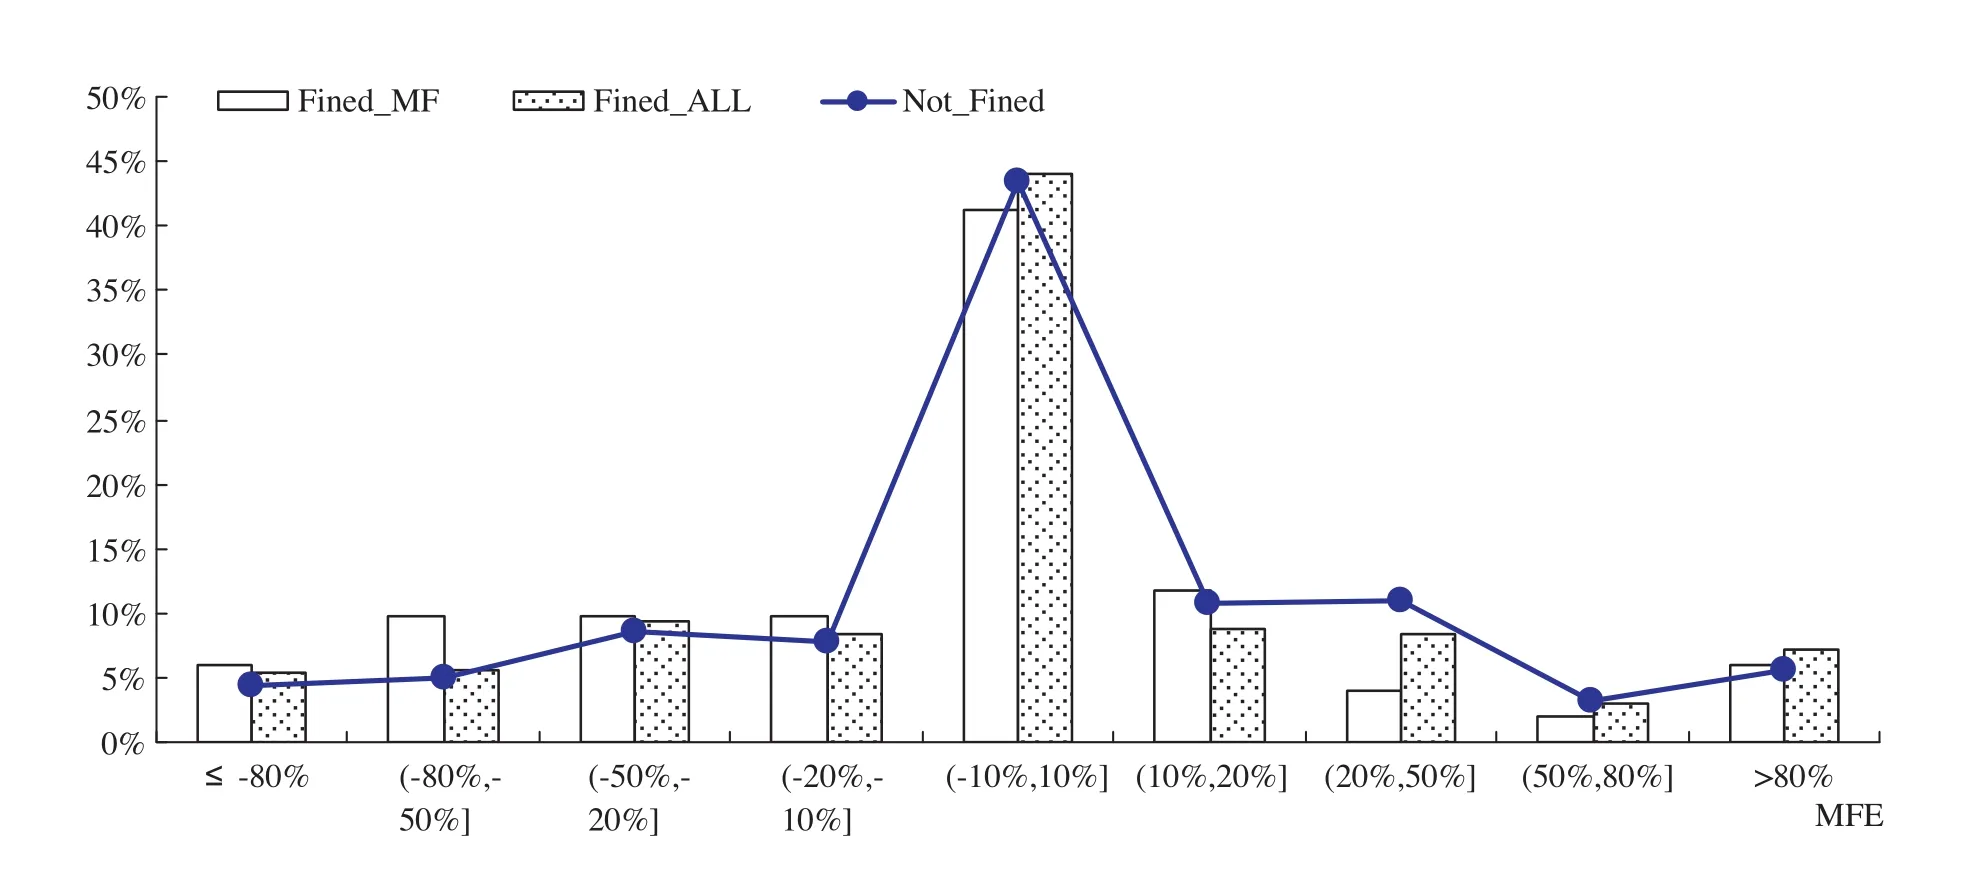
Fig.4.Distribution of forecast errors.Note:MFE=(NETactual-NETforecasted)/|NETforecasted|,where NETactualis actual net income and NETforecastedis the forecasted net income in the MF.“Not-Fined”are firms that were not punished during the previous three years.“Fined_MF”are firms that were punished for MF irregularities and“Fined_All”are firms that were punished for irregularities that did not necessarily include MF irregularities during the previous three years.
5.2.Effects of punishment on MF accuracy
We classify MFs into three groups:overestimated,accurate and underestimated.MFs predict activities and it is almost impossible to be 100%accurate.An accurate forecast is one for which forecasted earnings arewithin a 10%deviation from actual earnings.If the forecasted earnings deviate from the actual earnings by more than 10%,we classify the forecast as“overestimated”or“underestimated”,according to the sign of the difference between the forecast earnings and the actual earnings.Our previous results indicate that punishment for MF irregularities is rarely enforced on“good news”.The only times“good news”is punished is when the forecast is“overestimated”.In other words,overestimation is not welcomed by regulators,but does this preference impact the tendency of target firms to overestimate?The results in Table 11 indicate that it does not.
For example,the percentage of overestimation is 9.8%and 34.7%for observations in the highest deciles of CFO and those in the lowest deciles,respectively,with the latter three times higher than the former.In contrast,their corresponding percentage of underestimation is 42.0%and 24.2%,respectively,with the latter much lower than the former.
Accuracy is measured by the inverse of absolute MFE(MF error,see Table 12 for its definition).To avoid the influence of extreme values,we use the rank of Accuracy(from 9 for the highest deciles to 0 for the lowest deciles)in our regressions.To save space,the results reported in Table 12 are based on quintiles.
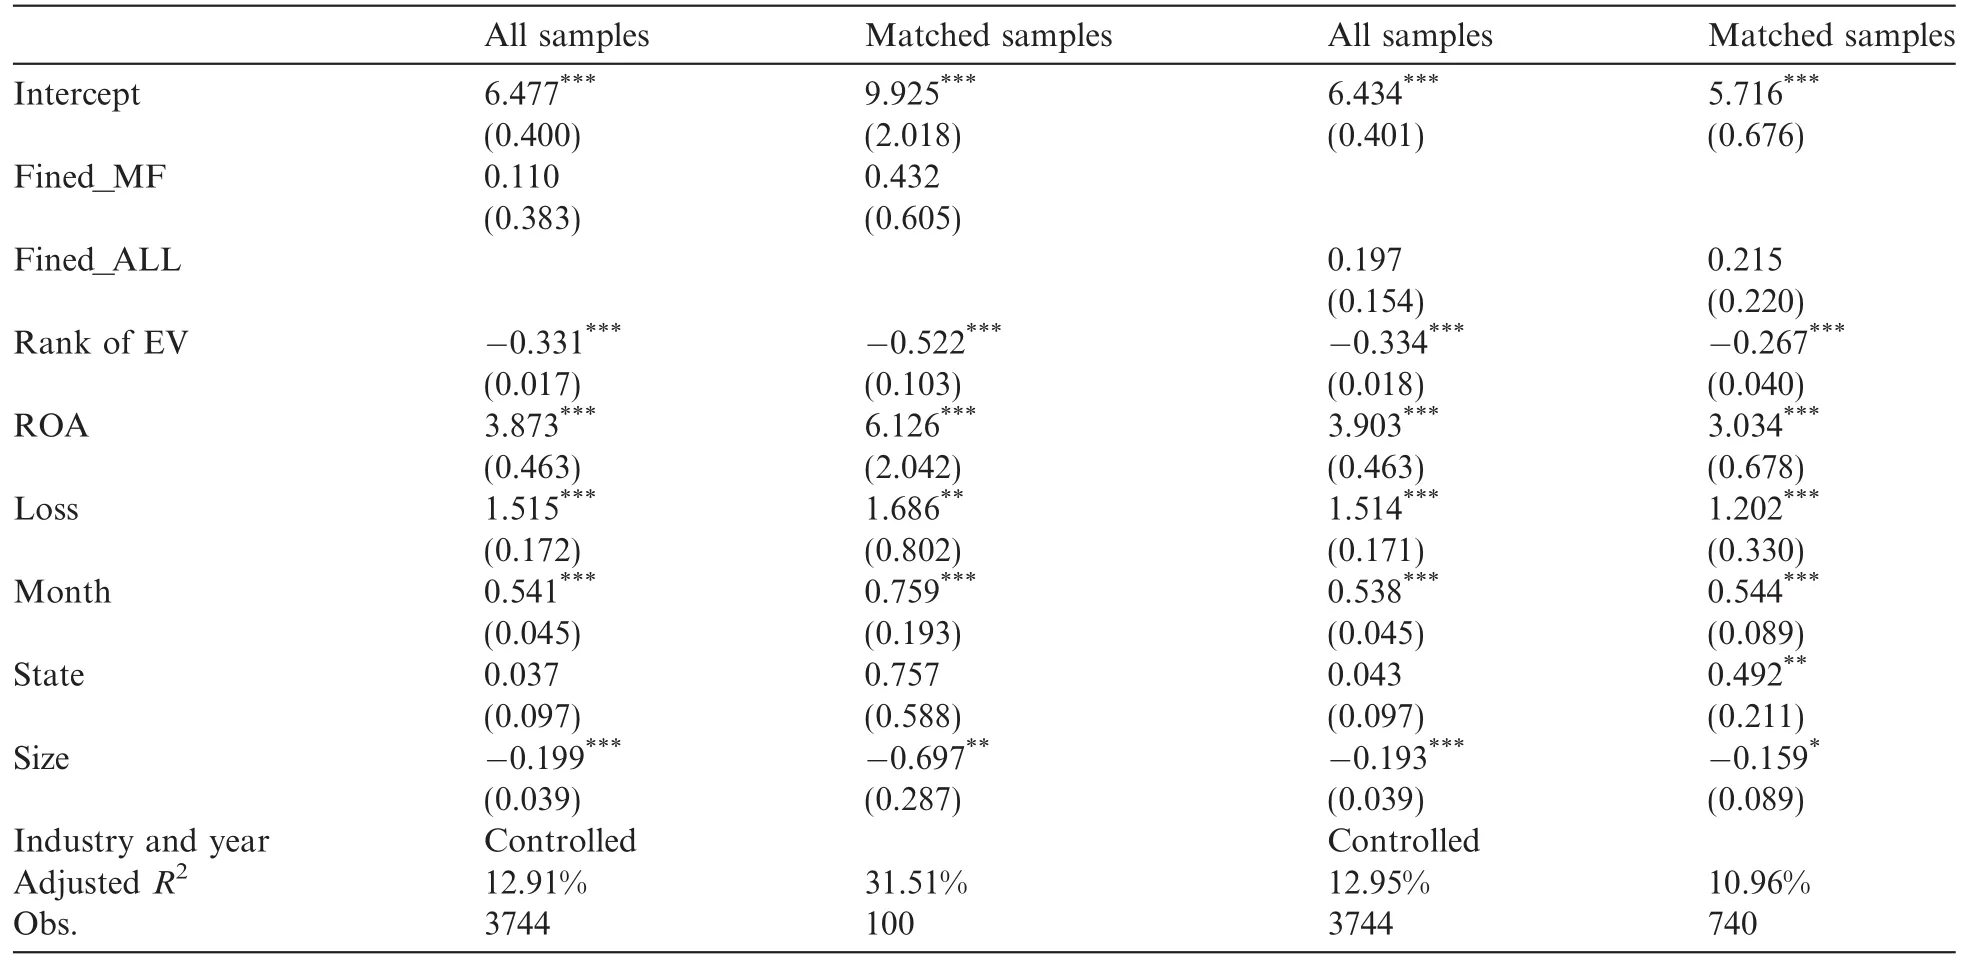
Table 14Effects of enforcement on the accuracy of annual MFs from 2002 to 2009.
We still find that punishment preferences do not provide a sufficiently strong deterrence.For example,the percentage of lowest accuracy is 30.9%for observations with CFO falling in the lowest deciles,which is higher than that of observations with CFO falling in the highest deciles(21.2%).In contrast,the percentage of highest accuracy is 23.7%and 27.3%for observations with CFO falling in the lowest and highest deciles,respectively. The χ2of the ratio test is 6.56,which is significant at the 5%level.
The accuracy of all MFs issued by A-share firms from 2002 to 2009 is reported in Table 13.Fig.4 portrays the distribution of forecast accuracy.The accuracy results are similar to those for forecast precision.That is,firms punished for MF irregularities still have lower accuracy in their subsequent forecasts than other firms, indicating no significant improvements.Meanwhile,the accuracy of subsequent MFs issued by firms punished for all irregularities is not significantly different from that of unpunished firms.
The regression results are reported in Table 14.After controlling for factors that in fl uence MF accuracy, the estimated coefficients for Fined_MF and Fined_ALL are all insignificantly different from zero,indicating that the punished firms did not improve their subsequent forecast accuracy to please regulators.
6.Conclusions
We use irregular MFs from 2000 to 2006 to examine whether the resulting enforcement actions are selective. Our results indicate that enforcement actions by securities regulators are selective.All things being equal,the probability of being punished for irregular MF is significantly related to proxies for survival rates.Specifically, fraud firms with a lower ROA or a higher risk of cash flows are more likely to be punished.
Most enforcement actions for MF irregularities occurred from 2000 to 2002.Therefore,we examine the effects of enforcement actions based on MF quality,in disclosures from 2002 to 2009.Our results indicate that the effects of enforcement actions fall far from expectations.First,the preference for selective enforcement has not proven a significant threat.The forecasting precision and accuracy of firms with a lower survival probability were still significantly lower than those with a higher survival probability.Second,enforcement actions did not significantly improve the precision and accuracy of subsequent forecasts issued by punished firms.
Acknowledgements
We appreciate the comments of seminar participants at the Symposium of the China Journal of Accounting Research.We are particularly indebted to Donghua Chen for his valuable comments and advice.We also thank the anonymous referees for their constructive comments.However,we are completely responsible for the content of this paper.Yunling Song thanks the National Natural Science Foundation of China(Project Number:71102084)for their financial support of this work.
Ajinkya,B.B.,Bhojraj,S.,Sengupta,P.,2005.The association between outside directors,institutional investors and the properties of management earnings forecasts.Journal of Accounting Research 43(3),343-376.
Baginski,S.P.,Hassell,J.M.,1997.Determinants of management forecast precision.The Accounting Review 72(2),303-312.
Baginski,S.P.,Hassell,J.M.,Kimbrough,M.D.,2008.Macro information environment change and the quality of management earnings forecasts.Review of Quantitive Financial Accounting 31,311-330.
Bai,X.,2009.The impacts of management earnings forecasts on analyst behavior.Research of Finance 4,92-112(in Chinese).
Beasley,M.S.,Carcello,J.V.,Hermanson,D.R.,1999.Fraudulent financial reporting:1987-1997.Committee of Sponsoring Organizations of the Treadway Commission,AICPA.
Beneish,D.,1999.Incentives and penalties related to earnings overstatements that violate GAAP.The Accounting Review 74(4),425-457.
Chen,G.M.,Firth,D.,Gao,N.,et al.,2005.Is China’s securities regulatory agency a toothless tiger?Evidence from enforcement actions. Journal of Accounting and Public Policy 24(6),451-488.
Chen,D.H.,Jiang,D.Q.,Liang,S.K.,Wang,F.P.,2011.Selective enforcement of regulation.China Journal of Accounting Research 4 (1-2),9-28.
Dechow,P.,Sloan,R.G.,Sweeney,A.,1996.Causes and consequences of earnings manipulation:An analysis of firms subject to enforcement actions by the SEC.Contemporary Accounting Research 13(1),1-36.
Eames,M.J.,Glover,S.M.,2003.Earnings predictability and the direction of analysts’earnings forecast errors.The Accounting Review 78(3),707-724.
Farber,D.B.,2005.Restoring trust after fraud:Does corporate governance matter?The Accounting Review 80(2),539-561.
Feroz,E.H.,Park,K.,Pastena,V.S.,1991.The financial and market effects of the SEC’s accounting and auditing enforcement releases. Journal of Accounting Research 29(Supplement),107-142.
Graham,J.,Harvey,C.R.,Rajgopal,S.,2005.The economic implications of corporate financial reporting.Journal of Accounting and Economics 40,3-73.
Johnson,M.,Kasznik,R.,Nelson,M.,2001.The impact of securities litigation reform on the disclosure of forward-looking information by high technology firms.Journal of Accounting Research 39(2),297-327.
Karamanou,I.,Vafeas,N.,2005.The association between corporate boards,audit committees,and management earnings forecasts:An empirical analysis.Journal of Accounting Research 43(3),453-486.
Kedia,S.,Rajgopal,S.,2011.Do the SEC’s enforcement preferences affect corporate misconduct?Journal of Accounting and Economics 51(2011),259-278.
King,R.,Pownall,G.,Waymire,G.,1990.Expectations adjustments via timely management forecasts:review,synthesis,and suggestions for future research.Journal of Accounting Literature 9,113-144.
Koch,A.,2002.Financial Distress and the Credibility of Management Earnings Forecasts.Working paper,Carnegie Mellon University.
Li,W.J.,2007.The economic consequence of government regulation on accounting information disclosure:empirical findings from Chinese security market.Accounting Research 8,13-22(in Chinese).
Liu,F.,2006.Research on the finance and accounting problems in capital market:case analysis.Chinese Fiscal Economics Press,Beijing (in Chinese).
Luo,M.,Song,Y.L.,2011.Are Management Forecasts in China Credible?Working Paper.Tsinghua University.
Luo,P.,Mao,L.,Yang,Q.,et al.,2005.Research on the efficacy and institutional costs of securities regulations<http://www.sse.com.cn/ cs/zhs/xxfw/research/plan/plan20061024h.pdf〉(in Chinese).
Pincus,K.,Holder,W.H.,Mock,T.J.,1988.Reducing the Incidence of Fraudulent Financial Reporting:The Role of the Securities and Exchange Commission.SEC Financial Reporting Institute of the University of California,Los Angeles,CA.
Wang,I.,2007.Private earnings guidance and its implications for disclosure regulation.The Accounting Review 82,1299-1332.
Wu,L.N.,Gao,Q.,2002.Research on the market reactions of enforcement actions.Science of Economics 3,62-73(in Chinese).
Xue,S.,2001.Signaling in loss forecasting.Proceedings of the International Symposium on Accounting and Finance in China 2001, 570-599(in Chinese).
28 April 2011
*Corresponding author.Tel./fax:+86 537 88206867.
E-mail address:syunling@163.com(Y.Song).
Enforcement actions
Management earnings forecasts Irregularities
Selection bias
 China Journal of Accounting Research2012年1期
- China Journal of Accounting Research的其它文章
- Overemployment,executive pay-for-performance sensitivity and economic consequences:Evidence from China
- Accounting standard changes and foreign analyst behavior: Evidence from China
- Controller changes and auditor changes
- Women on boards of directors and corporate philanthropic disaster response
