
YLuAG:Ce粉体的发光及闪烁特征:制备方法及缺陷效应
2011-12-11 09:09:56苏晓彬钟红梅潘裕柏
物理化学学报 2011年8期
张 孔 刘 茜 苏晓彬 钟红梅 石 云 潘裕柏
(1高性能陶瓷和超微结构国家重点实验室,中国科学院上海硅酸盐研究所,上海200050;2中国科学院研究生院,北京100049; 3中国科学院透明光功能无机材料重点实验室,中科院上海硅酸盐研究所,上海200050)
YLuAG:Ce粉体的发光及闪烁特征:制备方法及缺陷效应
张 孔1,2刘 茜1,*苏晓彬1,2钟红梅1石 云3潘裕柏3
(1高性能陶瓷和超微结构国家重点实验室,中国科学院上海硅酸盐研究所,上海200050;2中国科学院研究生院,北京100049;3中国科学院透明光功能无机材料重点实验室,中科院上海硅酸盐研究所,上海200050)
采用硝酸盐热解法(NP)、碳酸氢铵共沉淀法(CP)以及柠檬酸盐燃烧法(CC)分别制备了YLuAG:Ce (Y0.600Lu2.364Al5O12:Ce0.036)荧光粉体.通过傅里叶变换红外光谱(FTIR),X射线衍射(XRD),透射电子显微镜(TEM),光致发光(PL)及热释光(TL)等表征手段研究了不同方法制备粉体的反应结晶过程、晶粒形貌、激发发射光谱、闪烁性能等.对比研究表明,三种方法制备的YLuAG:Ce粉体其表面及体相缺陷数量及分布存在差异,从而导致了发射光谱峰位的偏移和快慢衰减时间分量的比例变化.粉体的热释光谱分析结果进一步显示:不同粉体热释光谱的主发射峰峰位及强度明显不同,从侧面说明了合成方法诱发了粉体内的缺陷,而粉体内具有不同陷阱深度的缺陷数量及陷阱复合几率对材料发光性能有较大影响.
YLuAG:Ce荧光粉;合成;发光;衰减时间;缺陷
1 Introduction
Scintillating materials play an important role in detecting high energy photons and particles,which can be used in medical imaging,gamma cameras,and tomography,particularly for positron emission tomography(PET)and computerized tomography scanners(CT).1,2During the last decade,most scintillating materials investigated or in application are Ce3+doped YAG (Y3Al5O12)or LuAG(Lu3Al5O12)single crystals for their fast response and high light yield.But YAG:Ce is deficient in stopping power of gamma ray due to its low density and low effective atomic number.And the reservation concerning of LuAG: Ce is that the starting Lu2O3powders with high purity are very expensive from an industrial point of view,although LuAG:Ce has a higher stopping power.3Therefore,the material with Y partly replaced by Lu,that is YLuAG:Ce,is adopted naturally as alternatives for the complement each other.4
Considering the larger-scale production,the growth of large-sized crystals is not only difficult but also expensive.5Furthermore,the single crystals have an intense intrinsic luminescence in UV spectral range due to the anti-site defects, which is unwanted actually because they are the competing channels of energy transfer processes.6As an alternative,polycrystalline optical ceramics with high density and transparency can be used as candidates for its relatively simple processing techniques.7-9So the luminescence and scintillation characteristics of the starting powders for ceramic preparation of YLuAG: Ce are important factors for the performance of ceramic scintillators.
In the present work,we report the synthesis of one composition of YLuAG:Ce,Y0.600Lu2.364Al5O12:Ce0.036,which is one of the optimum compositions based on our previous research using combinatorial screening method.10The phosphors with the optimal composition were prepared by three different methods to select the best route for ceramic scintillator preparation.The three methods were nitrate-pyrolysis(NP),co-precipitation (CP)with ammonium hydrogen carbonate,and citrate-combustion(CC).The phase evolution,reaction process,and morphology of the prepared powders were characterized by thermogravimetric and differential thermal analyses(TG/DTA),FTIR, and TEM,respectively.And also the influence of the powder characters on luminescent and scintillation properties was revealed by comparing with the excited/emission spectra,decay time,and thermoluminescence(TL)glow curves.
2 Experimental
2.1 Raw materials
The starting materials used here were rare earth oxides and nitrates,Y2O3,Lu2O3(all purity≥99.99%,Yuelong nonferrous metal corporation of Shanghai),Ce(NO3)3·6H2O(AR),and Al(NO3)3·9H2O(AR).In the following synthesis process,Al3+and Ce3+solutions were prepared by dissolving Al(NO3)3·9H2O and Ce(NO3)3·6H2O in deionized water.Y2O3and Lu2O3were dissolved in nitric acid to form Y(NO3)3·6H2O and Lu(NO3)3· 6H2O,and evaporated to remove the extra HNO3.The solutions of all the cations were mixed according to the optimal stoichiometric proportion of Y0.600Lu2.364Al5O12:Ce0.036(YLuAG:Ce in abbreviation in the following sections)and the total cation concentration was 0.3 mol·L-1.
2.2 Powder synthesis
2.2.1 Synthesis of YLuAG:Ce by nitrate-pyrolysis(NP)
The prepared solution mentioned above was condensed under magnetic stirring at 100°C(in oil bath)for 4 h.Then the sticky liquid was redissolved in ethyl alcohol which is favorable to the dispersibility of powders.After dried at 80°C over 12 h,the obtained precursors were preheated at 600°C for 4 h in air.By an intermediate grinding,for a further uniform mixing,the powders were additionally calcined at 800-1300°C for 2 h in CO atmosphere,produced by the incomplete combustion of activated carbon to avoid Ce3+from oxidation.
2.2.2 Synthesis of YLuAG:Ce by co-precipitation(CP)
The precipitator was prepared by dissolving ammonium hydrogen carbonate in deionized water(2 mol·L-1).Precursors were produced by dropping 100 mL of the prepared multi-cation mixture solution of nitrates into 150 mL of the precipitant solution of NH4HCO3at a speed of 2 mL·min-1,under magnetic stirring at room temperature.After aging at 50°C for 4 h,the resultant suspension was filtered and washed with distilled water and ethyl alcohol for three times.After dried at 120°C for 8 h,the powder was then calcined at 800-1300°C for 2 h in CO atmosphere,also produced by the incomplete combustion of activated carbon.An additional sample of LuAG:Ce(Lu2.964Al5O12: Ce0.036)was also synthesized by co-precipitation(CP)to compare with the prepared YLuAG:Ce.
2.2.3 Synthesis of YLuAG:Ce by citrate-combustion (CC)
The prepared multi-cation mixture solution(100 mL)was added to a mixture solution containing 8 g citric acid in 100 mL ethyl alcohol with a continuously stirring using a magnetic agitator at 80°C for 4 h,till the solution turned to a yellowish and sticky gel.After heated at 120°C for 2 h,the precursors were put into a muffle furnace at 500°C and then an auto-combustion process took place.The resultant powders were milled in an agate mortar subsequently and then calcined at 800-1300°C for 2 h in CO atmosphere.
2.3 Powder characterization
Fourier transform infrared spectra(FTIR)of the powders were recorded at room temperature using a FTS-185 FTIR Spectrometer(Bio-Rad,USA).Phase identification of the calcined powders at different temperature was characterized by using powder X-ray diffraction(XRD),collected by a D/MAX-2550V X-ray diffractometer(Rigaku,Japan.)using Cu Kαradi-ation at 40 kV and 100 mA.The morphology and the specific surface of the resultant powders were examined using a field scanning electronic microscope(FSEM,Model JSM-6700F, JEOL,Japan)and BET analyzer(COULTER SA3100,Beckman Coulter,USA).The excitation and emission spectra of the powders were measured using a Hitachi fluorescence spectrophotometer(F-4600,Hitachi,Japan),and the decay time was recorded on a FLS920 spectrofluorimeter(Edinburgh Instruments Ltd,England).The TL measurements were performed on a model F427J-thermal spectrometer(Beijing Xihuayi Technology Co.Ltd,China)in the range of 30-400°C with a heating rate of 2°C·s-1.The samples for TL measurement,with a diameter of about 5 mm(~45 mg),were exposed to UV-irradiation using a 500 W high-pressure mercury lamp(λex=365 nm) and kept in a black box for 12 h after irradiation.
3 Results and discussion
In order to determine the crystallization process,the TG/ DTA curves were measured as shown in Fig.1.For the precursors synthesized by NP method,the TG curve indicates that most of the mass loss takes place below 600°C and shows an overall mass loss of 60%approximately(Fig.1(a)).The mass loss can be attributed to the removal of molecular water,organic material,and the partial decomposition of nitrates.Exhaustively,the endothermic peaks of DTA curve centered at 125.8 and 205°C are attributed to the removal of free water and adsorptive water,respectively.The decomposition of nitrate is corresponding to the endothermic peaks at 285.0 and 392.9°C. The exothermic peaks at about 314.2 and 939.1°C result from the removal of remnants ethyl alcohol and crystallization of YLuAG,respectively.As a result,it can be confirmed that the crystallization of the precursor occurs at about 900-950°C.
TG/DTA traces of the precursors produced by co-precipitation(CP)are given in Fig.1(b).The TG curve shows that the complete decomposition of the precursors needs a temperature exceeding 1000°C with a total mass loss of 46.3%.The broad endothermic peak at about 125.8°C is due to the removal of water.The durative mass loss from 400°C is caused by the decomposition of the hydroxyl and bicarbonate in the precursors. The exothermic peak at 927.5°C is attributed to the crystallization of the garnet phase.And the endothermic peak at 987.0°C comes from the decomposition of carbonate that was brought in the process of precipitation and bicarbonate decomposition.
For the precursors synthesized by CC method,almost all mass loss occurs below 600°C as its TG curve shown,with a total mass loss of 77%(Fig.1(c)).The endothermic peaks around 102.3 and 220.9°C may be caused by the loss of the water and the decomposition of nitrate.The broad exothermic peak around 503.9°C corresponds to the combustion of citrate of three cations.The exothermic peak at 920.0°C is attributed to the crystallization of the garnet phase.

Fig.1 TG(solid line)/DTA(dash line)curves of the precursors synthesized by three methods(a)NP,(b)CP,(c)CC;The exothermic(Exo as abbreviation)peak in the curves are downward as the arrows shown.
Based on the TG/DTA analysis,the crystallization process evaluation of the powder precursor was carried out.Fig.2 shows the XRD patterns of the powders by three preparation methods,calcined at 800-1300°C for 2 h.The powders produced by NP are found to be lightly crystallized at 800°C (Fig.2(a)).For the powders produced by CP(Fig.2(b)),the garnet phase is formed at 800°C,which means that the powders from CP have the lowest temperature of crystallization.And the resultant powders prepared by CC(Fig.2(c))do not have any obvious diffraction peaks below a calcination temperature of 800°C.At 1000°C,the garnet phase appears in all powders from three methods.At 1300°C,refinement of diffraction lines shapes and intensities increasing are observed,indicating the crystallite growth of the powders as temperature increasing. The crystal face index of the YLuAG:Ce structure is also indicated as shown in Fig.2(c).Compared with the standard XRD patterns of YAG(JCPDS card#72-1853)and LuAG(JCPDS card#73-1368),there are no obvious other phases present in the patterns shown in Fig.2 except the garnet phase.It is found that all the three methods we adopted to synthesize the phosphors can produce powders with a nearly pure garnet phase below 1000°C,which is lower than that employed in solid state reaction method.11

Fig.2 XRD patterns of the three kinds of powders calcined at 800, 1000,and 1300°C for 2 h(a)NP,(b)CP,(c)CC
FTIR analysis of the synthesized samples is very important for study on the reaction process and properties of YLuAG:Ce phosphors.Fig.3(a,b)show the FTIR spectra of YLuAG:Ce phosphors produced by different methods,calcined at 900 and 1200°C,respectively.The spectra of the phosphors calcined at 900°C(Fig.3(a))show two broad absorption bands around 3428.8 and 1627.6 cm-1,respectively,which are the characteristic vibration of hydroxyl groups,12due to the absorption of H2O from atmosphere.And another band around 1384.6 cm-1was assigned to C=O vibration which is also from atmosphere. The band about 1049 cm-1represents―NO3groups stretching modes.13There is also an absorb band in the curve of sample CP-900°C around 1076 cm-1as shown in Fig.3(a),which may be attributed to the vibration of the precursors that decomposited incompletely.But from the Fig.3(b),it can be clearly seen that the shape of IR spectra from three kinds of powders calcined at a higher temperature of 1200°C,has no obvious difference in the whole range from 400 to 1000 cm-1except intensity.There are two absorption bands at 655.7 and 794.8 cm-1, which correspond to the vibration of Al―O bonds partially in the octahedral and partly in the tetrahedral form.And the band at 435.8 cm-1can be assigned to Ce―O vibration.The bands at about 732.9,570.8,and 475.2 cm-1represent the characteris-tics of Y―O vibration in the garnet structure,while the bands at about 702,513,and 459 cm-1represent the characteristics of Lu―O vibrations in the garnet structure.14,15However,FTIR spectra give some strong evidence for the formation of stable garnet phase in a view of chemical bonds among the atoms, which is consistent with the above results of XRD(Fig.2).

Fig.3 FTIR spectra of the three kinds of powderscalcined at(a)900°C and(b)1200°C;The refined FTIR spectra in the range of 400-1000 cm-1for the powders calcined at 1200°C(c).
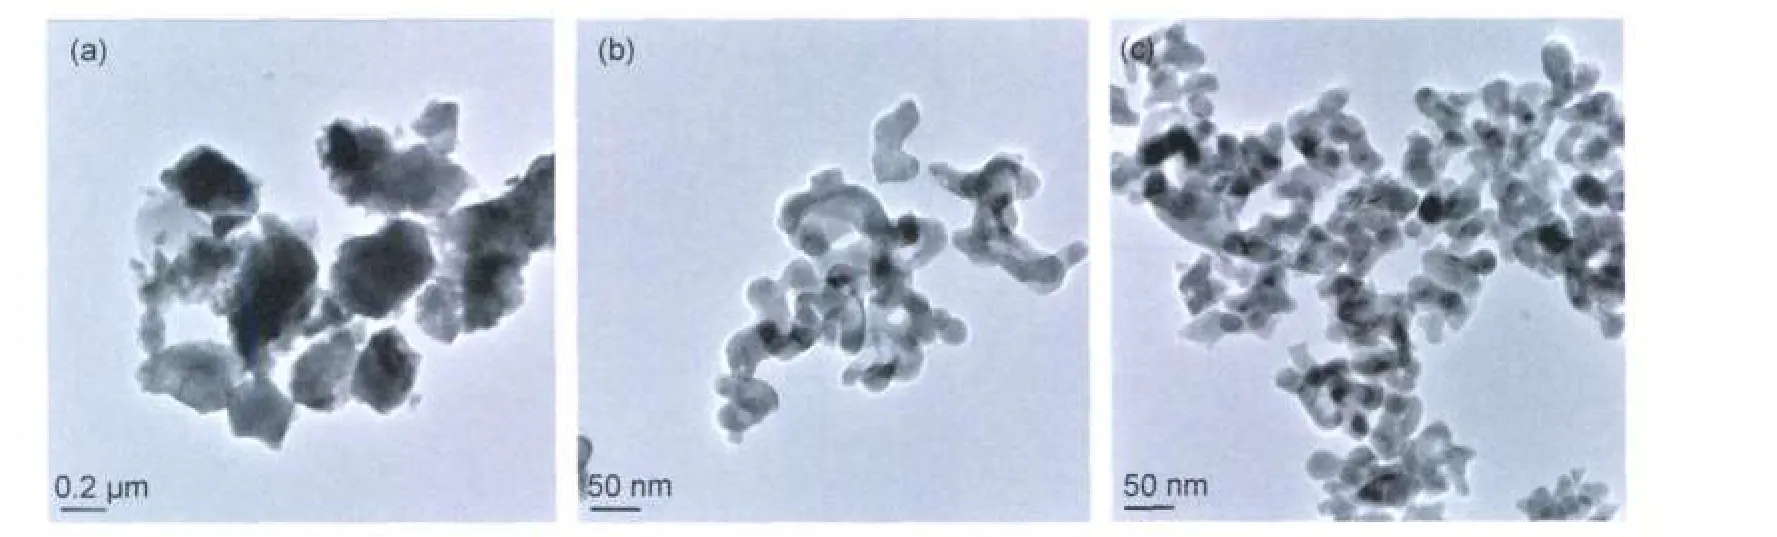
Fig.4 TEM morphologies of the three kinds of powders calcined at 1200°C(a)NP,(b)CP,(c)CC
Fig.4 shows the TEM micrographs of the powders calcined at 1200°C.It can be seen that the particle size is about 0.2 μm for the phosphors from NP method.The powders from CC and CP method are both uniform in size with an average particle size below 50 nm.To confirm the agglomerate degree of each phosphor,the specific surface was measured as listed in Table 1.It can be noticed that the phosphor from NP shows the most grievous agglomerate with a specific surface of about 8.5 m2· g-1.And the median particle diameters of powders from CCand CP methods are 24.37 and 35.24 nm,respectively.
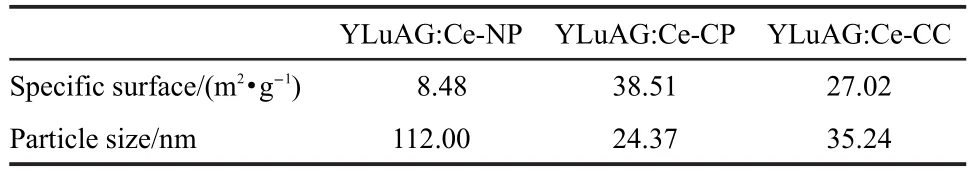
Table 1 Specific surface and particle size of three kinds of powders
The photoluminescent spectra of YLuAG:Ce phosphors were measured at room temperature as shown in Fig.5.The two excitation bands,namely a weak band with a maximum at 345 nm and a strong broad band with a maximum at 449 nm, are due to the electron transition from 4f ground state(2F5/2,2F7/2) of Ce3+to the different crystal field splitting components of the excited state 5d.16-18The emission spectra(dash line)under an excitation of 448 nm,consist of a broad band covering from 470 to 650 nm with a maximum at about 520 nm.With the in-crease of calcination temperature,the intensity of both excitation and emission of the powders increases as shown in Fig.5 (a-c).It is obvious that the intensity increase results from not only the enhancement of crystallization degree but also the decrease of the surface defects of the phosphors.It is also found that the maximum excitation wavelength has hardly been influenced by the three powders from different preparation methods and calcination temperatures.But for the emission spectra of the three kinds of powders calcined at 1300°C,the maximum emission wavelength is shifted to some extent(Fig.5(d)).An evident blue shift of emission band of Ce3+can be noticed in Fig.5(d)for the powders by CP(516.8 nm with full width at half maximum FHWM of 83.2 nm)and CC(514.8 nm with FHWM of 85.3 nm)methods,when contrasting with the emission band of phosphors by NP(523.6 nm with FHWM of 85.6 nm).It has been reported by other authors that the particle size reducing usually results in a blue shift of the emission spectra related to the increased surface defects.19Based on the analysis of particle size(Fig.4),the primary size of phosphors synthesized by CP or CC method is at a nanometer level,and the particle dispersing is better than the powders from NP route.It has been also found that the phosphors prepared by CP route have the maximum emission intensity and the phosphors from CC way have the lowest emission intensity.This phenomenon is mainly attributed to the big difference in crystallization degree of three kinds of phosphors according to XRD results(Fig.2). The phosphors from CP method have the lowest crystallization temperature,so it has the maximum crystallization degree at 1300°C,and then the highest emission intensity is obtained. Compared with LuAG:Ce powders(Fig.5(d)),it is clearly that the sample from the same synthesized route shows better photoluminescence performance which is attribute to the Y3+in the crystal lattice.And the emission peak position of all the three YLuAG samples have a apparent shift to the long wavelength when comparing with the LuAG:Ce phosphors(508.6 nm with FHWM of 83.8 nm).This distinct band shift comes from the distortion of lattice in the YLuAG samples,which influences the crystalline field around the Ce3+energy level.The change of the crystalline field causes the 5d energy level split more seriously and the lowest energy of 5d shifts to the 4f ground level.Therefore,the emission band shifts to long-wave band.

Fig.5 Excitation(solid line,λem=540 nm)and emission(dash line,λex=448 nm)spectra of powders by three methods(a)NP,(b)CP,(c)CC, calcined at 900°C(black line),1000°C(red line),1200°C(green line),1300°C(blue line),and(d)the powders by three methods (1300°C)compared with the LuAG(Lu2.964Al5O12:Ce0.036)phosphors from CPmethod(1300°C)
Scintillation decay curves of all phosphors from different preparation methods were measured and are shown in Fig.6. Fig.6 reveals that all decay curves can be approximated by two-exponent with a slow component τ1and a fast component τ2.And the decay time constants and their proportions are summarized in Table 2.It has been reported by other researchers that the long decay time(slow component)indicates the fluorescence decay of Ce3+in the bulk phase and the short decay time(fast component)expresses the photoluminescence decay of Ce3+on the surface of the powders.20,21It can be seen that the slow component values of three phosphors are in a wider range of 50-80 ns as listed in Table 2,which are in agreement with the decay time of YAG:Ce single crystal reported by Pankvatovʹs group.6The phenomenon gives a hint that the Ce3+ions being responsible for the slow component in the YLuAG:Ce phosphors may occupy the same positions in the crystal structure as the Ce3+in the single crystals.5From Table 2 we can also notice that the slow component of phosphors from CP method is the longest,but the one from CC powders is the shortest. The reason is that the slow component is mostly related with the defects in bulk phase,which may increase the probability of nonradioactive transition.And the powders from CC route have more defects in the bulk phase for its fast combustion dur-ing the process of crystallization,so it has the shortest slow component among the three samples.

Fig.6 Scintillation decay curves(room temperature)of the emission(λex=448 nm)from three kinds of YLuAG:Ce phosphors(a)NP,(b)CP,(c)CC
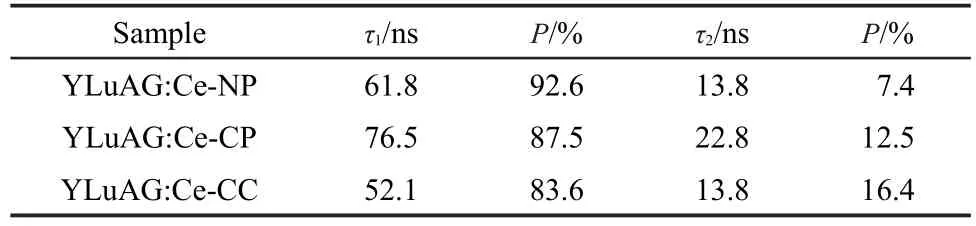
Table 2 Decay time(τ)and intensity proportion(P)by two-exponential fitting of the scintillation decay curves
Since the fast and slow components both come from the decay of Ce3+at different positions,surface or bulk,the proportion of each component is greatly related to the distribution of Ce3+in the particles.It has been clear that the contribution of the slow decay component exceeds 80%in all three powder samples,which reflects a truth that the Ce3+content in the bulk phase is much higher than that on the surface.However,the proportion of fast component is also different as-expected due to the varied ratio of bulk phase to surface.From Fig.4 and Table 1,we have known that the mean particle size of phosphors from NP route is larger than the values of the other two.The larger particle size definitely results in a minimum proportion of fast component and the largest proportion of slow component,awing to a lower surface contribution.
Fig.7 shows the thermoluminescence(TL)glow curve of three kinds of phosphors after exposure to UV-irradiation within a temperature range of 300-680 K.The experimental results can fit well with a set of Gaussian curves,giving a strong support to the existence of traps with different depths in the crystalline structure.Considering a second order kinetic TL process in YLAG:Ce,the depth of traps can be calculated by the following equation:22

where Etis the activation energy,k is the Boltzmann constant, Tmis the temperature peak and w is the full width at half maximum of TL peak.The calculated activation energy values of each TL peak for three different phosphors are listed in Table 3.It can be found that the glow peaks of three kinds of phosphors are different distinctly.And the main glow peak of three kinds of phosphors centered at 472 K(NP),579 K(CP)and 583 K(CC),respectively.These results suggest that the difference of the activation energy is a consequence of the modification of the lattice constant and imperfections of the crystalline structure created by the different synthesized methods.It is notable that the main glow peak of NP sample centered at 472 K. The traps corresponding to this peak may come from the Y or Ce atom deviating lattice point.23,24And this deviation is most probably from the incomplete formation of phase of the phosphors from NP calcined at 1200°C.Compared with other two phosphors from CP and CC,it is clearly that the crystallized temperature of NP phosphors is much higher.And when the three phosphors calcined at the same temperature(1200°C), the degree of crystallization of NP phosphor is lower than other two samples,so the concentration of the traps responding to the deviation is much higher,and the intensity of TL peak is much stronger at 472 K than other two phosphors.The detailed research about traps will be studied in our following work and discussed in another paper.The peak at around 580 K is most likely related to the defects in the form of dislocation and phase segregation that existed on the surface and in the bulk. Considering the phosphors synthesized by CP and CC having much more special area than the NP sample,it is reasonable that the main glow peak of the two samples(CP and CC)appears at around 580 K.Moreover,the intensity of TL peak of the sample CC at this position is stronger than that of the sample CP,which reflects again that in the powders by CC there are a lot of dislocations developed in the fast combustion process.The TL glow peak at around 620 K(Fig.7)reveals that there is a deep trap with an activation energy exceeding 2 eV, which is coincident with other report.25And the oxygen vacancies in the powders rose from the reducing mixture gas(Ar/H2) within calcinating processing are the most probable contributors to the peak at about 620 K.Another glow peak at 645 K in all three phosphors were not evaluated because they are out of the equipment range.All these results confirm that the variation of the peak position and intensity of TL curves are final expressions of the trap depth in the crystalline structure of the three kinds of phosphors,produced by the different synthesized process.
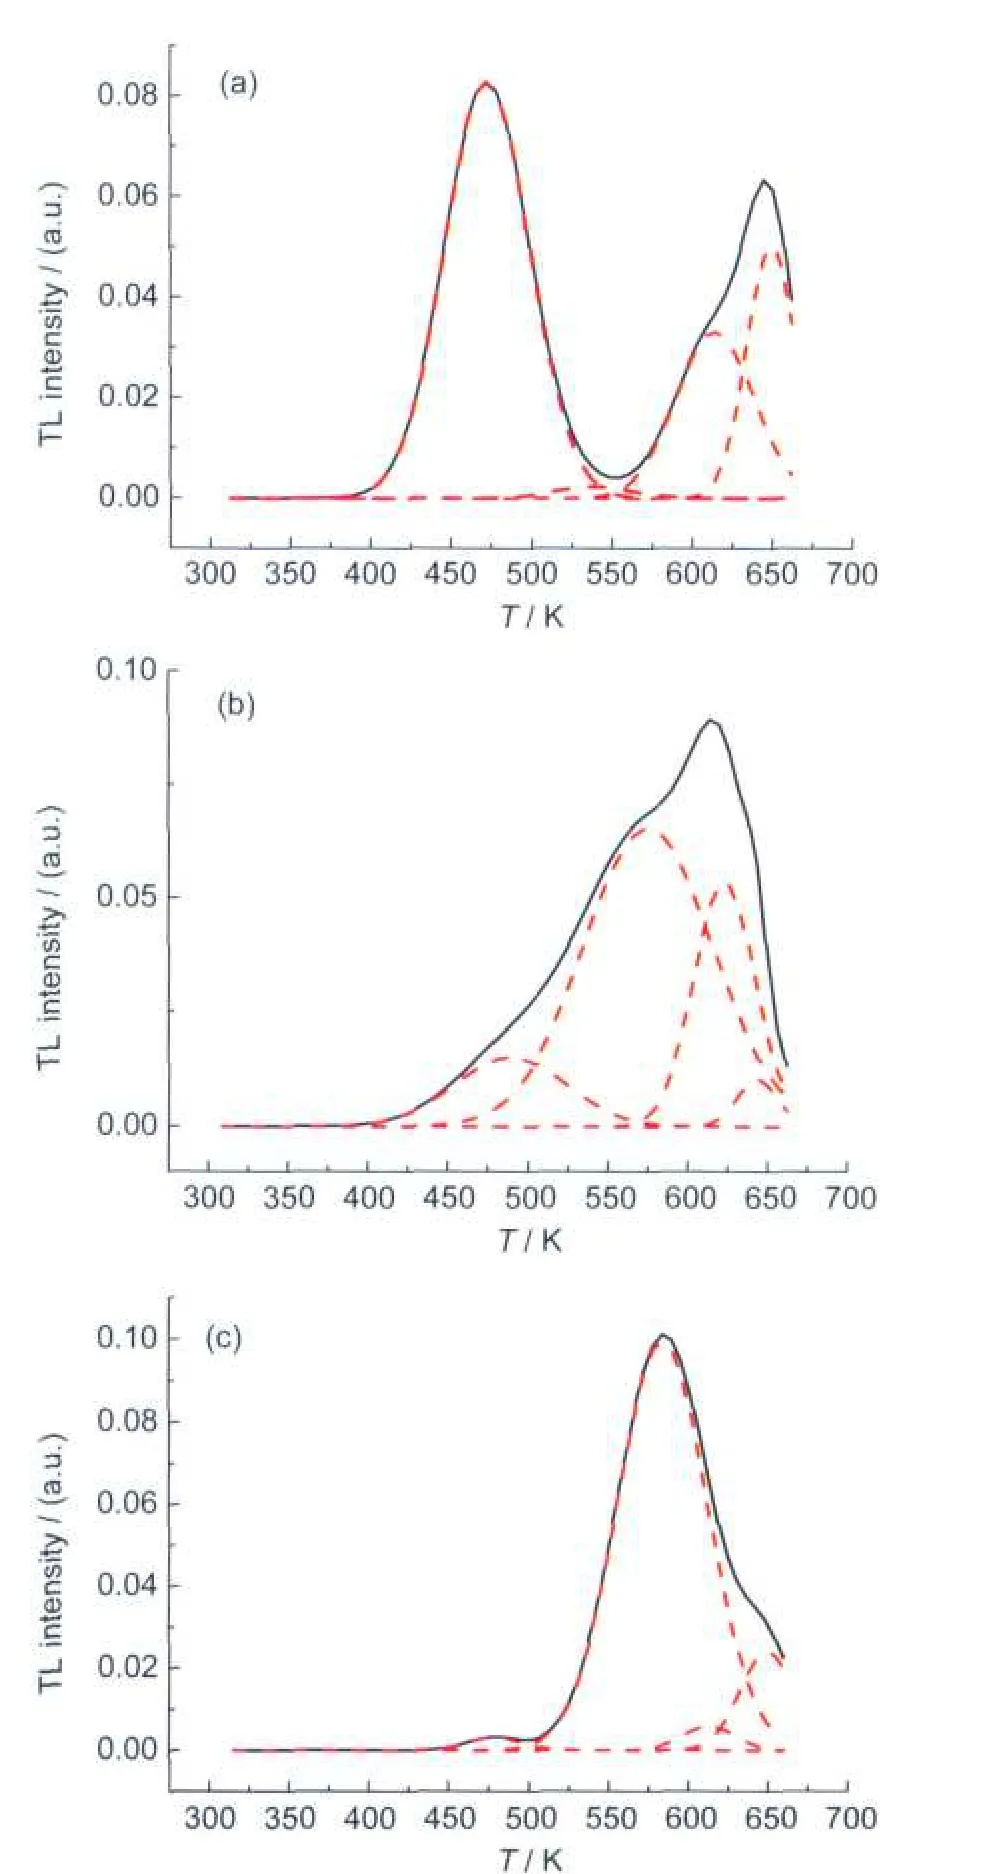
Fig.7 TLglow curve of three kinds of YLuAG:Ce phosphors synthesized by three methods(a)NP,(b)CP,(c)CC;The dash line was obtained by the Gaussian fitting of the experimental data(solid line).

Table 3 Peak position(Tm)and activation energy(Et)of each thermoluminescence(TL)peak for three kinds of powders
Since these phosphors will be used in the preparation of ceramic scintillator,the defects from the surface of particles can partly improve the sintering activity and also these defects on the surface of phosphors will be decreased in the process of ceramic sintering.Therefore,taking into account of the other performance,it is sure that the phosphors from CP method will be a superior candidate for the preparation of scintillation ceramics in medical application areas,having the lowest crystallization temperature,the strongest emission intensity,and an appropriate decay time(<80 ns).
4 Conclusions
YLuAG:Ce phosphors,synthesized by nitrate-pyrolysis (NP),co-precipitation(CP)with ammonium hydrogen carbonate,and citrate-combustion(CC)respectively,can be all crystallized below 1000°C.The phosphors by CP method have the lowest crystallization temperature under 800°C.The morphology of these varied powders is all spherical,with the primary particle size of about 25-50 nm.Furthermore,the phosphors by CP and CC method have less agglomerate than those by NP route.The phosphors by CP method possess the strongest intensity of emission owing to its highest crystallization degree. And a blue shifting of emission related to the surface defects is also observed in the CP and CC samples,because the samples both have a smaller particle size.For scintillation performance, the phosphors by CC method show the shortest slow component(52.1 ns)of decay time and the maximum proportion of fast decay component(16.4%)because of more defects in its bulk phase and a smaller particle size,which also result in a lowest emission intensity.The lowest fast decay component proportion(7.4%)is obtained in the phosphors by NP method. The TL curves reveal that the dominant defects in the three kinds of phosphors are quite different and the phosphors from CP method have the best TL glow performance for the preparation of scintillation ceramics.
(1) Heath,R.L.;Hofstadter,R.;Hughes,E.B.Nucl.Instrum. Methods 1979,162,431.
(2) Ishii,M.;Kobayashi,M.Cryst.Growth Charact.1991,23,245.
(3) Nikl,M.;Mihokova,E.;Mares,J.A.;Vedda,A.;Martini,M.; Nejezchleb,K.;Blazek,K.Phys.Stat.Sol.2000,181,10.
(4)Antić,Ž.;Krsmanović,R.;Wojtowicz,M.;Zych,E.;Bártová, B.;Dramićanin,M.D.Opt.Mater.2010,32,1612.
(5) Mihóková,E.;Nikl,M.;Mareš,J.A.;Beitlerová,A.;Vedda,A.; Nejezchleb,K.;Bla ek,K.;DʹAmbrosio,C.J.Lumin.2007, 126,77.
(6) Pankaratov,V.;Grigorjeva,L.;Millers,D.;Chudoba,T.Radiat. Measur.2007,42,679.
(7) Zych,E.;Brecdher,C.;Wojtowicz,A.J.;Lingertat,H.J.Lumin. 1997,75,193.
(8)Ikesue,A.;Kamata,K.;Yoshida,K.J.Am.Ceram.Soc.1995, 78,225.
(9) Zych,E.;Brecher,C.;Lingertat,H.J.Lumin.1998,78,121.
(10) Zhang,K.;Liu,Q.F.;Liu,Q.;Shi,Y.;Pan,Y.B.J.Comb. Chem.2010,12,453.
(11) Pan,Y.X.;Wu,M.M.;Su,Q.Mater.Sci.Eng.B 2004,106,251.
(12) Qiu,F.G.;Pu,X.P.;Li,J.;Liu,X.J.;Pan,Y.B.;Guo,J.K. Ceram.Int.2005,31,663.
(13) Bhattacharyya,S.;Ghatak,S.Ceram.Int.2009,35,29.
(14)Wu,Z.G.;Zhang,X.D.;He,W.;Du,Y.W.;Jia,N.T.;Xu,G. G.J.Alloy.Compd.2009,468,571.
(15) Hassanzadeh-Tabrizi,S.A.;Taheri-Nassaj,E.;Sarpoolaky,H. J.Alloy.Compd.2008,456,282.
(16) Blasse,G.;Bril,A.Appl.Phys.Lett.1967,11,53.
(17)Yuan,F.L.;Ryu,H.Mater.Sci.Eng.B 2004,107,14.
(18) Kasuya,R.;Isobe,T.;Kuma,H.;Katano,J.J.Phys.Chem.B 2005,109,22126.
(19) Wei,Z.G.;Sun,L.D.;Jiang,X.C.;Liao,C.S.;Yan,C.H. Chem.Mater.2003,15,3011.
(20) Robbins,D.J.;Cockayne,B.;Lent,B.Phys.Rev.B 1979,19, 1254.
(21) Zhang,K.;Liu,H.Z.;Wu,Y.T.J.Inorg.Mater.2008,23,1045.
(22) Chen,R.;McKeever,S.W.S.Theory of Thermoluminescence and Related Phenomena.1st ed.;World Scientific:Singapore, 1997;pp 99-113.
(23) Rodríguez-Rojas,R.A.;De la Rosa-Cruz,E.;Díaz-Torres,L. A.;Salas,P.;Meléndrez,R.;Barboza-Flores,M.;Meneses-Nava,M.A.;Barbosa-Garíc,O.Opt.Mater.2004,25,285.
(24) Zhong,J.P.;Liang,H.B.;Su,Q.;Zhou,J.Y.;Wang,J.Y.Tans. Nonferrous Met.Soc.China 2009,19,1628.
(25) Yang,X.B.;Xu,J.;Li,H.J.;Bi,Q.Y.;Su,L.B.;Cheng,Y.; Tang,Q.J.Appl.Phys.2009,106,033105.
March 21,2011;Revised:May 22,2011;Published on Web:June 3,2011.
Effect of Defects on the Luminescence and Scintillation Property of YLuAG:Ce Phosphors Obtained by Different Synthetic Routes
ZHANG Kong1,2LIU Qian1,*SU Xiao-Bin1,2ZHONG Hong-Mei1SHI Yun3PAN Yu-Bai3
(1State Key Laboratory of High Performance Ceramics and Superfine Microstructure,Shanghai Institute of Ceramics,Chinese Academy of Sciences,Shanghai 200050,P.R.China;2Graduate University of Chinese Academy of Sciences,Beijing 100049, P.R.China;3Key Laboratory of Transparent Opto-functional Inorganic Material,Shanghai Institute of Ceramics, Chinese Academy of Sciences,Shanghai 200050,P.R.China)
Optimized YLuAG:Ce(Y0.600Lu2.364Al5O12:Ce0.036)phosphors were synthesized by three methods: nitrate-pyrolysis(NP),co-precipitation(CP)with ammonium hydrogen carbonate,and citrate-combustion (CC).Differences in the reaction process,crystallization,morphologies,photoluminescence(PL),and scintillant performance of the three kinds of phosphors were revealed and are explained using Fourier transform infrared spectroscopy(FTIR),X-ray diffraction(XRD),transmission electron microscopy(TEM), PL and thermoluminescence(TL)measurements and observations.Obvious differences in the emission bands and decay times of the different phosphors prepared were found and the differences were mostly caused by the defects either on the surface or in the bulk phase of the YLuAG:Ce phosphors powders.The recorded thermoluminescence spectra of the three kinds of phosphors show a different intensity and main glow peak positions.Additionally,the thermoluminescence spectra show that the synthesis methods induce defects in the phosphors.The defects result in strong trapping process effects and a high probability of radiative recombination between the trapped holes and electrons in the final phosphor powders that were obtained using the different synthesis routes.
YLuAG:Ce phosphor;Synthesis;Luminescence;Decay time;Defect
∗Corresponding author.Email:qianliu@sunm.shcnc.ac.cn;Tel:+86-21-52412612;
The project was supported by the National High Technology Research and Development Program of China(863)(2009AA03Z437).
国家高技术研究发展计划(863)(2009AA03Z437)资助项目
O644
猜你喜欢
中国科学院院刊(2023年2期)2023-02-27 09:55:44
建材发展导向(2022年24期)2022-12-22 07:44:36
——李振声
干旱地区农业研究(2022年3期)2022-06-09 08:45:04
建材发展导向(2020年16期)2020-09-25 07:53:52
原子能科学技术(2020年7期)2020-07-14 13:44:16
中山大学学报(自然科学版)(中英文)(2020年1期)2020-02-26 11:06:28
电镀与环保(2018年1期)2018-04-04 05:21:22
文物保护与考古科学(2016年4期)2016-05-17 05:31:23
中国科学院院刊(2016年8期)2016-03-24 09:29:45
应用海洋学学报(2015年1期)2015-11-22 07:19:36

- 物理化学学报的其它文章
- Micellization Behavior of an Amphiphilic Drug Promethazine Hydrochloride-Surfactant System in an Aqueous Medium
- Synthesis of a Novel Thiadiazine Derivative and Electrochemical Properties for Pb2+Transfer across Water/1,2-Dichloroethane Interface
- 一种可作为FCC基质的新型改性镁铝尖晶石材料
- 纳米碳纤维载铂作为质子交换膜燃料电池阳极催化剂
- 乙烯基噻吩共轭螺噁嗪化合物的密度泛函理论研究
- 用于单分子动力学实验的微流控混合器