基于密度比模型的pAUC半参数估计方法及其应用
2024-12-31 00:00:00余昊赵超群杨建萍
浙江理工大学学报 2024年11期


摘 要: 为了进一步提高pAUC(Partial area under curve)估计精度和医学诊断测试精确性,提出了一种基于密度比模型的pAUC半参数估计方法,并从理论和仿真两个方面研究其性质。首先,根据密度比模型,用半参数极大似然估计方法得到了pAUC半参数估计量,并用大样本理论分析了它的统计性能;然后,对pAUC半参数估计方法在实际应用中的性能进行了仿真,并与现有精度较高的pAUC非参数估计方法进行比较。研究发现,pAUC半参数估计量不仅具有相合渐近正态性等重要的统计性质,而且比已有的非参数pAUC估计量具有更高的渐近估计效率和精确度。将该pAUC半参数估计方法应用于乳腺癌诊断模型的筛选,得到了一个预测精度更高的新乳腺癌诊断模型,结果表明该方法在实际应用中能提高医学诊断测试的精度。
关键词: pAUC;半参数估计;密度比模型;渐近正态性;医学诊断
中图分类号: O212.1
文献标志码: A
文章编号: 1673-3851 (2024)11-0867-09
引文格式:余昊,赵超群,杨建萍. 基于密度比模型的pAUC半参数估计方法及其应用[J]. 浙江理工大学学报(自然科学),2024,51(6):867-875.
Reference Format:" YU" Hao,ZHAO Chaoqun,YANG Jianping. A semi-parametric estimation method for pAUC based on the density ratio model and its application[J]. Journal of Zhejiang Sci-Tech University,2024,51(6):867-875.
A semi-parametric estimation method for pAUC based on the density ratio model and its application
YU Haoa, ZHAO Chaoquna, YANG Jianpingb
(a.School of Computer Science and Technology; b.School of Science, Zhejiang Sci-Tech University, Hangzhou 310018, China)
Abstract:" In order to further improve the estimation accuracy of pAUC (partial area under curve) and the accuracy of medical diagnosis tests, a semi-parameter estimation method of pAUC based on density ratio model is proposed, and its properties are studied from both theoretical and simulation aspects. Firstly, according to the density ratio model, the semi-parametric maximum likelihood estimator of pAUC is obtained based on the semi-parametric maximum likelihood estimation method, and its statistical performance is analyzed by using the large sample theory. Then, the performance of the pAUC semi-parametric estimation method in practical application is simulated and compared with the existing non-parametric estimation method in term of accuracy. It is found that not only the semi-parametric pAUC estimator has important statistical properties such as consistent asymptotic normality, but also it has higher asymptotic estimation efficiency and accuracy than the existing nonparametric pAUC estimator. The semi-parameter estimation method for pAUC is applied to the screening of breast cancer diagnosis models, and a new breast cancer diagnosis model with higher prediction accuracy is obtained. The result shows that the proposed method can improve the accuracy of medical diagnosis tests in practical applications.
Key words: pAUC; semi-parametric estimatior; density ratio model; asymptotic normality; medical diagnosis
0 引 言
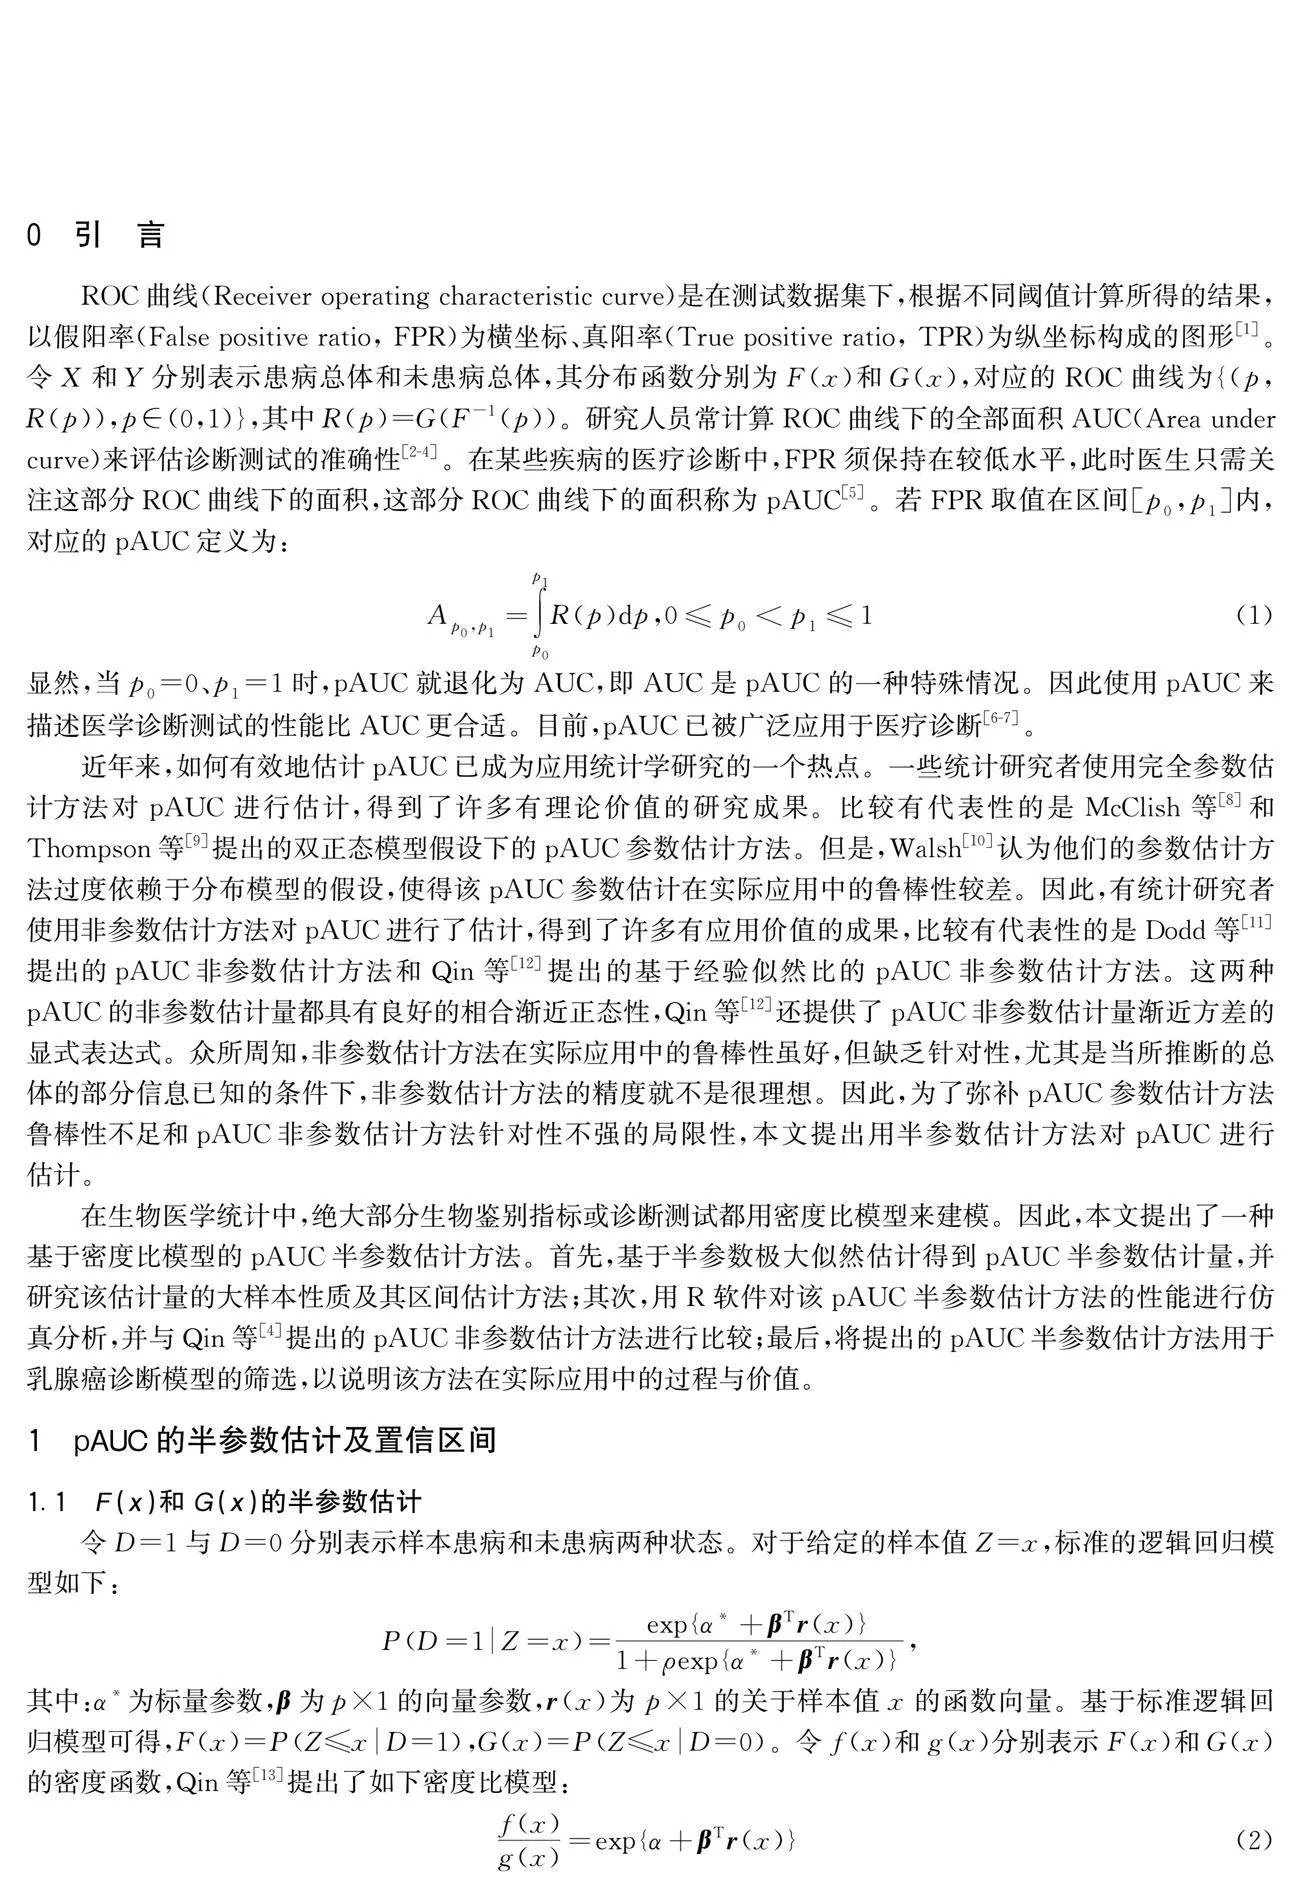
ROC曲线(Receiver operating characteristic curve)是在测试数据集下,根据不同阈值计算所得的结果,以假阳率(False positive ratio, FPR)为横坐标、真阳率(True positive ratio, TPR)为纵坐标构成的图形[1]。令X和Y分别表示患病总体和未患病总体,其分布函数分别为F(x)和G(x),对应的ROC曲线为{(p,R(p)),p∈(0,1)},其中R(p)=G(F-1(p))。研究人员常计算ROC曲线下的全部面积AUC(Area under curve)来评估诊断测试的准确性[2-4]。在某些疾病的医疗诊断中,FPR须保持在较低水平,此时医生只需关注这部分ROC曲线下的面积,这部分ROC曲线下的面积称为pAUC[5]。若FPR取值在区间[p0,p1]内,对应的pAUC定义为:
Ap0,p1=∫p1p0R(p)dp,0≤p0lt;p1≤1(1)
显然,当p0=0、p1=1时,pAUC就退化为AUC,即AUC是pAUC的一种特殊情况。因此使用pAUC来描述医学诊断测试的性能比AUC更合适。目前,pAUC已被广泛应用于医疗诊断[6-7]。
近年来,如何有效地估计pAUC已成为应用统计学研究的一个热点。一些统计研究者使用完全参数估计方法对pAUC进行估计,得到了许多有理论价值的研究成果。比较有代表性的是McClish等[8]和Thompson等[9]提出的双正态模型假设下的pAUC参数估计方法。但是,Walsh[10]认为他们的参数估计方法过度依赖于分布模型的假设,使得该pAUC参数估计在实际应用中的鲁棒性较差。因此,有统计研究者使用非参数估计方法对pAUC进行了估计,得到了许多有应用价值的成果,比较有代表性的是Dodd等[11]提出的pAUC非参数估计方法和Qin等[12]提出的基于经验似然比的pAUC非参数估计方法。这两种pAUC的非参数估计量都具有良好的相合渐近正态性,Qin等[12]还提供了pAUC非参数估计量渐近方差的显式表达式。众所周知,非参数估计方法在实际应用中的鲁棒性虽好,但缺乏针对性,尤其是当所推断的总体的部分信息已知的条件下,非参数估计方法的精度就不是很理想。因此,为了弥补pAUC参数估计方法鲁棒性不足和pAUC非参数估计方法针对性不强的局限性,本文提出用半参数估计方法对pAUC进行估计。
在生物医学统计中,绝大部分生物鉴别指标或诊断测试都用密度比模型来建模。因此,本文提出了一种基于密度比模型的pAUC半参数估计方法。首先,基于半参数极大似然估计得到pAUC半参数估计量,并研究该估计量的大样本性质及其区间估计方法;其次,用R软件对该pAUC半参数估计方法的性能进行仿真分析,并与Qin等[4]提出的pAUC非参数估计方法进行比较;最后,将提出的pAUC半参数估计方法用于乳腺癌诊断模型的筛选,以说明该方法在实际应用中的过程与价值。
1 pAUC的半参数估计及置信区间
1.1 F(x)和G(x)的半参数估计
令D=1与D=0分别表示样本患病和未患病两种状态。对于给定的样本值Z=x,标准的逻辑回归模型如下:
PD=1Z=x=expα*+βTr(x)1+ρexpα*+βTr(x),
其中:α*为标量参数,β为p×1的向量参数,r(x)为p×1的关于样本值x的函数向量。基于标准逻辑回归模型可得,F(x)=PZ≤xD=1,G(x)=PZ≤xD=0。令f(x)和g(x)分别表示F(x)和G(x)的密度函数,Qin等[13]提出了如下密度比模型:
f(x)g(x)=expα+βTr(x)(2)
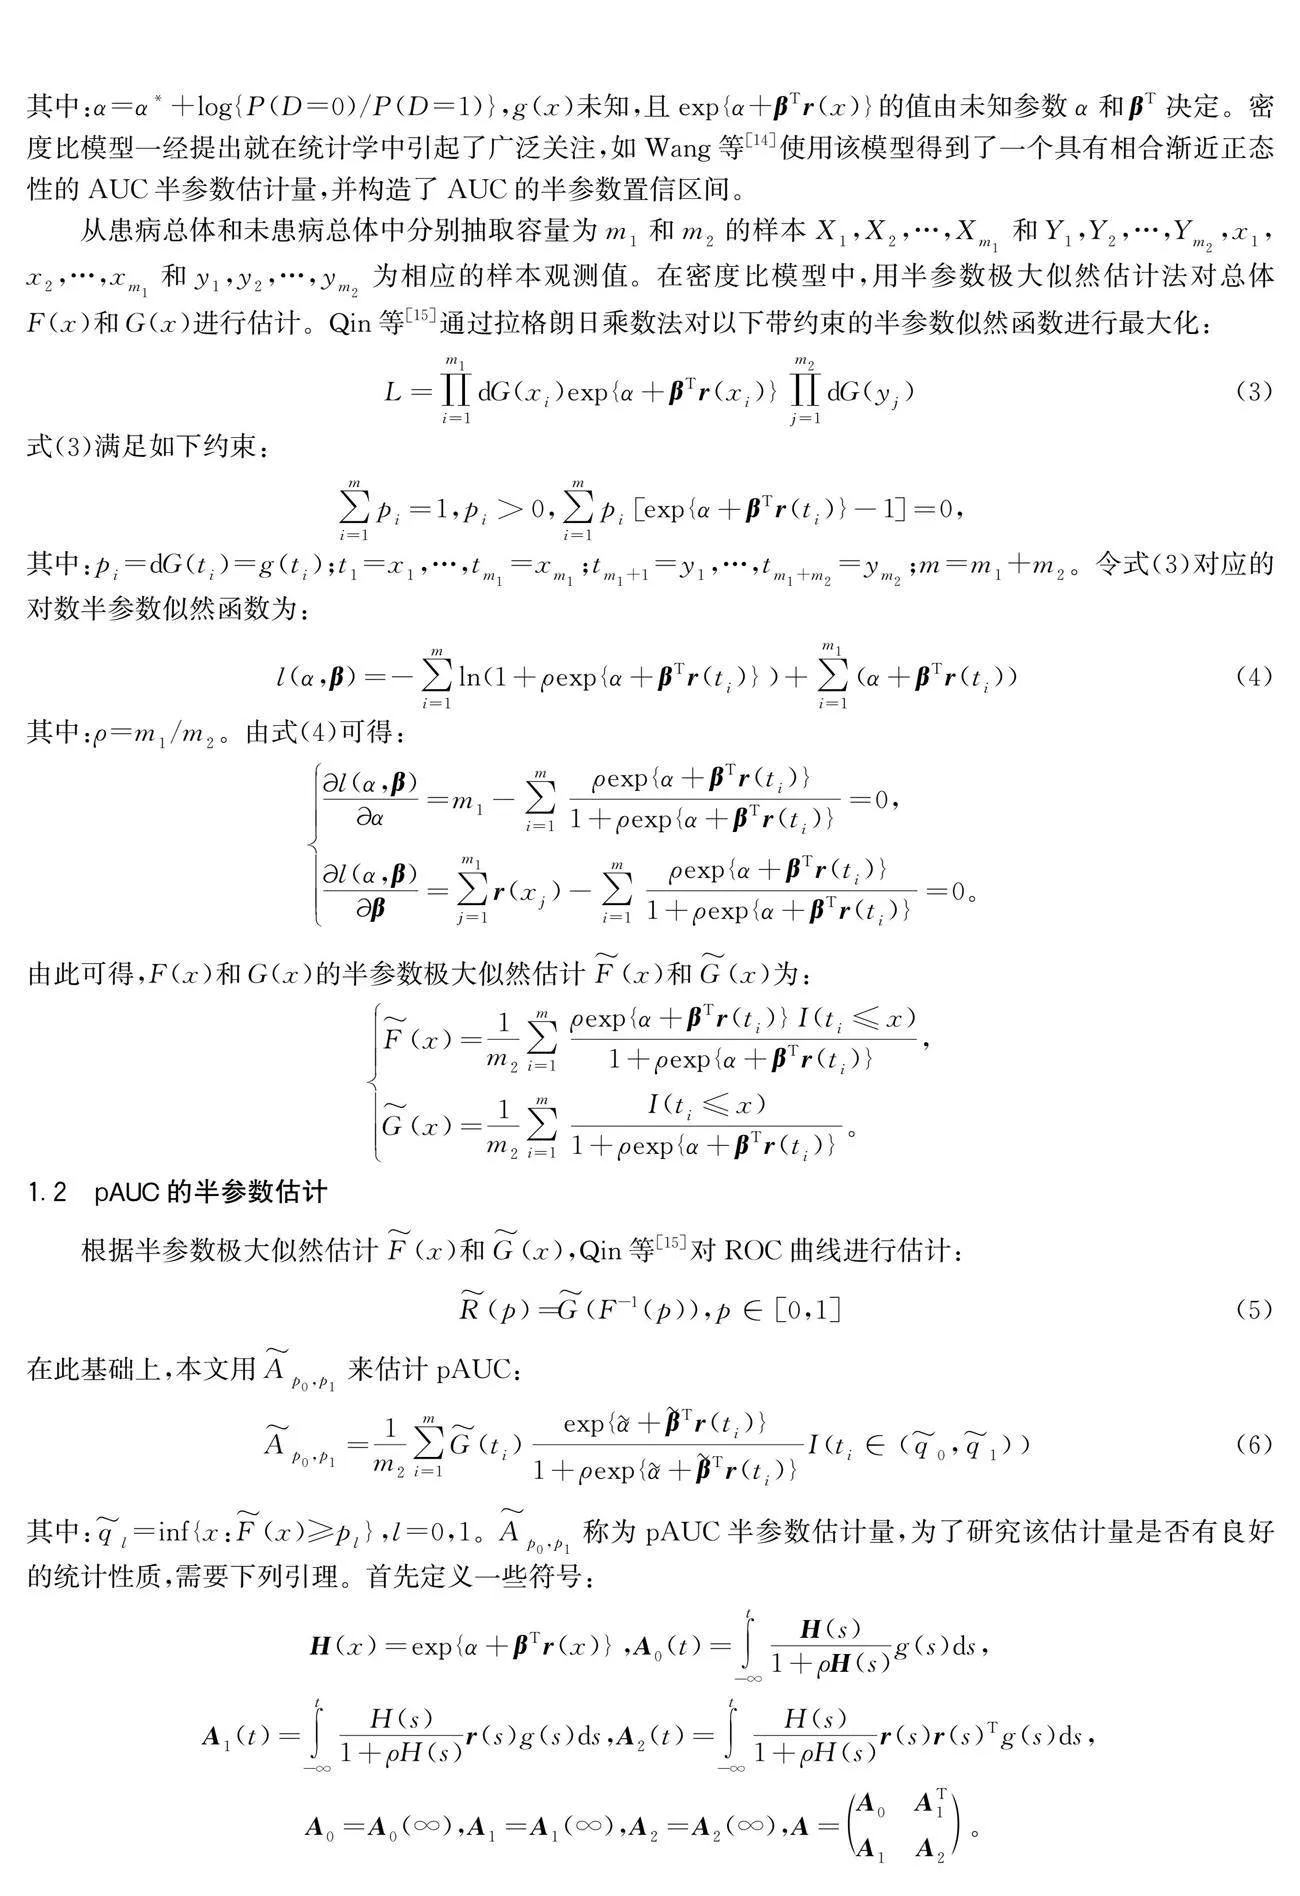
其中:α=α*+log{P(D=0)/P(D=1)},g(x)未知,且expα+βTr(x)的值由未知参数α和βT决定。密度比模型一经提出就在统计学中引起了广泛关注,如Wang等[14]使用该模型得到了一个具有相合渐近正态性的AUC半参数估计量,并构造了AUC的半参数置信区间。
从患病总体和未患病总体中分别抽取容量为m1和m2的样本X1,X2,…,Xm1和Y1,Y2,…,Ym2,x1,x2,…,xm1和y1,y2,…,ym2为相应的样本观测值。在密度比模型中,用半参数极大似然估计法对总体F(x)和G(x)进行估计。Qin等[15]通过拉格朗日乘数法对以下带约束的半参数似然函数进行最大化:
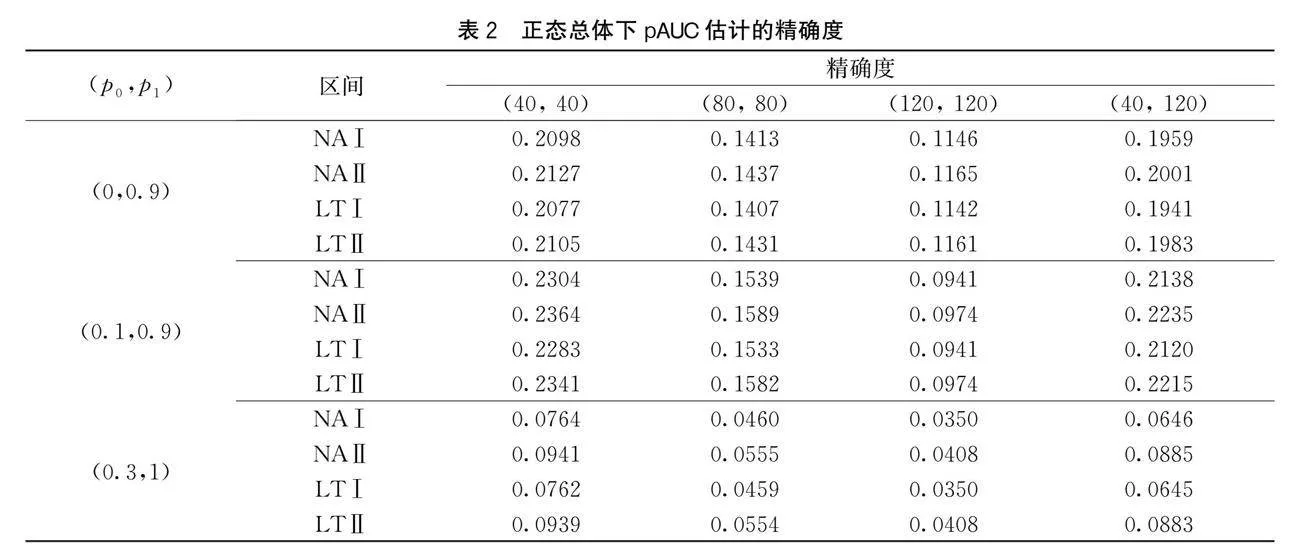
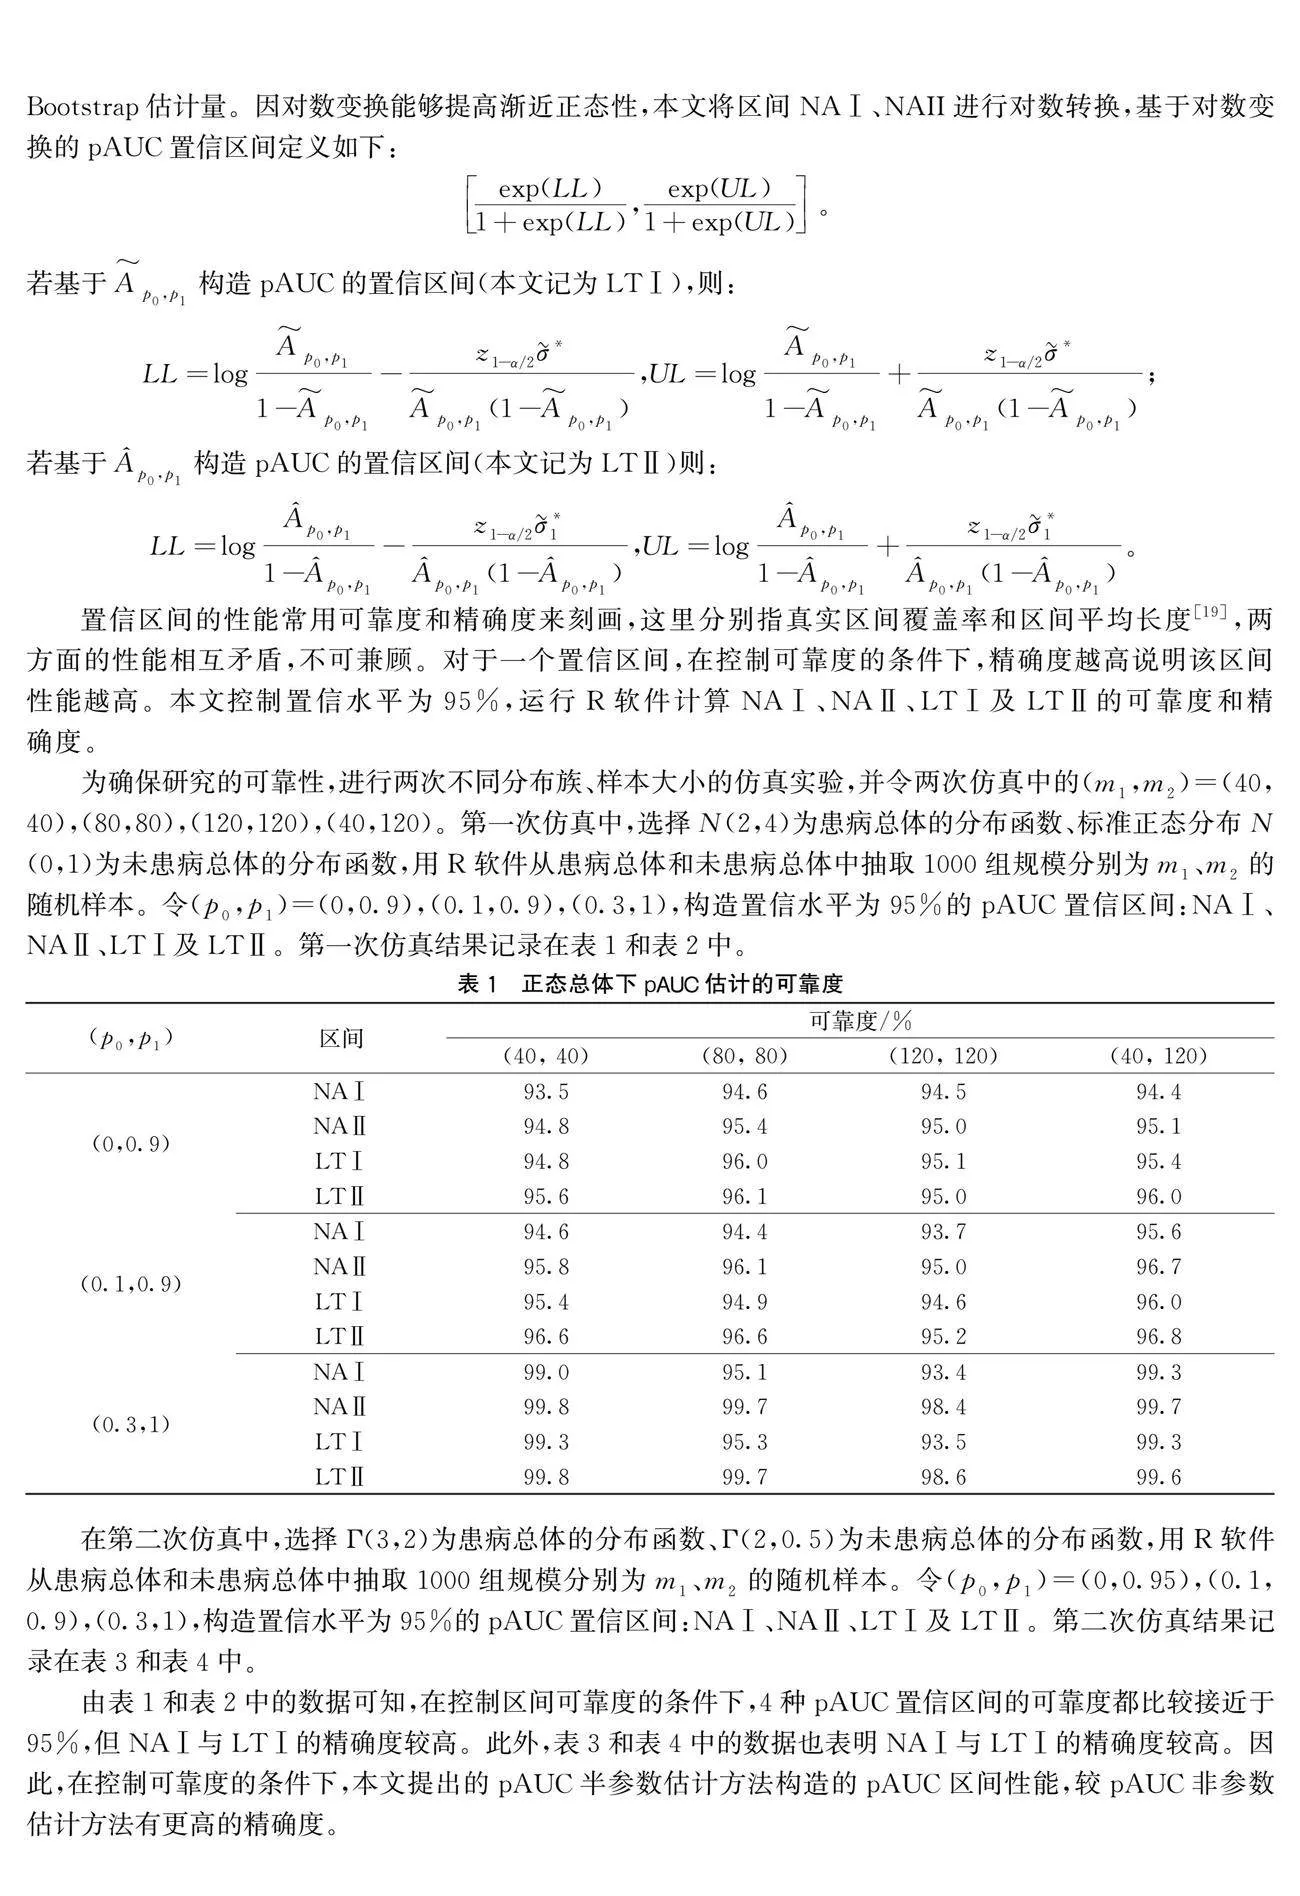
为确保研究的可靠性,进行两次不同分布族、样本大小的仿真实验,并令两次仿真中的(m1,m2)=(40,40),(80,80),(120,120),(40,120)。第一次仿真中,选择N(2,4)为患病总体的分布函数、标准正态分布N(0,1)为未患病总体的分布函数,用R软件从患病总体和未患病总体中抽取1000组规模分别为m1、m2的随机样本。令(p0,p1)=(0,0.9),(0.1,0.9),(0.3,1),构造置信水平为95%的pAUC置信区间:NAⅠ、NAⅡ、LTⅠ及LTⅡ。第一次仿真结果记录在表1和表2中。
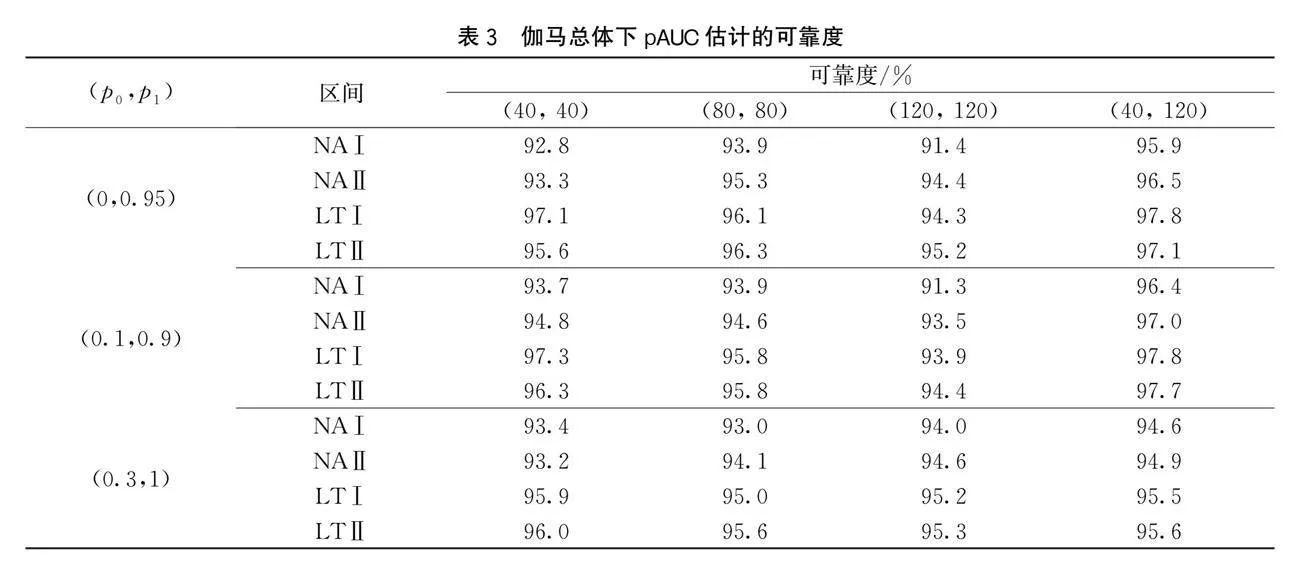
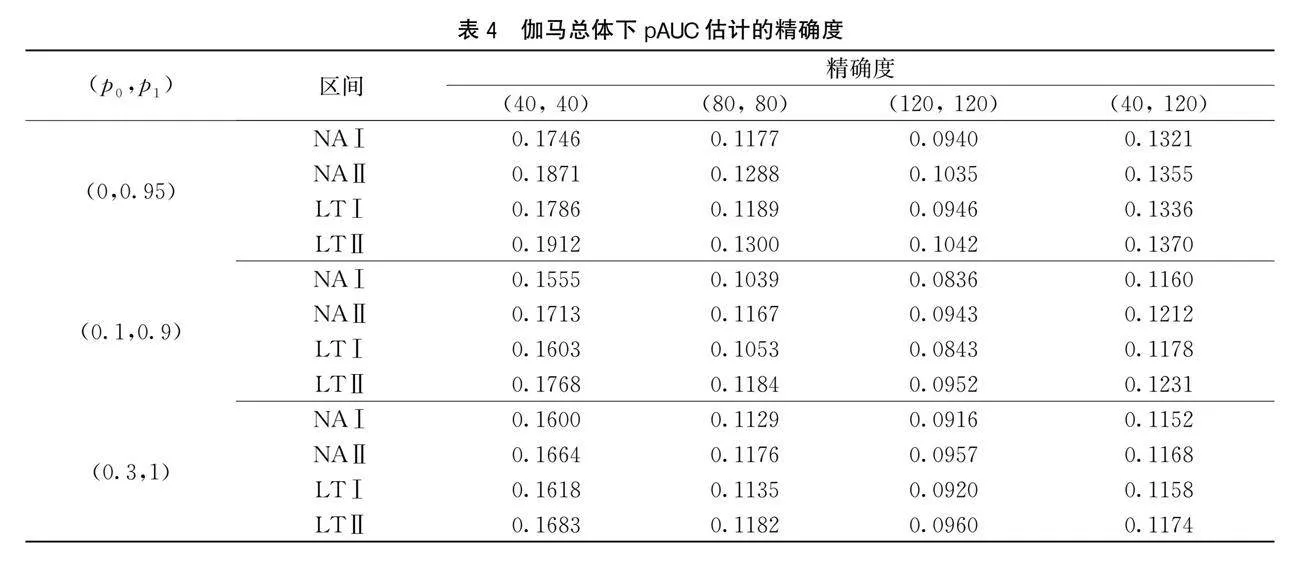
在第二次仿真中,选择Γ(3,2)为患病总体的分布函数、Γ(2,0.5)为未患病总体的分布函数,用R软件从患病总体和未患病总体中抽取1000组规模分别为m1、m2的随机样本。令(p0,p1)=(0,0.95),(0.1,0.9),(0.3,1),构造置信水平为95%的pAUC置信区间:NAⅠ、NAⅡ、LTⅠ及LTⅡ。第二次仿真结果记录在表3和表4中。
由表1和表2中的数据可知,在控制区间可靠度的条件下,4种pAUC置信区间的可靠度都比较接近于95%,但NAⅠ与LTⅠ的精确度较高。此外,表3和表4中的数据也表明NAⅠ与LTⅠ的精确度较高。因此,在控制可靠度的条件下,本文提出的pAUC半参数估计方法构造的pAUC区间性能,较pAUC非参数估计方法有更高的精确度。
3 应用分析
pAUC半参数估计方法在实际应用中可用于筛选高鉴别能力的生物指标物。本文通过一个乳腺癌诊断模型筛选实例来说明。乳腺癌是乳腺上皮细胞在多种致癌因子的作用下,发生增殖失控进而恶变的一种现象;乳腺癌会引起多器官病变,直接威胁患者的生命,是威胁女性健康较严重的恶性肿瘤之一。因此,为临床医生提供高鉴别能力的乳腺癌诊断模型,以便患者在早期诊断中得到正确诊断和有效的治疗,显得尤为重要。
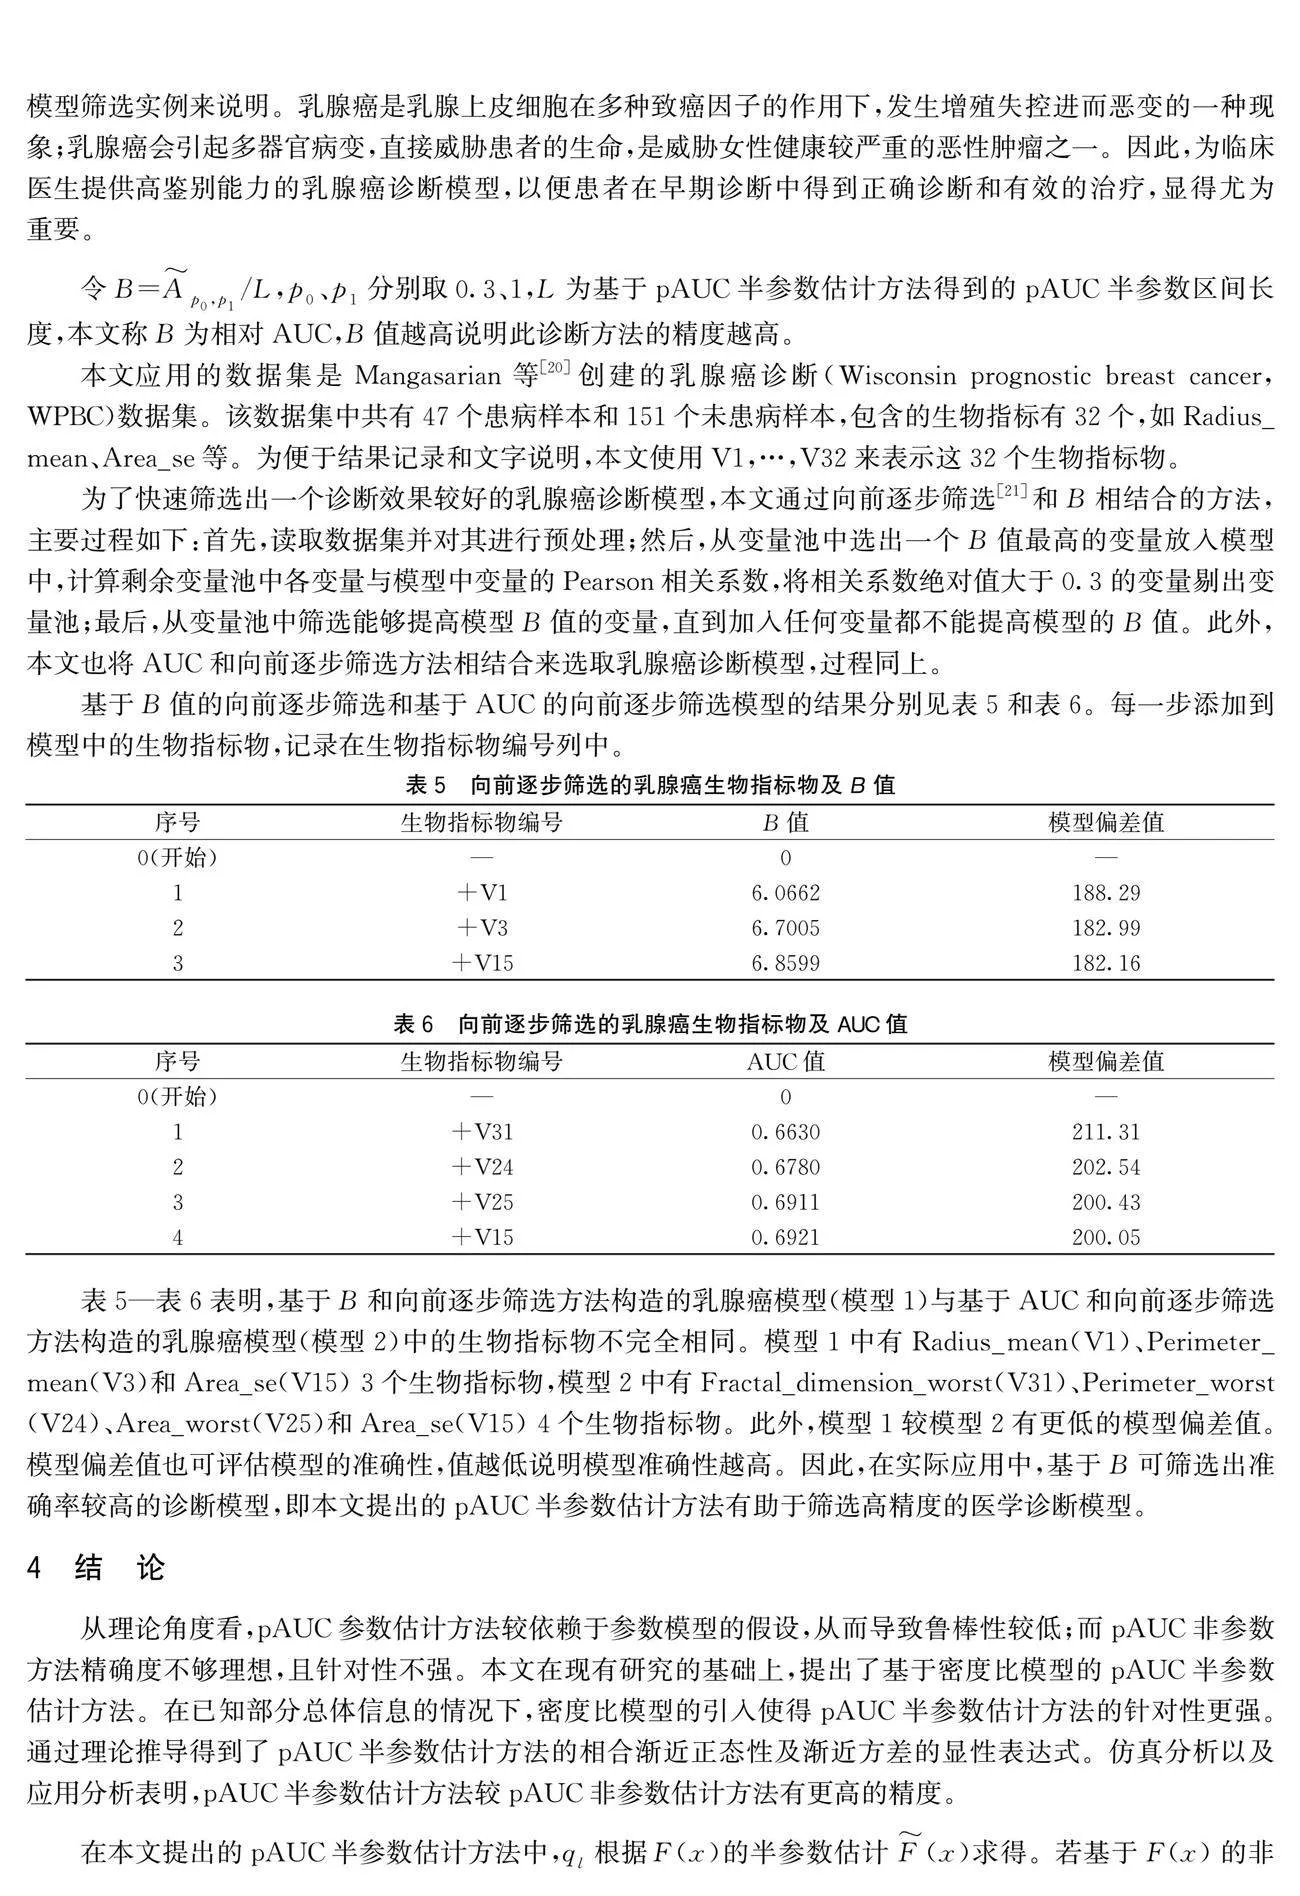
令B=A~p0,p1/L,p0、p1分别取0.3、1,L为基于pAUC半参数估计方法得到的pAUC半参数区间长度,本文称B为相对AUC,B值越高说明此诊断方法的精度越高。
本文应用的数据集是Mangasarian等[20]创建的乳腺癌诊断(Wisconsin prognostic breast cancer, WPBC)数据集。该数据集中共有47个患病样本和151个未患病样本,包含的生物指标有32个,如Radius_mean、Area_se等。为便于结果记录和文字说明,本文使用V1,…,V32来表示这32个生物指标物。
为了快速筛选出一个诊断效果较好的乳腺癌诊断模型,本文通过向前逐步筛选[21]和B相结合的方法,主要过程如下:首先,读取数据集并对其进行预处理;然后,从变量池中选出一个B值最高的变量放入模型中,计算剩余变量池中各变量与模型中变量的Pearson相关系数,将相关系数绝对值大于0.3的变量剔出变量池;最后,从变量池中筛选能够提高模型B值的变量,直到加入任何变量都不能提高模型的B值。此外,本文也将AUC和向前逐步筛选方法相结合来选取乳腺癌诊断模型,过程同上。
基于B值的向前逐步筛选和基于AUC的向前逐步筛选模型的结果分别见表5和表6。每一步添加到模型中的生物指标物,记录在生物指标物编号列中。
表5—表6表明,基于B和向前逐步筛选方法构造的乳腺癌模型(模型1)与基于AUC和向前逐步筛选方法构造的乳腺癌模型(模型2)中的生物指标物不完全相同。模型1中有Radius_mean(V1)、Perimeter_mean(V3)和Area_se(V15) 3个生物指标物,模型2中有Fractal_dimension_worst(V31)、Perimeter_worst(V24)、Area_worst(V25)和Area_se(V15) 4个生物指标物。此外,模型1较模型2有更低的模型偏差值。模型偏差值也可评估模型的准确性,值越低说明模型准确性越高。因此,在实际应用中,基于B可筛选出准确率较高的诊断模型,即本文提出的pAUC半参数估计方法有助于筛选高精度的医学诊断模型。
4 结 论
从理论角度看,pAUC参数估计方法较依赖于参数模型的假设,从而导致鲁棒性较低;而pAUC非参数方法精确度不够理想,且针对性不强。本文在现有研究的基础上,提出了基于密度比模型的pAUC半参数估计方法。在已知部分总体信息的情况下,密度比模型的引入使得pAUC半参数估计方法的针对性更强。通过理论推导得到了pAUC半参数估计方法的相合渐近正态性及渐近方差的显性表达式。仿真分析以及应用分析表明,pAUC半参数估计方法较pAUC非参数估计方法有更高的精度。
在本文提出的pAUC半参数估计方法中,ql根据F(x)的半参数估计F~(x)求得。若基于F(x)的非参数极大似然估计F^(x)求解ql,并将求得的ql应用于本文方法,是否能得到更好的结果有待后续研究。
参考文献:
[1]Bradley A P. ROC curve equivalence using the Kolmogorov-Smirnov test[J]. Pattern Recognition Letters, 2013, 34(5): 470-475.
[2]Zhang J Y, Wei Q, Dong D, et al. The role of TPS, CA125, CA15-3 and CEA in prediction of distant metastasis of breast cancer[J]. Clinica Chimica Acta, 2021, 523: 19-25.
[3]杨铧琦, 敬敏, 杨堃, 等. 血清TK1、CA125、HE4对卵巢癌诊断的价值研究[J]. 河北医药, 2022, 44(15): 2350-2353.
[4]程庆华, 彭晓澜, 林凤珠, 等. 多模态MRI在宫颈癌病理分化程度及组织学分型的价值研究[J]. 放射学实践, 2022, 37(10):1268-1272.
[5]Thomas L C. Consumer Credit Models: Pricing, Profit and Portfolios[M]. New York: Oxford University Press, 2009: 100-151.
[6]Montesano G, McKendrick A M, Turpin A, et al. Do additional testing locations improve the detection of macular perimetric defects in glaucoma?[J]. Ophthalmology, 2021, 128(12): 1722-1735.
[7]Fang L Y, Uppoor R, Xu M J, et al. Use of partial area under the curve in bioavailability or bioequivalence assessments: a regulatory perspective[J]. Clinical Pharmacology and Therapeutics, 2021, 110(4): 880-887.
[8]McClish D K. Analyzing a portion of the ROC curve[J]. Medical Decision Making: an International Journal of the Society for Medical Decision Making, 1989, 9(3): 190-195.
[9]Thompson M L, Zucchini W. On the statistical analysis of ROC curves[J]. Statistics in Medicine, 1989, 8(10): 1277-1290.
[10]Walsh S J. Limitations to the robustness of binormal ROC curves: effects of model misspecification and location of decision thresholds on bias, precision, size and power[J]. Statistics in Medicine, 1997, 16(6): 669-679.
[11]Dodd L E, Pepe M S. Partial AUC estimation and regression[J]. Biometrics, 2003, 59(3): 614-623.
[12]Qin G S, Jin X P, Zhou X H. Non-parametric interval estimation for the partial area under the ROC curve[J]. Canadian Journal of Statistics, 2011, 39(1): 17-33.
[13]Qin J, Zhang B. A goodness-of-fit test for logistic regression models based on case-control data[J]. Biometrika, 1997, 84(3): 609-618.
[14]Wang S H, Zhang B. Semiparametric empirical likelihood confidence intervals for AUC under a density ratio model[J]. Computational Statistics amp; Data Analysis, 2014, 70: 101-115.
[15]Qin J, Zhang B. Using logistic regression procedures for estimating receiver operating characteristic curves[J]. Biometrika, 2003, 90(3): 585-596.
[16]Billingsley P. Convergence of Probability Measures[M]. New York: Wiley, 1968: 29-34 .
[17]Hsieh F, Turnbull B W. Nonparametric and semiparametric estimation of the receiver operating characteristic curve[J]. The Annals of Statistics, 1996, 24(1): 25-40.
[18]Zhang B. Quantile estimation under a two-sample semi-parametric model[J]. Bernoulli, 2000, 6(3): 491-511.
[19]Yuan M, Li P F, Wu C B. Semiparametric Inference of the Youden Index and the Optimal Cutoff Point under Density Ratio Model[J]. Canadian Journal of Statistics, 2021, 49(3): 965-986.
[20]Mangasarian O L, Street W N, Wolberg W H. Breast cancer diagnosis and prognosis via linear programming[J]. Operations Research, 1995, 43(4): 570-577.
[21]Bilder C R, Loughin T M.Analysis of Categorical Data with R[M]. Boca Raton, FL, US: Chapman and Hall/CRC, 2014: 272-277.
(责任编辑:康 锋)