
Prediction model for hepatitis B e antigen seroconversion in chronic hepatitis B with peginterferon-alfa treated based on a responseguided therapy strategy
2024-05-08 09:21PeiXinZhangXiaoWeiZhengYaFeiZhangJunYeWeiLiQianQianTangJieZhuGuiZhouZouZhenHuaZhang
World Journal of Hepatology 2024年3期
Pei-Xin Zhang, Xiao-Wei Zheng, Ya-Fei Zhang, Jun Ye, Wei Li, Qian-Qian Tang, Jie Zhu, Gui-Zhou Zou, Zhen-Hua Zhang
Abstract BACKGROUND Models for predicting hepatitis B e antigen (HBeAg) seroconversion in patients with HBeAg-positive chronic hepatitis B (CHB) after nucleos(t)ide analog treatment are rare.AIM To establish a simple scoring model based on a response-guided therapy (RGT) strategy for predicting HBeAg seroconversion and hepatitis B surface antigen (HBsAg) clearance.METHODS In this study, 75 previously treated patients with HBeAg-positive CHB underwent a 52-week peginterferon-alfa (PEG-IFNα) treatment and a 24-wk follow-up. Logistic regression analysis was used to assess parameters at baseline, week 12, and week 24 to predict HBeAg seroconversion at 24 wk post-treatment. The two best predictors at each time point were used to establish a prediction model for PEG-IFNα therapy efficacy. Parameters at each time point that met the corresponding optimal cutoff thresholds were scored as 1 or 0.RESULTS The two most meaningful predictors were HBsAg ≤ 1000 IU/mL and HBeAg ≤ 3 S/CO at baseline, HBsAg ≤ 600 IU/mL and HBeAg ≤ 3 S/CO at week 12, and HBsAg ≤ 300 IU/mL and HBeAg ≤ 2 S/CO at week 24. With a total score of 0 vs 2 at baseline, week 12, and week 24, the response rates were 23.8%, 15.2%, and 11.1% vs 81.8%, 80.0%, and 82.4%, respectively, and the HBsAg clearance rates were 2.4%, 3.0%, and 0.0%, vs 54.5%, 40.0%, and 41.2%, respectively.CONCLUSION We successfully established a predictive model and diagnosis-treatment process using the RGT strategy to predict HBeAg and HBsAg seroconversion in patients with HBeAg-positive CHB undergoing PEG-IFNα therapy.
Key Words: Chronic hepatitis B; Hepatitis B e antigen-positive; Peginterferon-alfa; Prediction model; Response-guided therapy strategy
INTRODUCTION
Hepatitis B virus (HBV) infection poses a major public health threat worldwide. The World Health Organization estimated that approximately 296 million people worldwide were infected with chronic hepatitis B (CHB) in 2019, with approximately 820000 deaths from cirrhosis, liver failure, and hepatocellular carcinoma (HCC) caused by CHB[1]. The goal of antiviral therapy is to effectively suppress HBV DNA replication, with sustained hepatitis B surface antigen (HBsAg) clearance as the ideal endpoint[2], which significantly improves overall survival and reduces the risk of HCC and HBV-related mortality[3].
Currently, recommended antiviral treatment options include long-term nucleos(t)ide analogs (NAs) and a limited course of peginterferon alpha (PEG-IFNα) therapy. Most patients with CHB choose NAs because of their availability, affordability, ability to inhibit viral replication, and minimal side effects. The APASL Guideline[2] suggests the possibility of discontinuing antiviral treatment after 1-3 years of NA consolidation therapy following hepatitis B e antigen (HBeAg) seroconversion. However, numerous studies have demonstrated a high clinical relapse rate after discontinuing NAs in both HBeAg-positive and HBeAg-negative patients[4-6]. Maintaining good treatment compliance becomes challenging with long-term or lifelong oral medications, resulting in spontaneous or irregular drug withdrawal. Interferon has direct antiviral and immunomodulatory effects and can significantly reduce the incidence of liver cirrhosis and liver cancer in HBeAg-positive patients after HBeAg seroconversion[7]. Therefore, interferon is appropriate for young patients with CHB seeking permanent treatment cessation. However, the low HBeAg seroconversion rate, multiple contraindications and side effects, high price, and frequent follow-up times significantly limit the use of interferon[8,9].
In clinical practice, many patients with CHB choose NAs for various reasons. However, HBeAg seroconversion remains elusive after years of treatment, and discontinuing the drug is unsafe. Further investigation is needed to determine whether these patients should choose interferon for HBeAg seroconversion or HBsAg clearance. Therefore, optimal treatment strategies are urgently needed for patients pretreated with NAs who have not achieved HBeAg seroconversion.
PEG-IFNα has demonstrated a significantly greater effect in reducing HBsAg levels compared to NAs[10]. The large SWITCH study revealed that switching to PEG-IFNα in HBeAg-negative patients with CHB on long-term NAs could result in high rates of HBsAg loss[11]. Moreover, add-on or switching to PEG-IFNα therapy can optimize therapeutic response[12,13]. However, current studies on the efficacy of PEG-IFNα in previously treated HBeAg-positive patients with CHB are scarce. Several studies have demonstrated that lower baseline HBsAg levels and the extent of HBsAg decline during early treatment are strong predictors of HBeAg seroconversion and clearance in HBeAg-positive patients with CHB previously on NAs after PEG-IFNα therapy[14-16]. However, these studies mainly focus on the performance of a single parameter or predictors either at baseline or early treatment[14,16,17], resulting in limited predictive power. Developing accurate prediction models for monitoring response to PEG-IFNα therapy and viable response-guided therapy (RGT) strategy in HBeAg-positive patients with CHB is necessary. Therefore, this study aimed to establish a simple and practical scoring model based on the RGT strategy for predicting HBeAg seroconversion and clearance.
MATERlALS AND METHODS
Study population
In this open, polycentric, retrospective study conducted from January 2010 to May 2023, 101 NAs-treated HBeAg-positive patients with CHB previously on NAs who received PEG-IFNα-2a/2b treatment were enrolled and followed up at the Second Affiliated Hospital, Anhui Provincial Hospital and the Fuyang Second People’s Hospital of Anhui Medical University. The inclusion criteria were HBsAg positivity for at least 6 months, previous anti-HBV therapy (NAs treatment for at least 6 months), HBeAg-positive status before the current PEG-IFNα treatment, and patients who received at least one PEG-IFNα therapy. The exclusion criteria included co-infection with hepatitis C virus, hepatitis delta virus, or human immunodeficiency virus; resistance to lamivudine, adefovir dipivoxil, or telbivudine; neutrophil count < 1.0 × 10⁹/L; platelet count < 50 × 109/L; de-compensated liver disease; immunologically-mediated disease; incomplete primary data; non-treatment in our hospital for the whole course; alcohol or drug abuse; and pregnancy or lactation. Following the Helsinki Declaration of 1975, the Ethics Committee of Anhui Medical University approved the study, and written informed consent was obtained from all patients.
Study medications
Patients were treated weekly with 180 μg PEG-IFNα-2a/2b (Pegasys; Roche, Shanghai, China or Peginterferonα-2b; Amoytop Biotech, Xiamen, China) by subcutaneous injection for 52 wk, followed by 24 wk off-treatment. Those with PEG-IFNα intolerance received a reduced dose depending on the situation. Patients who completed at least one round of PEG-IFNα therapy were included in this analysis according to the principles of intention-to-treat analysis.
Follow-up and measurements
Clinical assessments were performed from the initial treatment stage, baseline, on-treatment (weeks 12, 24, and 52), and the end of follow-up (EOF) of PEG-IFNα therapy. Commercially available enzyme immunoassays (Abbott, Chicago, IL, United States) were used to measure HBV serological markers (HBsAg, anti-HBs, HBeAg, anti-HBe, and anti-HBc; the lower limit of quantification of HBsAg was 0.05 IU/mL). TaqMan-based real-time polymerase chain reaction) assay (Shanghai ZJ BioTech, Shanghai, China) was used to quantify serum HBV DNA with a lower quantification limit of 500 IU/mL. Serum alanine aminotransferase (ALT) levels, expressed as multiples of the upper limit of normal (40 U/L), were assessed using an automatic biochemical analyzer (Roche, Basel, Switzerland). Blood cells were sorted and counted using an automatic blood cell analyzer (Aptio, Sysmex, Shanghai, China).
Study endpoints
The responses at the end of treatment (EOT) and EOF were defined as HBeAg seroconversion at the end of 52 wk of PEGIFNα therapy and 24 wk off-treatment, respectively. For a few patients who changed their treatment regimen midway, data at 52 or 76 wk of PEG-IFNα therapy were analyzed for EOT or EOF evaluation. Patients with HBeAg seroconversion were defined as responders; otherwise, they were defined as non-responders. The primary endpoint was the HBeAg seroconversion rate at EOF, and the secondary endpoint was HBsAg clearance at EOF.
Statistical analysis and model establishment
Statistical analyses were conducted using the SPSS software version 26.0 (SPSS Inc., Chicago, IL, United States). Graphic production was performed using GraphPad Prism version 9 (GraphPad Prism 9.3.1, Santiago, United States). Descriptive statistics were expressed as mean ± SD or median (interquartile range) for parametric or non-parametric continuous data and were compared using Student’st-test or Mann-WhitneyUtest when necessary. Categorical parameters were expressed as counts (percentage) and compared using theχ2test or Fisher’s exact test as required.
The best cut-off values of parameters were determined based on the areas under the receiver operating characteristic curve (AUROC). In addition, the values adjacent to the best cutoff values (integer, if possible) were used as the best predictive cutoff values (hereafter referred to as the best predictors) for clinical practicability. Univariate and multivariate logistic regression analyses were conducted to identify the best predictors of treatment outcomes. All statistical tests were two-sided, andP< 0.05 was considered significant.
The most significant independent predictors associated with the response at EOF were selected through logistic regression analysis at baseline, week 12, and week 24 using stepwise regression or entry methods. The two best predictors were selected at each time point to establish the prediction models. If the parameters met the optimal threshold, the score was 1. Otherwise, the score was 0, and the sum was the total score.
RESULTS
Baseline characteristics
Out of the 101 patients treated and followed up, 75 (74.3%) were included in the final analysis, with 26 patients excluded (Supplementary Figure 1). At EOF, HBeAg seroconversion occurred in 27 patients (36.0%), eight (10.7%) experienced HBsAg loss, and seven (9.3%) developed anti-HBs.

Figure 1 Kinetics of serum markers in patients with chronic hepatitis B during peginterferon alpha treatment and follow-up between responders and non-responders. A: Alanine aminotransferase; B: Hepatitis B virus DNA; C: Hepatitis B surface antigen; D: Hepatitis B e antigen. aP < 0.05, bP < 0.01, cP < 0.001. RS: Responders; NRS: Non-responders; ALT: Alanine aminotransferase; HBV: Hepatitis B virus; HBsAg: Hepatitis B surface antigen; HBeAg: Hepatitis B e antigen.
At the initial treatment stage, ALT levels in responders were higher than those in non-responders, while HBV DNA, HBsAg, and HBeAg levels were lower in responders. After a period of NAs treatment (median of 2 years), the above indexes decreased significantly, with ALT decreasing to normal levels, HBV DNA below the detection limit, and HBeAg to an extremely low level, and the decline was more pronounced in responders (Figure 1D). The initial therapy and pretreatment duration were comparable.
Compared with non-responders, responders had longer PEG-IFNα treatment duration (13vs9 months), lower baseline HBsAg levels (3.26vs3.51 Lg IU/mL), lower HBeAg levels (0.43vs1.01 Lg S/CO), and lower initial HBsAg and HBeAg levels. The two groups did not differ significantly with respect to sex, age, baseline ALT, HBV DNA, duration of pretreatment, type of NAs, or current treatment strategies (Table 1).

Table 1 Baseline characteristics of patients stratified by the follow-up endpoint
Treatment and follow-up
ALT levels fluctuated during the treatment, and no differences were observed between the two groups at each time point. After a period of NAs treatment, HBV DNA was undetectable at the beginning of PEG-IFNα therapy for most patients (63/75, 84.0%), and no rebound occurred during the entire period (Figure 1A and B).
Throughout the process, the HBsAg and HBeAg levels of the responders decreased gradually, while that of the nonresponders fluctuated at week 52 because the PEG-IFNα treatment course was less than 52 wk. Furthermore, the decline in HBsAg level was more pronounced and persistent. HBeAg showed the most significant decrease at week 12 and gradually decreased continuously thereafter (Figure 1C and D).
Performance of traditional single parameters in predicting response at the EOF
HBsAg and/or HBeAg levels are reliable predictors of response to PEG-IFNα in naïve patients with CHB. HBsAg levels were sub-grouped according to the following criteria[18]: HBsAg < 1500 IU/mL, 1500 ≤ HBsAg ≤ 20000 IU/mL, and HBsAg > 20000 IU/mL. When efficacy was evaluated based on EOF response, no obvious differences were observed between the HBsAg subgroups at baseline and week 12, but significant differences were observed at week 24 (P< 0.001). However, only 34 patients (with HBsAg ≥ 1500 IU/mL at week 24) with a poor response (expected response rate ≤ 15.0%) were considered for PEG-IFNα discontinuation. Similarly, when HBsAg clearance at EOF was assessed, the predictive values at baseline, week 12, and week 24 were extremely limited (P= 0.024), and the highest predictive HBsAg loss rates (with HBsAg level < 1500 IU/mL) were all poor (21.4%, 18.2%, and 19.5%, respectively) (Supplementary Figure 2A-C).

Figure 2 Response and hepatitis B surface antigen loss rates at 24 wk post-treatment based on patients who met single hepatitis B surface antigen or hepatitis B e antigen cutoffs at each time point. A-F: Moreover, the proportion of patients who met the single hepatitis B surface antigen (HBsAg) or hepatitis B e antigen (HBeAg) cutoffs at each time point was determined based on patients that achieved response and HBsAg loss at 24 wk post-treatment. Baseline (A and D), week 12 (B and E), week 24 (C and F). HBsAg: Hepatitis B surface antigen; HBeAg: Hepatitis B e antigen.
Similarly, HBeAg levels were classified at each time point[18]: HBeAg < 20 S/CO, 20 ≤ HBeAg ≤ 500 S/CO, and HBeAg > 500 S/CO. When efficacy was evaluated based on the response at EOF, no significant differences were observed between the HBeAg subgroups at baseline, week 12, and week 24. Only 6 (with HBeAg > 500 S/CO at week 12) and 13 (with HBeAg ≥ 20 S/CO at week 24) patients with a poor response (expected response rate ≤ 15.0%) were advised to discontinue PEG-IFNα. After evaluating the HBsAg loss rate at EOF, no significant differences were observed among the HBeAg subgroups at each time point (Supplementary Figure 2D-F).
Performance of single parameters in predicting response at the EOF
Univariate/multivariate analyses of relevant parameters at each time point were performed. Furthermore, the optimal cutoff values at each time point were determined using AUROC and adjusted for clinical practicality (preferably using integers). The two best predictors of response at EOF were HBsAg ≤ 1000 IU/mL and HBeAg ≤ 3 S/CO at baseline, HBsAg ≤ 600 IU/mL and HBeAg ≤ 3 S/CO at week 12, and HBsAg ≤ 300 IU/mL and HBeAg ≤ 2 S/CO at week 24 (Table 2, Supplementary Tables 1-3).
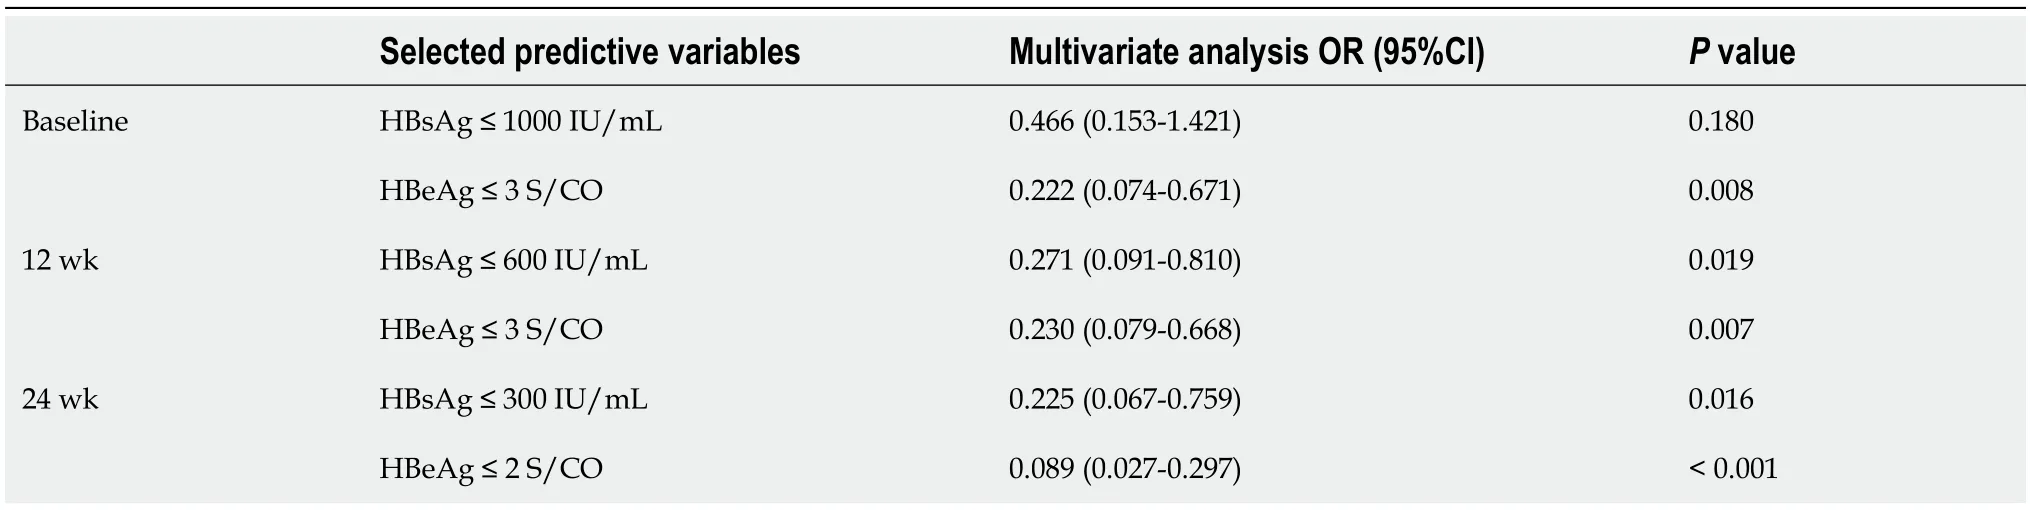
Table 2 Selected variables by multivariate analysis at baseline, week 12, and week 24 to construct predictive models for response at 24 wk post-treatment
When predicting efficacy at EOF using a single parameter at each time point, patients were divided into high-response and low-response groups based on the proportion of HBeAg seroconversion. Only the HBsAg ≤ 300 IU/mL group at week 24 showed no predictive value for HBsAg loss, whereas the predictive power of a single factor was better at other time points (P< 0.05). However, when HBeAg seroconversion at EOF was used as the evaluation criterion, the predictive value of univariate grouping was not satisfactory in most cases (except for the HBeAg subgroup at weeks 12 and 24). The response rate in the low response group ranged between 15.2% and 28.3%; however, the proportion was as high as 57.3% to 70.7% (Figure 2A-C). Among 27 patients who achieved response at EOF, only 44.4%-63.0% (HBsAg subgroup) and 51.9%-74.1% (HBeAg subgroup) were from the high-response group, indicating the limited effectiveness of using a single parameter to predict response (Figure 2D-F).
The HBsAg and HBeAg values at each time point were used to create scatter diagrams. Scatter plots of HBsAg and HBeAg are shown in Supplementary Figure 3A-C. HBsAg plots of responders below the cutoff values (1000 IU/mL at baseline, 600 IU/mL at week 12, and 300 IU/mL at week 24) were 44.4%, 55.6%, and 63.0%, respectively, while nonresponders below the cutoff values were all 20.8% (Supplementary Figure 3A-C). For the HBeAg subgroup, plots of responders below the cutoff values (3 S/CO at baseline, 3 S/CO at week 12, and 2 S/CO at week 24) fluctuated between 51.9%-74.1%, while that of non-responders was between 16.7%-25.0% (Supplementary Figure 3D-F).

Figure 3 Performance of predictive models at baseline, week 12, and week 24 for evaluating hepatitis B e antigen seroconversion (blue bars) and hepatitis B surface antigen loss (pink bars) at 24 wk post-treatment in patients with chronic hepatitis B treated with peginterferon alpha. A: Baseline; B: Week 12; C: Week 24. HBeAg: Hepatitis B e antigen.
Performance of multiple parameters in predicting response at the EOF
At baseline, two independent predictors of response at EOF, HBsAg ≤ 1000 IU/mL and HBeAg ≤ 3 S/CO, were used to construct the prediction model. At baseline, 10 patients (23.8%) scored 0 attained a response, and one (2.4%) achieved HBsAg clearance. Nine patients with a score of 2 (81.8%) experienced a response, and HBsAg loss was achieved in six patients (54.5%) (Figure 3A).
At week 12, two meaningful parameters were HBsAg level ≤ 600 IU/mL and HBeAg level ≤ 3 S/CO. After using the above predictors to establish the model, 15 patients scored 2, with response and HBsAg clearance rates of 80.0% and 40.0%, respectively. Out of 33 patients with a score of 0, HBeAg seroconversion occurred in only five (15.2%) (Figure 3B).
At week 24, the most significant predictive parameters were HBsAg level ≤ 300 IU/mL and HBeAg ≤ 2 S/CO. Using these variables to construct a prediction model, 17 patients scored 2, of whom 14 (82.4%) attained a response, and seven (41.2%) achieved HBsAg seroclearance. Thirty-six patients scored 0, and only four (11.1%) had HBeAg seroconversion (Figure 3C).
RGT strategies
At each time point, a higher score indicated a better curative effect. However, the Kappa consistency analysis of patients scores at each time point revealed a Kappa coefficient between 0.542 and 0.677 after pairwise comparison, suggesting the scores of the same patient at different time points were moderately consistent (Supplementary Tables 4-7).
According to a comprehensive analysis of scores at each time point, the possibility of obtaining a response was very low for patients who scored 0 at any time point, and the possibility of attaining a response decreased with an increase in the number of patients scoring 0. In contrast, among patients who scored 2, the more they frequently scored 2, the higher the response and HBsAg clearance rates. Compared with patients who scored 0 at all three-time points, patients who scored 2 at two or three-time points were significantly more likely to experience HBsAg clearance (Supplementary Figure 4A-D).
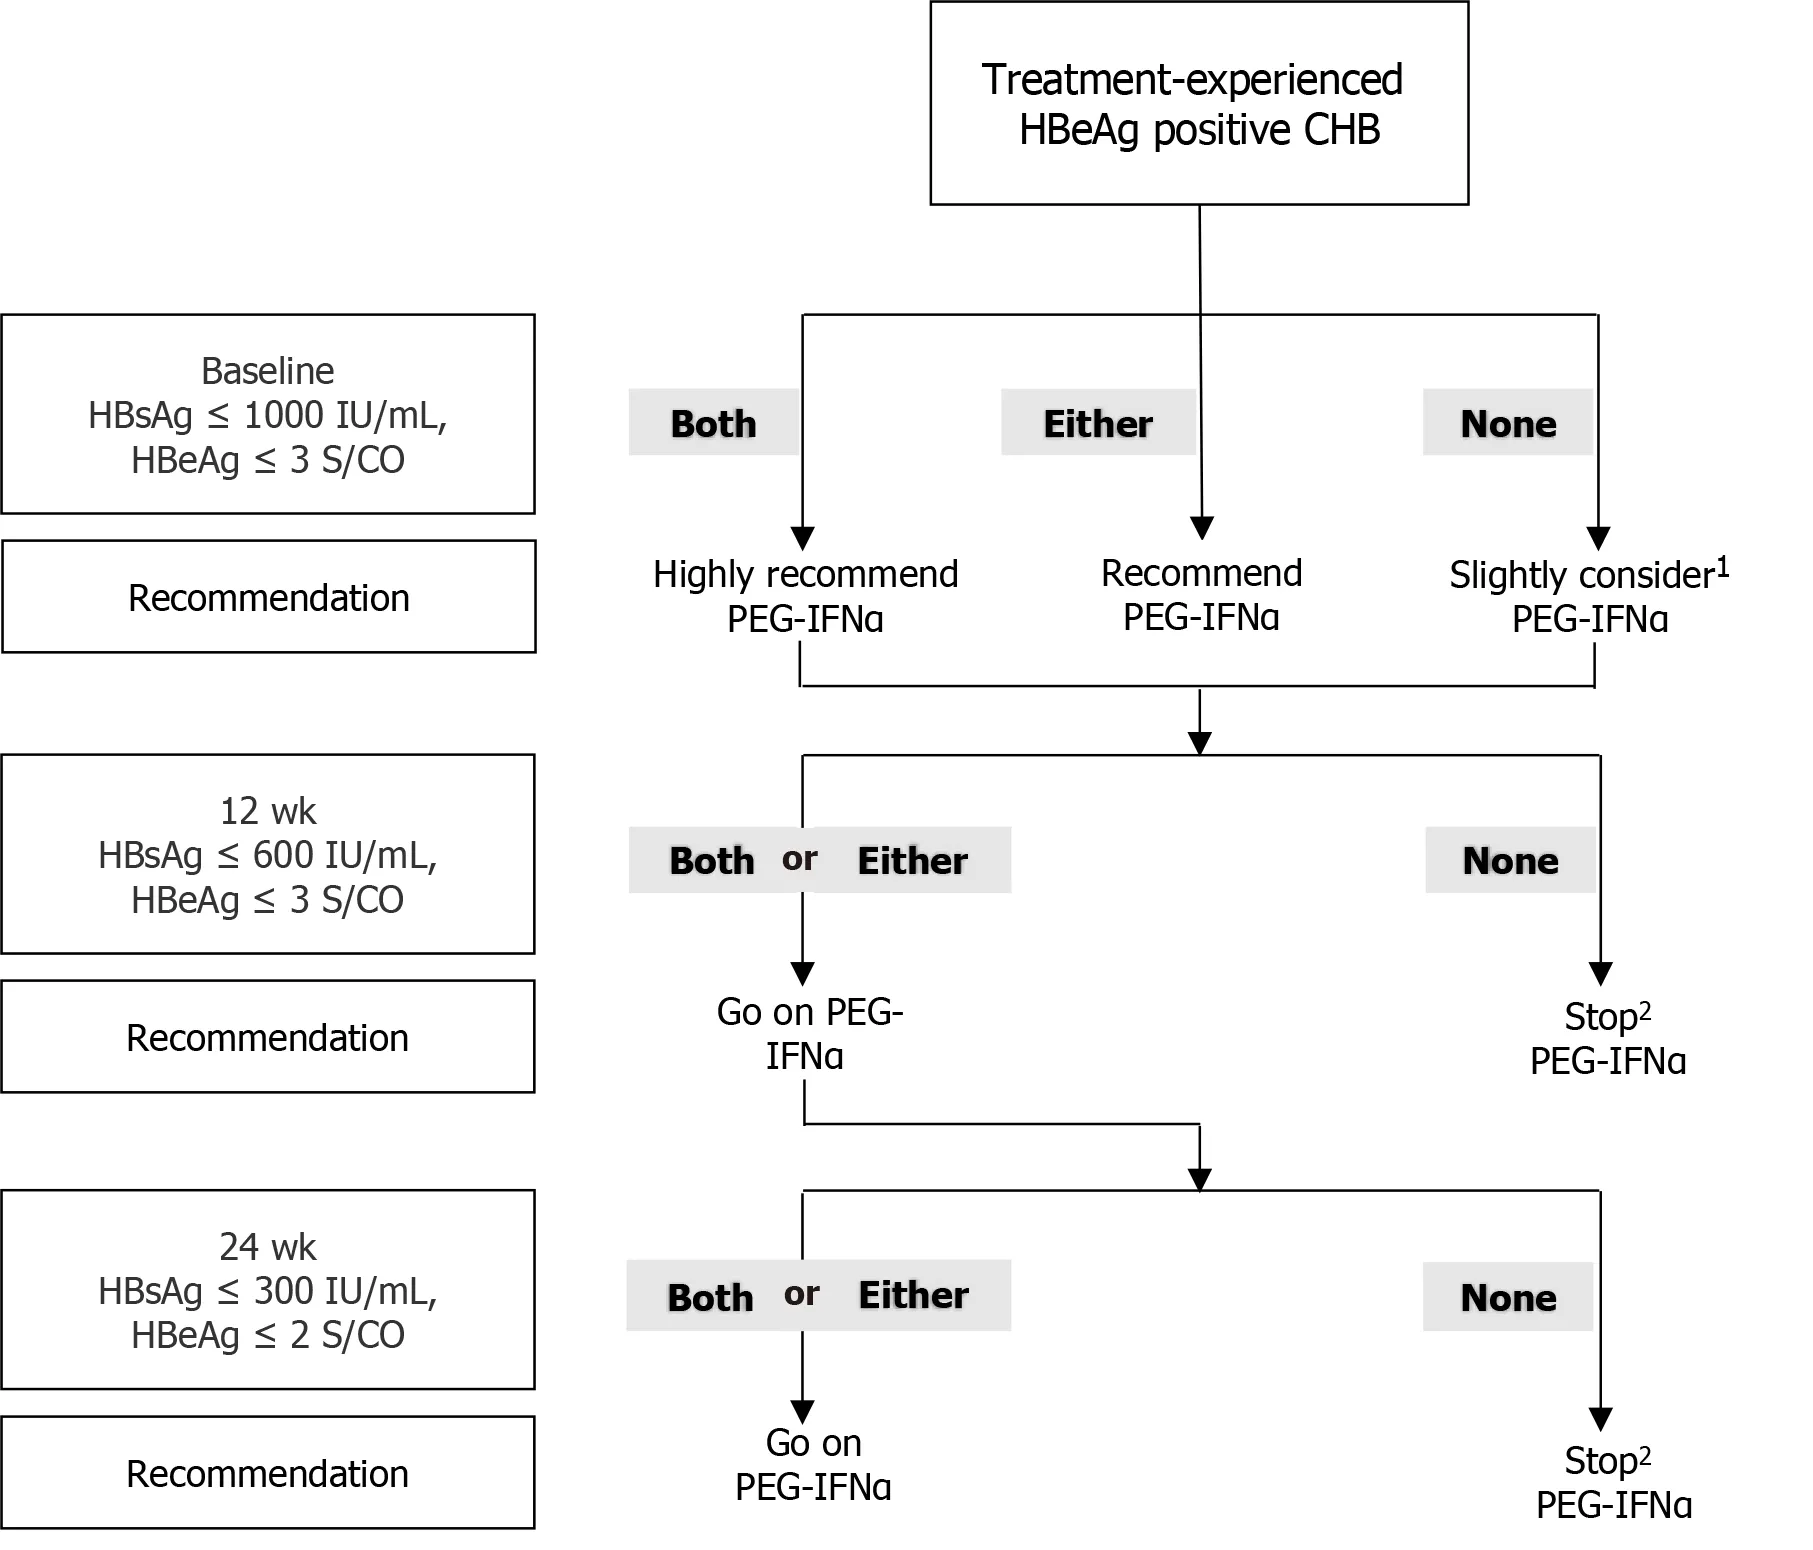
Figure 4 Response-guided therapy strategy for predicting response at 24 wk post-treatment based on hepatitis B surface antigen and hepatitis B e antigen levels at baseline, week 12, and week 24 in the management of previously treated patients with hepatitis B e antigen-positive chronic hepatitis B. 1According to the prediction models, patients who didn’t meet the two cutoffs at baseline had a response of 23.8% at end of follow-up. So we gave a recommendation of slightly considering peginterferon-alfa. 2For patients who didn’t meet corresponding two cutoffs at week 12 or week 24 but met cutoffs at baseline, peginterferon-alfa could be considered because there was a possibility of attaining a response at end of follow-up. CHB: Chronic hepatitis; HBsAg: Hepatitis B surface antigen; HBeAg: Hepatitis B e antigen; PEG-IFNα: Peginterferon-alfa.
Conversely, among patients who scored 0 at baseline, the percentage of attaining a response at EOF was 23.8%, which was obviously higher than that of patients at weeks 12 and 24. The percentage of patients who experienced a response at EOF among patients who scored 0 continued to decrease (15.2%-11.1%) as treatment progressed (Figure 3A-C). Owing to the limited predictive efficacy at baseline, it is crucial to make real-time treatment decisions based on timely clinical indicators.
Based on the optimal cutoff values for HBsAg and HBeAg levels at each time point, an RGT strategy was proposed. At baseline, if the patient’s indicators meet both cutoff values (HBsAg ≤ 1000 IU/mL and HBeAg ≤ 3 S/CO), undergoing PEG-IFNα treatment is highly recommended because the chances of achieving a favorable response are very high. If only one of the criteria is met, PEG-IFNα therapy is recommended. If neither of the above conditions is met, PEG-IFNα treatment can still be considered, as approximately one-fifth of patients may achieve a response at the end of therapy. At week 12, continuing PEG-IFNα treatment is advisable if patients’ parameters meet either one or both cutoffs (HBsAg ≤ 600 IU/mL and HBeAg ≤ 3 S/CO). However, if none of the criteria are met, discontinuing treatment is advisable because the likelihood of achieving a response is low, thereby helping to avoid treatment-related side effects and reducing the financial burden on patients. After 24 wk of therapy, if the patient’s indicators meet either one or both criteria (HBsAg ≤ 300 IU/mL and HBeAg ≤ 2 S/CO), it is recommended to continue and complete the PEG-IFNα treatment. If neither criterion is met, discontinuing PEG-IFNα treatment is advised (Figure 4).
DlSCUSSlON
Achieving a clinical cure for HBeAg-positive patients with CHB previously treated with NAs is unlikely. HBeAg seroconversion can be achieved with PEG-IFNα therapy, thus allowing drug withdrawal. Several large randomized controlled studies aimed at treatment-naïve HBeAg-positive patients with CHB reported HBeAg seroconversion and HBsAg clearance rates of 29.0%-36.7% and 3.0%-7.0%, respectively[9,19,20]. In our study, the HBeAg seroconversion and HBsAg loss rates were 36.0% and 10.7%, respectively. Similar to previous studies, no significant differences were observed in the HBeAg seroconversion and HBsAg loss rates between treatment-naïve and PEG-IFNα-treated patients. Increasing evidence suggests that long-term NA therapy could enhance and promote the immunomodulatory effects of interferon therapy in patients with CHB. Chiet al[21] showed that PEG-IFNα therapy increased the likelihood of HBeAg seroconversion (30%vs7%) in HBeAg-positive patients treated with entecavir (ETV)/tenofovir disoproxil (TDF) for at least 1 year, compared to continuing NAs treatment. A meta-analysis reported that the PEG-IFNα combination strategy in NAstreated patients resulted in higher HBeAg seroconversion (59%vs31%) and HBsAg clearance (9%vs6%) rates than the “de novo” strategy[22]. These findings indicate that the PEG-IFNα treatment strategy remains effective for treated HBeAgpositive patients.
Numerous studies have shown that treatment-naïve HBeAg-positive CHB patients have high levels of ALT, HBV DNA, HBsAg, HBeAg, and anti-HBc at baseline[16,17,23]. When the patients in our study initially chose NAs for antiviral therapy, the above parameters were similarly high. However, after approximately 2 years of antiviral treatment, ALT and HBV DNA reduced to normal levels in most patients. Additionally, HBsAg and HBeAg levels also decreased significantly, although HBeAg remained positive. This aligns with the baseline results of treated patients, as reported in various studies[17,24-26]. In naïve HBeAg-positive patients treated with PEG-IFNα, age, sex, baseline ALT, HBV DNA load, HBsAg, HBeAg, and anti-HBC levels may be closely related to HBeAg seroconversion and/or HBsAg loss at EOF, which can be used as predictors of clinical efficacy[20,23,27]. This study included only 75 patients in the final analysis. The reason for the small sample size was that the number of patients who did not undergo serological conversion after NAs and subsequently switched to PEG-IFN therapy was small in the literature and clinical practice. Since HBeAg seroconversion did not occur after long-term treatment, drug withdrawal was not advisable. To ensure that early drug discontinuation is safe, efforts have been made to switch to or complement PEG-IFNα therapy. For such patients, it is important to identify meaningful factors affecting the response and establish early prediction models for better efficacy at EOF.
Several parameters, including ALT, HBV DNA, HBeAg, HBsAg levels, and the early decline in HBsAg during treatment, have been associated with HBeAg seroconversion after PEG-IFNα treatment in previously treated HBeAgpositive patients[16,17,28]. Liet al[16] demonstrated that HBeAg-positive patients who started PEG-IFNα combination therapy after 2 years of ETV treatment had a higher HBeAg seroconversion rate (64.2%) if their baseline HBeAg was < 200 S/CO. Patients with baseline HBsAg levels < 1000 IU/mL had a higher HBsAg loss rate (31.8%). Liemet al[17] also reported that the response rate was the highest, reaching up to 70%, in HBeAg-positive patients who started combination therapy with PEG-IFNα, with baseline HBsAg levels < 4000 IU/mL and HBV DNA levels < 50 IU/mL. Moreover, the response rate of patients meeting only one of the above criteria was only 44%. Some other factors, such as PEG-IFNα monotherapy or combination therapy with NAs, seem unrelated to treatment efficacy. Our study indicated that the occurrence of response at EOF was not significantly correlated with the treatment regimen, whether it was PEG-IFNα monotherapy, PEG-IFNα + ETV, or PEG-IFNα + TDF. However, a recent meta-analysis indicated that compared to IFN monotherapy, IFN + NAs combination therapy had a higher e-antigen serological response at EOT[29]. These influencing factors may include whether the patient has received prior treatment, viral load, HBsAg levels, HBeAg status, and the degree of liver fibrosis[9,30,31]. These studies suggested that baseline HBsAg or HBeAg levels and on-treatment dynamics could be valuable in predicting response to PEG-IFNα. However, most of these studies employed univariate analyses or only analyzed parameters at baseline.
In this study, HBsAg and/or HBeAg levels and their decline at baseline, week 12, and week 24 were valuable for predicting HBeAg seroconversion and HBsAg clearance at EOF. However, the predictive power of single parameters is extremely limited, with unsatisfactory sensitivity, specificity, as well as positive and negative predictive values. The HBeAg seroconversion rate in the low-response group remained between 20% and 30% at baseline, posing significant challenges for physicians’ and patients’ decision-making. Combining two predictors to establish a prediction model can greatly improve the efficiency and accuracy of the prediction power. Patients who scored 0 at week 12 and week 24 had a response below 15%, while most patients achieved satisfactory outcomes, and HBsAg clearance occurred in patients who scored 2 at each time point.
Sonneveldet al[28] developed a preliminary RGT strategy for PEG-IFN treatment to guide HBeAg-positive patients with CHB according to the different genotypes and HBsAg levels. Patients with the B or C genotype and HBsAg > 20000 IU/mL at week 12 were advised to stop treatment. Similarly, those with HBsAg > 20000 IU/mL at week 24, irrespective of genotype, should stop treatment. Therefore, the decision to continue the original antiviral therapy regimen should be based on the on-treatment response. In this study, the multivariate prediction models based on responses at baseline, week 12, and week 24 had good predictive values. However, the effect of the baseline prediction model alone was limited. The HBeAg seroconversion rates at EOF for patients who scored 0, 1, and 2 at baseline were 23.8%, 36.4%, and 81.8%, respectively. Excluding patients who scored 0 from the PEG-IFNα therapy was difficult. Therefore, adjusting the treatment strategy according to the on-treatment response is necessary.
To facilitate clinical practice, we evaluated the possibility of response at EOF based on HBsAg and HBeAg levels at different time points. Thereafter, we created a strategy map for the RGT approach, providing recommendations on whether to continue or stop PEG-IFNα therapy at each time point (Figure 4). Patients who did not achieve HBeAg seroconversion after NAs therapy and met both HBsAg and HBeAg thresholds at baseline were highly likely to experience HBeAg seroconversion at EOF. Therefore, PEG-IFNα therapy was recommended. However, the likelihood of a response is not high when either of the above thresholds is satisfied. It is recommended that NAs should be continued until appropriate, and PEG-IFNα therapy should not be initiated without the patient’s desire for it. After 12 wk of treatment, PEG-IFNα therapy was recommended to be continued in patients with scores of 1 or 2 and should be stopped in patients that scored 0 unless their baseline score was 2. At week 24, if the patient scored 1 or 2, continuing PEG-IFNα treatment for 52 wk is highly recommended; otherwise, PEG-IFNα treatment should be stopped unless the total score at baseline and week 12 was 2. This RGT strategy can be used to effectively select patients with good outcomes, allowing both doctors and patients to make reasonable decisions.
CONCLUSlON
In summary, our study successfully established predictive models for the response to PEG-IFNα in treatment-experienced patients with HBeAg-positive CHB. The prediction models are simplistic and practical, and the RGT strategy can help optimize the use of PEG-IFNα. However, this study was a single-center exploratory study with a limited sample size, and no genotypes were tested. These results need to be further confirmed by multicenter, large-scale prospective studies.
ARTlCLE HlGHLlGHTS
Research background
Hepatitis B virus (HBV) infection poses a major public health threat worldwide. Recently, many studies on the efficacy of peginterferon-alfa (PEG-IFNα) in treatment-experienced hepatitis B e antigen (HBeAg)-positive chronic hepatitis B (CHB) patients are scarce. Models for predicting HBeAg seroconversion in patients with HBeAg-positive CHB after nucleos(t)ide analog (NAs) treatment are necessary.
Research motivation
In clinical practice, many NAs-treated patients with HBeAg-positive CHB did not attain HBeAg seroconversion, and drug withdrawal is unsafe. Currently, IFN is appropriate for young patients with CHB who desire to end treatment permanently. It is necessary to explore accurate prediction models for the response to PEG-IFNα therapy and viable response-guided therapy (RGT) strategy in patients with HBeAg-positive CHB.
Research objectives
The key significance of this study is to establish a simple scoring model based on a RGT strategy for predicting HBeAg seroconversion and hepatitis B surface antigen (HBsAg) clearance for treatment-experienced patients with HBeAgpositive CHB.
Research methods
In this study, seventy-five treatment-experienced patients with HBeAg-positive CHB underwent a 52-wk PEG-IFNα treatment and a 24-wk follow-up. Logistic regression analysis was used to assess parameters at baseline, week 12, and week 24 to predict HBeAg seroconversion at 24 wk off-treatment. The two best predictors at each time point were applied to establish a prediction model for PEG-IFNα therapy efficacy. Parameters at each time point meeting the corresponding optimal cut-off thresholds were scored as 1 or 0.
Research results
We found that the two most meaningful predictors were HBsAg ≤ 1000 IU/mL and HBeAg ≤ 3 S/CO at baseline, HBsAg ≤ 600 IU/mL and HBeAg ≤ 3 S/CO at week 12, and HBsAg ≤ 300 IU/mL and HBeAg ≤ 2 S/CO at week 24. For a total score of 0vs2 at baseline, week 12, and week 24, the response rates were 23.8%, 15.2%, and 11.1%vs81.8%, 80.0%, and 82.4%, respectively, and the HBsAg clearance rates were 2.4%, 3.0%, and 0.0%,vs54.5%, 40.0%, and 41.2%, respectively.
Research conclusions
We successfully established a predictive model and diagnosis-treatment process based on the RGT strategy to predict HBeAg and HBsAg seroconversion to PEG-IFNα therapy in patients with HBeAg-positive CHB.
Research perspectives
The prediction models established for treatment-experienced patients with HBeAg-positive CHB are simplistic and practical, and the RGT strategy can help to optimize the use of PEG-IFNα. These results need to be further confirmed by multicenter, large-scale prospective studies.
ACKNOWLEDGEMENTS
We extend our gratitude to the entire staff of the Department of Infectious Diseases in the Second Affiliated Hospital of Anhui Medical University, the Anhui Provincial Hospital, the Second People’s Hospital of Fuyang City, and the patients who participated in the study.
FOOTNOTES
Author contributions:Zhang PX and Zheng XW contributed to the data analysis and drafting of the manuscript; Zhang PX, Zheng XW, Zhang YF, Ye J, Li W, Tang QQ, and Zou GZ contributed to the data acquisition; Zhang YF, Zhu J, Zou GZ, and Zhang ZH contributed in the process assessment; Zhang ZH contributed in the study conception and design; and all authors have read and approved the final version of the manuscript.
Supported bythe Anhui Provincial Natural Science Foundation, No. 2108085MH298; the Scientific Research Project of the Second Affiliated Hospital of Anhui Medical University, No. 2019GMFY02 and 2021lcxk027; and the Scientific Research Project of Colleges and Universities in Anhui Province, No. KJ2021A0323.
lnstitutional review board statement:All procedures performed in studies involving human participants were in accordance with the ethical standards of the Ethics Committee (Anhui Medical University No. 2012624) and with the 1975 Helsinki Declaration.
lnformed consent statement:Written informed consent was obtained from all patients.
Conflict-of-interest statement:All the authors report no relevant conflicts of interest for this article.
Data sharing statement:The original anonymous dataset is available on request from the corresponding author at zzh1974cn@163.com.
Open-Access:This article is an open-access article that was selected by an in-house editor and fully peer-reviewed by external reviewers. It is distributed in accordance with the Creative Commons Attribution NonCommercial (CC BY-NC 4.0) license, which permits others to distribute, remix, adapt, build upon this work non-commercially, and license their derivative works on different terms, provided the original work is properly cited and the use is non-commercial. See: https://creativecommons.org/Licenses/by-nc/4.0/
Country/Territory of origin:China
ORClD number:Ya-Fei Zhang 0000-0003-4594-186X; Gui-Zhou Zou 0000-0002-4690-5580; Zhen-Hua Zhang 0000-0002-8480-9004.
S-Editor:Wang JJ
L-Editor:A
P-Editor:Guo X
 World Journal of Hepatology2024年3期
- World Journal of Hepatology的其它文章
- Update in lean metabolic dysfunction-associated steatotic liver disease
- Retrospective study of the incidence, risk factors, treatment outcomes of bacterial infections at uncommon sites in cirrhotic patients
- Palliative long-term abdominal drains vs large volume paracenteses for the management of refractory ascites in end-stage liver disease
- Comprehensive prognostic and immune analysis of sterol Oacyltransferase 1 in patients with hepatocellular carcinoma
- Lean body mass index is a marker of advanced tumor features in patients with hepatocellular carcinoma
- lnfluence of nonalcoholic fatty liver disease on response to antiviral treatment in patients with chronic hepatitis B: A meta-analysis