Prediction and interpretation of photocatalytic NO removal on g-C3N4-based catalysts using machine learning
Jing Li ,Xinyn Liu ,Hong Wng ,Ynjun Sun,* ,Fn Dong,*
a School of Resources and Environment,University of Electronic Science and Technology of China,Chengdu 611731,China
b Research Center for Carbon-Neutral Environmental & Energy Technology,Institute of Fundamental and Frontier Sciences,University of Electronic Science and Technology of China,Chengdu 611731,China
Keywords: Machine learning g-C3N4-based catalysts NO removal Interpretability Catalytic informatics
ABSTRACT Predictive modeling of photocatalytic NO removal is highly desirable for efficient air pollution abatement.However,great challenges remain in precisely predicting photocatalytic performance and understanding interactions of diverse features in the catalytic systems.Herein,a dataset of g-C3N4-based catalysts with 255 data points was collected from peer-reviewed publications and machine learning (ML) model was proposed to predict the NO removal rate.The result shows that the Gradient Boosting Decision Tree(GBDT) demonstrated the greatest prediction accuracy with R2 of 0.999 and 0.907 on the training and test data,respectively.The SHAP value and feature importance analysis revealed that the empirical categories for NO removal rate,in the order of importance,were catalyst characteristics >reaction process >preparation conditions.Moreover,the partial dependence plots broke the ML black box to further quantify the marginal contributions of the input features (e.g.,doping ratio,flow rate,and pore volume) to the model output outcomes.This ML approach presents a pure data-driven,interpretable framework,which provides new insights into the influence of catalyst characteristics,reaction process,and preparation conditions on NO removal.
A positive atmospheric quality is a prerequisite for ensuring human health and society development [1].However,in recent years,fine particulate matter (PM2.5) concentrations that still far exceed the guideline value of the World Health Organization (WHO) and growing ozone (O3) pollution are causing respiratory diseases and ravaging crop growth in many regions of the world [2-4].As a key precursor to the formation of PM2.5and O3,the persistently high concentration of nitrogen oxides (NOx) in the atmosphere induces considerable challenges in solving pollution problems [5].Accordingly,numerous photocatalysts have been developed to achieve efficient purification for the ppb level atmospheric NOx[6].From these works,it has been found that the NO removal rate is dependent on multiple factors,including the catalyst characteristics(e.g.,doping ratio,band gap,and specific surface area),preparation conditions (e.g.,precursor type,calcination temperature,calcination time,and heating rate),and reaction process (e.g.,NO2generation,light intensity,and flow rate).While the catalyst design and experimental condition optimization are rather sophisticated [7-9],the dominant factor affecting the performance of NO removal rate remains ambiguous.More significantly,an optimal and reasonable instruction scheme to achieve the best NO removal is still lacking[6,10].
Accordingly,it is necessary to systematically evaluate the effect of various factors on photocatalytic NO removal rate.An empirical method capable of predicting the photocatalytic NO removal performance is therefore beneficial for determining the optimal catalyst characteristics,preparation conditions,and reaction process.A robust model containing all possible factors can be used to emphasize the relative importance of each factor,which could strengthen the understanding of the catalytic reaction and contribute to the achievement of high photocatalytic NO removal under optimized conditions [11-13].However,to our knowledge,this technique has yet to be developed and utilized on photocatalytic NO removal.Obviously,it is hard to achieve such a goal with sole efforts from experimentation [14].On the other hand,data science and ML have grown tremendously in the past decades and have demonstrated themselves as one of the most powerful strategies in data mining and analysis.The ML method utilizes algorithms to gain knowledge from large,complex and multidimensional data and make fast and accurate predictions [13,15,16].Success has been established in adopting ML methods (e.g.,decision tree and neural network) to predict the NOxremoval efficiency of selective catalytic reduction catalysts and NO decomposition conversions and yields of molecular sieves [17,18].In addition,several studies have developed risk assessment methods for air pollution,using ML models to predict PM2.5based on meteorological conditions and landuse variables [19],as well as fine scale spatiotemporal estimation for ozone concentration prediction [20] and quantitative tracking of SiO2nanoparticles [21].In complex air purification systems,the applied ML model has already demonstrated its capability to evaluate complicated interactions between dependent and independent variables [22].Therefore,we expect it to be also effective in revealing the complex interrelationship between photocatalytic NO removal rate and multiple influencing factors [23,24].
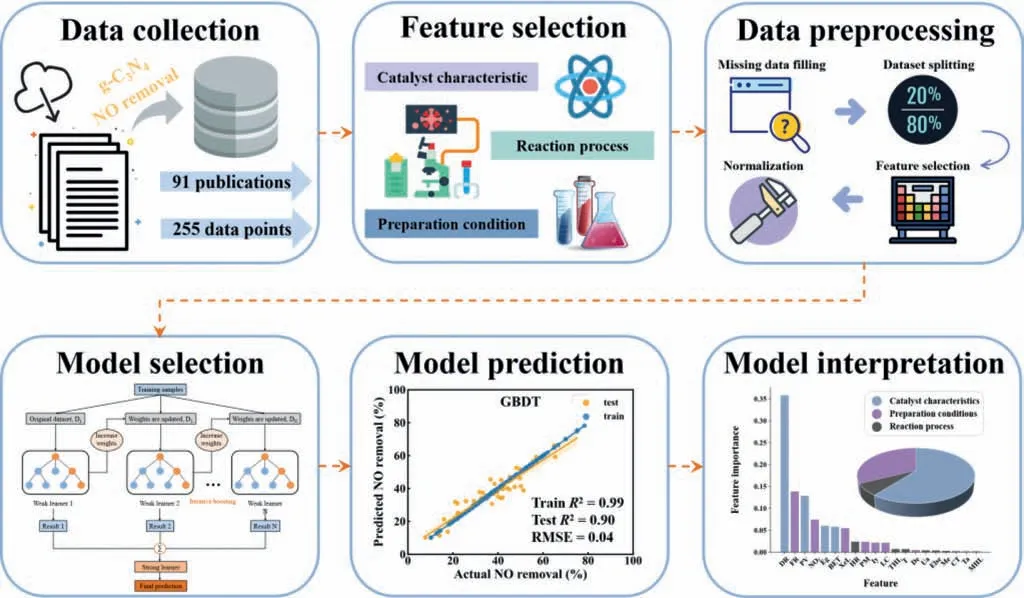
Herein,we proposed a ML model to predict the photocatalytic NO removal rate.g-C3N4-based catalysts were chosen as the model system due to their superior visible photocatalytic performance and wide application.255 data points with 14 input features were focused and the Shapley additive explanation,feature importance,and partial dependence plot were utilized to explore the impact of input features on the target feature (NO removal rate) (Fig.1).Considering the high dimensionality of the data,we developed three tree-based models (Random Forest (RF),Extreme Gradient Boost(XGB) and Gradient Boosting Decision Tree (GBDT)) to predict the photocatalytic purification rate of NO on g-C3N4-based catalysts,achieving high prediction accuracies.Lastly,physical insights could be further extracted to guide the photocatalytic purification of NO.

Fig.1.Scheme of the workflow in this study and the detailed strategies of the machine learning framework to predict and interpret the photocatalytic NO removal rate by g-C3N4-based catalysts.
For data collection,the experimental data on the photocatalytic NO removal by g-C3N4-based catalysts were collected from 91 journal publications with 255 data points in the last decade,52% of which came from our group.For data points that were not directly available,we extracted them from the figures using WebPlotDigitizer software [25].The dataset did not include duplicate experiments to avoid data leakage [11].Based on the study’s openness,transparency and availability,we uploaded the raw data and ML methods on GitHub to make them publicly available to the community (https://github.com/rreality/C3N4_NO_removal.git).
The candidate features in developing the ML models for NO removal rate were categorized as: (i) Catalyst characteristics: doping ratio (wt%),specific surface area (m2/g),pore volume (cm3/g),and band gap (eV).(ii) Preparation conditions: precursors type of g-C3N4(urea,thiourea,dicyandiamide,melamine),precursor masses(g),calcination temperature (°C),calcination time (h),and heating rate (°C/min).(iii) Reaction process: NO2generation (%),lamps(tungsten halogen lamp,Xe lamp,metal halide lamp,else lamp),load of catalyst (g),light intensity (W/m2),and flow rate (L/min).(iv) Target feature: NO removal rate (%).
It should be noted that fluorescence lifetime,catalyst size thickness,and photoluminescence spectroscopy (PL) were also important factors affecting the NO removal rate.However,they are not included in this work due to the limited availability.
Raw data processing: KNN Imputer by Scikit-Learn (an opensource ML library for Python) [26] is a widely used method to fill in missing data.For input features like precursors type of g-C3N4and lamps,which cannot be expressed numerically,we assigned them by one-hot encoding (0 or 1) [27].
Data set splitting: The preprocessed 255 data points were split into training and test sets randomly,with 80% of the total data points in the training set and the remaining 20% in test set.
Feature selection: A high degree of correlation between features can affect model’s robustness and predictive performance.The highly correlated features need to be removed to improve the model’s generalizability [28].
Normalization of Z-score: Normalization is mostly required to remove the effect of quantitative features on different scales.Based on the data structure,we used the Z-score normalization method[26].
According to the report of Yuanetal.[29],when the input feature set is between 5 and 15,the tree-based ML model is more suitable for datasets with 200-1000 data points.which is called a midsize dataset.Our dataset was 14 input features and 255 data points for this work,which can be termed a midsize dataset.Therefore,we focused on three tree-based ML models (Random Forest (RF),XGBoost (XGB),and Gradient Boosting Decision Tree(GBDT)) to analyze and predict the NO removal rate.
Hyperparameter tuning is the process of finding the hyperparameters configuration to achieve optimal performance [30].The grid search method with five-fold cross-validation was used for hyperparameter tuning in this work [31].
Derek Brewer117 considers the oven to be both an ally as a form of destruction and a trap as a symbol of the witch/mother s womb. Consider this provocative118 statement from Brewer: The womb will be a tomb if the growing individual is forced back into it (Brewer 1980).
In this work,the prediction of the NO removal rate was studied as a regression model rather than a classification model.The regression model performance was evaluated byR² (coefficient of determination),RMSE (root-mean-square error),and RE (relative error).Conceptually,higherR²,and lower RMSE and RE represent higher accuracy and better performance of the models [32].The following equations were applied to calculate the model’s performance:
Above,ypiandyairepresent the predicted and the actual values of the NO removal rate,respectively.is the average of NO removal rate of all instances;nandiare the total number of data points and the data point at any given instance.
Post-training model interpretation is a crucial step to examine whether the model predictions are consistent with the generalized experimental results [13].There are convincible strategies(e.g.,Shapley additive explanation,feature importance,and partial dependence plot) to explain black-box models [24].
Shapley additive explanations (SHAP): SHAP is a concept in the field of cooperative game theory that aims to measure the contribution of each player.Lundbergetal.[33] presented SHAP values explaining the model prediction method in their excellent work,which provided a high degree of interpretability to models.The marginal effects of each variable on NO removal rate were evaluated by the SHAP values.
Feature importance: Based on the relative influence of each variable on the ML model,the feature importance can be calculated in the range of 0-100%.A higher feature importance score means that the feature would have a greater impact on the model that is used to predict the output variables [34].
Partial dependence plot (PDP): PDP reveals dependence between the target variable (NO removal rate) and a set of input variables,marginalizing over the values of all other input features.The size of the set of input features is limited to univariate/bivariate due to the visual limitation [35].The dependence relationships of important variables on NO removal rate were further examined by partial dependence plots.
255 data points originated from the published works were systematically collected,which contain the g-C3N4-based catalysts with good or bad performance.First,descriptive analysis in terms of maximum,minimum,mean value,and standard deviation values of input features and target feature (Table S1 in Supporting information) was performed to obtain a preliminary understanding of the raw data [36].
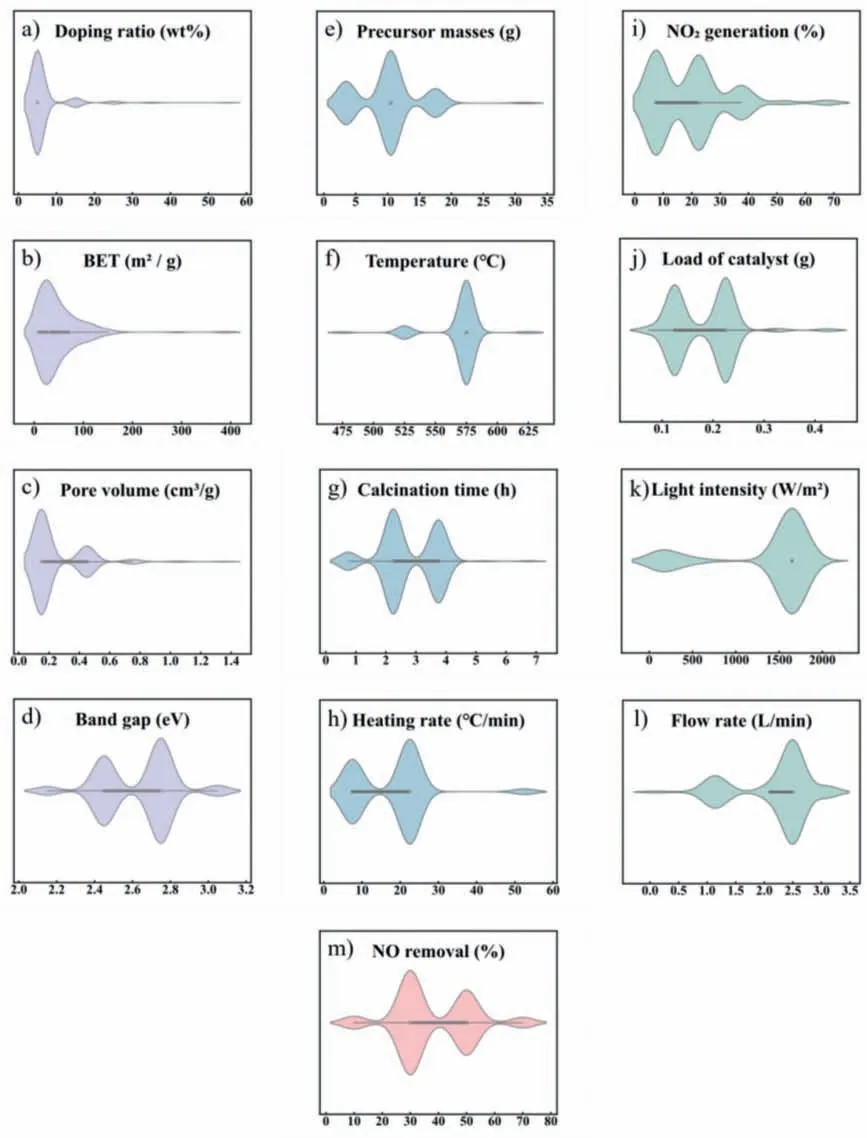
Fig.2 explicitly shows data distributions of input variables and the target variable in the violin plot [32].Noticeably,the doping ratio varied from 0 to 50 wt%,with an average value of 3.2 wt% (Fig.2a).The mean values for microstructural characteristics including specific surface area (BET) and pore volume (PV) were 48.59 m2/g and 0.24 cm3/g (Figs.2b and c),respectively.The mean value of the band gap was 2.62 eV,with a low standard deviation equal to 0.19 eV (Fig.2d).The reported precursor masses varied from 0.5 g to 30 g,with a mean value of 9.8 g (Fig.2e).The calcination process parameters including calcination temperature,calcination time,and heating rate range of 450-600 °C,0-6 h,and 2-52°C/min,respectively (Figs.2f-h).The mean value of NO2generation on the g-C3N4-based catalysts was 20.6% with a standard deviationof 12.1% (Fig.2i).The purification process including load of catalyst,light intensity,and flow rate ranged from 0.05 g to 0.4 g,10 W/m2to 1800 W/m2,and 0.027 L/min to 3 L/min,with the mean value of 0.16 g,1310 W/m2,and 2.1 L/min (Figs.2j-l),respectively.

Fig.2.Distribution of input features related to (a-d) catalyst characteristics (purple),(e-h) preparation conditions (blue),(i-l) reaction process (green),and (m) target variable(pink).Violin plot is a single-axis plot,and the width of each curve corresponds with the approximate frequency of data points in each region.
The reported NO removal rate in the dataset varied from 7.7% to 78.4%,with an average value of 37.8% (Fig.2m).These data points reveal that how catalyst design and operating conditions might affect the purification performance.Notably,the broad distribution of each feature ensured that the model could learn from a variety of data,yielding model with higher robustness [37].
To obtain the best ML model,we trained three models and compared them based onR²,RMSE,and RE values.Fig.3 shows the parity plots of actual and predicted values of the NO removal rate on the g-C3N4-based catalysts.The regression models all exhibit good predictive performance (R² ≥0.85),which may be attributed to the availability and quality of the input data.For all three models,RF (Fig.3a),XGB (Fig.3b),and GBDT (Fig.3c),the deviations between predicted and actual values were relatively small.As shown in Fig.3,GBDT significantly outperformed RF and XGB in terms of prediction accuracy.The fit of the RF,XGB and GBDT models on the training data was 0.966,0.998 and 0.999,expressed inR².TheR² were 0.885 (RF),0.864 (XGB),and 0.907 (GBDT) for the test data,respectively.In addition,the RMSE and RE for RF on the test set were 0.048 and 0.130,as well as for XGB were 0.052 and 0.131,respectively.The GBDT showed the lowest RMSE (0.043)and RE (0.110) values compared to RF and XGB,which further indicates that GBDT has better prediction performance (Table 1).

Table 1Comparative evaluation of three tree-based ML models using the data set.

Fig.3.Predicted NO removal rate vs actual values with (a) RF,(b) XGB,and (c) GBDT.The three models showed that tree-based models had good prediction performance on the training and test data set.The orange shades represent 95% confidence intervals of the regression line on the test points.
As a result,the GBDT model shows superior predictive power for different experimental conditions on g-C3N4-based catalysts,thus the GBDT model was selected as the optimal model in this work.The high-quality prediction made by the GBDT model paves the way for interpreting the modeling results further.
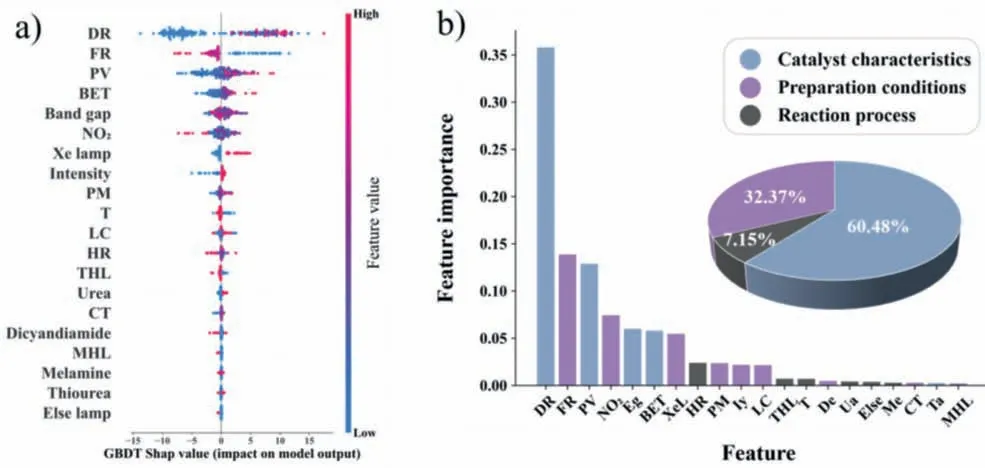
Based on the GBDT model,we applied the SHAP value,feature importance,and PDP to determine the influence of the input variables,including catalyst characteristics,preparation conditions,and reaction process on the NO removal rate.Combining the SHAP value and feature importance,as shown in Fig.4,the most important variables for predicting the NO removal rate can be revealed as doping ratio,flow rate,and pore volume,which are listed in a sequentially decreasing order.Except for the top three important features,the ranking of importance for the rest features showed slight differences between the SHAP value (Fig.4a) and feature importance (Fig.4b).Noticeably,precursors type of g-C3N4feature assigned by the one-hot encoding,SHAP values presented in descending order of importance were urea (Ua),dicyandiamide(De),melamine (Me),and thiourea (Ta),while the feature importance was in the order of De,Ua,Me,and Ta.However,the feature importance score of dicyandiamide was 0.0047,while that of urea was 0.0042,thus their difference was negligible (Table S2 in Supporting information).Dong [38] and Liuetal.[39] consistently indicated that urea-derived g-C3N4plays an essential role in enhancing photocatalytic performance because of the abundant mesopores and large specific surface area,which facilitates the adsorption of reactants and diffusion of products [40].The result shows that urea and dicyandiamide as precursors of g-C3N4can be selected preferentially.The remaining important features would be discussed and analyzed in later sections.

Fig.4.(a) Shapley additive explanation method.Each dot represents an instance,the color represents the feature value and the X-axis position (SHAP value) represents the expected change in the predicted NO removal rate compared to the prediction when the feature took some baseline value.(b) Feature importance of each influential factor on the NO removal rate.Pie chart representing the average of the contributions for each of the feature classes (catalyst characteristics,preparation conditions,and reaction process) toward the target prediction.Note: DR.doping ratio (wt%),FL: flow rate (L/min),PV: pore volume (cm3/g),NO2: NO2 generation (%),Eg: band gap (eV),BET: specific surface area (m2/g),XeL: Xe lamp,HR: heating rate (°C/min),PM: precursor masses (g),Iy: intensity (W/m2),LC: load of catalyst (g),THL: tungsten halogen lamp,T: calcination temperature (°C),De: dicyandiamide,Ua: urea,Else: else lamp,Me: melamine,CT: calcination time (h),Ta: thiourea,and MHL: metal halide lamp.
Grouping the features into a few categories,we found that "catalyst characteristics" is the most important category for NO removal,which accounted for 60.48% of the total importance.The sub-important strategies were "reaction process" and "preparation conditions",respectively (Fig.4b).Thus,the combination of SHAP value and feature importance indicated that the priority of g-C3N4-based catalysts to achieve efficient NO removal may be: catalyst characteristics>reaction process>preparation conditions.
Based on the feature importance score (Table S2),the univariate partial dependence plots of the nine input features were presented to further analyze how the important input features exactly affect the removal of NO.
As shown in Fig.5a,elemental doping can facilitate NO removal.Specifically,the promotion effect of the doping ratio is significant in the range from 0 to 4 wt%,with little contribution to the NO removal rate when the doping ratio is higher than 4 wt%.Fe could be doped into g-C3N4through the coordination between amidogen and Fe,and the NO removal performance improved with the increase of Fe doping in 0 × 0.5 wt% but showed a decreasing trend after exceeding 0.5 wt% [41].Fe doping could improve the transfer of photogenerated electrons and enhance the photocatalytic redox performance of g-C3N4.However,excessive Fe doping leads to the occupation of the adsorption sites of NO on the g-C3N4surface,which would reduce the performance of g-C3N4photocatalytic NO removal [42].Typically,appropriate doping of elements could modify the energy band structure and promote charge separation [43,44].In response,as can be seen from Fig.5b,when the band gap of pure g-C3N4(2.7 eV) is regulated to about 2.6 and 2.8 eV,the NO removal rate presents significant improvement.The narrowed band gap (about 2.6 eV) broadens the response range of light and enhances the absorption capacity of visible light,while the widened band gap (about 2.8 eV) holds the valence band or conduction band with stronger oxidation or reduction ability [7,45,46].Both of the above could enhance the generation of reactive oxygen species (ROS),such as·OH and·O2-,to promote efficient NO removal [44,47].It is also worth mentioning that band gap which is too narrow would lead to carrier recombination,whereas the one that is too wide would reduce the light absorption efficiency [42].Additionally,the removal of NO increases with the enhancement of BET and PV (Figs.5c and d),which is attributed to the increased amount of active sites provided by larger microstructure [44,48].

Fig.5.(a-i) Plots of univariate partial dependence of NO removal rate on important variables.
Notably,the catalytic properties of g-C3N4are also governed by synthesis process,such as calcination temperature and heating rate parameters [49,50].The NO removal rate could be effectively improved by increasing calcination temperature to 520°C (Fig.5e).However,further increasing temperature to 550°C did not significantly improve the NO removal rate.Lietal.[51] showed that urea was not completely decomposed at the calcination temperature below 500 °C,and the g-C3N4phase appeared at 500°C.At calcination temperatures above 600°C,urea decomposed completely and g-C3N4volatilized completely.The PDP mean line was relatively higher than the average of NO removal rate over the heating rate range of 5.0-15.0°C/min,which means the contribution of the heating rate is significant in the range from 5.0 °C/min to 15.0 °C/min (Fig.5f).The slow heating rate (about 2 °C/min) favors the formation of g-C3N4with a compact structure,complete lamellae,narrow crystalline spacing,and a good polymerization effect [52].The rapid heating rate (about 15 °C/min) enables the formation of g-C3N4with a porous structure,high specific surface area,complete CN skeleton,and more amino groups.The presence of loosely packed lightweight flakes results in a better crystal structure,which improves the adsorption and photocatalytic activity [42,52].
For an optimal photocatalyst,the proper reaction conditions are also crucial to enable efficient catalytic performance.It is commonly overlooked that the gas flow rate is a key factor affecting NO removal.As illustrated in Fig.5g,the optimal gas flow rate for NO removal rate is below 1.0 L/min,as lower gas flow rate helps prolong the NO’s duration on the catalyst surface.Fig.5h displays an optimal light intensity of 1200 W/m² for the maximum NO removal rate,after which no significant increase for NO removal is observed.Therefore,the gas flow rate of 1.0 L/min and the light intensity of 1200 W/m² is sufficient for the ideal performance of the optimal photocatalyst.Especially,the generation of NO2[53],a toxic by-product,fluctuated on the NO removal rate (Fig.5i).The result shows that NO removal rate hardly affects NO2production.The high NO removal rate may come from the increased selectivity of NO to NO2,which is detrimental to the ecological environment.Therefore,researchers should not only focus on the NO removal rate but also reduce the generation of NO2toxic by-products and enhance green product selectivity.
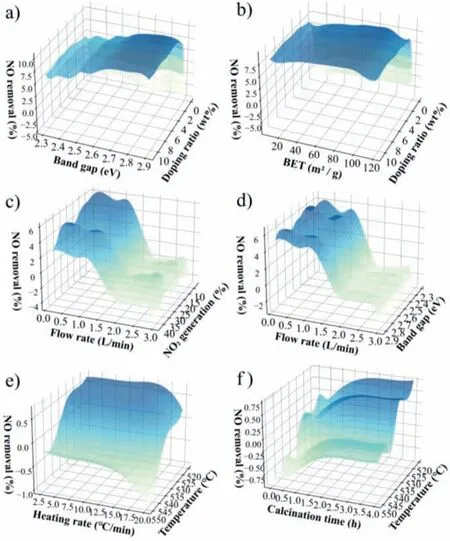
To thoroughly investigate the co-effect of catalyst characteristics,preparation conditions,and reaction process on NO removal rate,the bivariate dependency plots were shown in Fig.6.Since the BET was linearly correlated with PV in this dataset,the BET was used for bivariate PDP.Bivariate PDP analysis of NO removal on the doping ratio (the most critical factors) and band gap and BET was attempted (Figs.6a and b).It can be seen that,compared to undoped catalysts,the dependence of NO removal rate is stronger on the catalyst characteristics (band gap and BET) for the doped catalysts.This suggested that the NO removal may be influenced by regulating the band structure and increasing the active site of catalysts due to the interactions between elemental doping and catalyst characteristics (band gap and BET) [54-56].

Fig.6.(a-f) Plots of bivariate partial dependence of NO removal rate on any two important input variables and the interactions between the two variables.
It could be observed that the dependence of the NO2generation and band gap on NO removal decreased with the increase in the flow rate (Figs.6c and d).The fast gas flow rate and the short residence time in the reactor may seriously inhibit the adsorption and reaction of NO on the catalyst surface,leading to the reduction of photocatalytic efficiency [42,57].The dependence variation of NO removal on the NO2generation and band gap was more evident at low flow rate,corroborating the critical role of the low flow(<1.0 L/min) rate,which was consistent with the existing conclusion in Fig.5g.Therefore,the flow rate of 1.0 L/min was efficient for improving the NO removal of g-C3N4-based catalysts (Figs.6c and d).
The photocatalytic performance of g-C3N4-based catalysts are closely connected with the preparation conditions [42,44,58].Fig.6e shows the synergistic effects of calcination temperature and heating rate on the NO removal.The dependence of the NO removal on the heating rate is decreased with the increase of calcination temperatures.With the increase of calcination temperature,the g-C3N4structure may be distorted resulting inn-π*transitions[59].In addition,the higher calcination temperatures may cause the decomposition of g-C3N4[60].Notably,the bivariate PDP (Fig.6e) combined with univariate (Figs.5e and f) indicated that calcination temperatures of 520 °C and heating rate of 15 °C/min could achieve excellent photocatalyst for ideal performance.
The interaction between calcination temperature and calcination time was displayed in Fig.6f.The effects of calcination temperature on NO removal rate are more independent than calcination time at high calcination temperature (about 550 °C),and the dependence on calcination time becomes significant at lower calcination temperature (about 520 °C).In general,the intact g-C3N4framework is not obtained due to insufficient calcination,leading to a lower specific surface area,which affects the adsorption of the catalyst [52].
Overall,post-training analysis of the model contributes to better understanding on the interactions between catalyst characteristics,preparation conditions,and reaction process,which could efficiently facilitate the catalyst design and process optimization for NO removal.
In this work,we established a data-driven,interpretable ML framework to predict NO removal rate on g-C3N4-based catalysts.In contrast to traditional trial-and-error-based approaches,the insights obtained through the proposed model could offer further guidelines for designing the appropriate experimental schemes and selecting better catalysts for NO removal treatment.Overall,the above models showed the great predictive potential of ML-based approaches,where more accurate NO removal prediction might be realized with more available data.For instance,fluorescence lifetime,catalyst size thickness,PL and the data from densityfunctional theory (DFT) calculations can be regarded as additional input features for the NO removal models,which can help us further unveil the microscopic adsorption/desorption influences.
Acknowledgments
This work was supported by the National Natural Science Foundation of China (Nos.22172019,22225606,22176029) and Excellent Youth Foundation of Sichuan Scientific Committee Grant in China (No.2021JDJQ0006).
Supplementary materials
Supplementary material associated with this article can be found,in the online version,at doi:10.1016/j.cclet.2023.108596.
 Chinese Chemical Letters2024年2期
- Chinese Chemical Letters的其它文章
- The 3rd Xihua Chemistry and Biomedicine Forum
- Professor Hualiang Jiang: A tribute to an esteemed visionary chemist and pharmacist
- Recent advances in visible light-mediated chemical transformations of enaminones
- Development of porphyrin-based fluorescent sensors and sensor arrays for saccharide recognition
- Recent advances of versatile reagents as controllable building blocks in organic synthesis
- Synthetic host-guest pairs as novel bioorthogonal tools for pre-targeting☆
