Impact of effective stress on permeability for carbonate fractured-vuggy rocks
Ke Sun,Huiqing Liu,Julin Y.Leung,Jing Wng,Yin Feng,Renjie Liu,Zhijing Kng,Yun Zhng
a State Key Laboratory of Petroleum Resources and Prospecting, China University of Petroleum, Beijing,102249, China
b School of Mining &Petroleum Engineering, University of Alberta, Edmonton, T6G 1H9, Canada
c SINOPEC Petroleum Exploration and Production Research Institute, Beijing,100083, China
Keywords: Effective stress Permeability Carbonate fractured-vuggy rocks Structure characteristics Stress sensitivity
ABSTRACT To gain insight into the flow mechanisms and stress sensitivity for fractured-vuggy reservoirs,several core models with different structural characteristics were designed and fabricated to investigate the impact of effective stress on permeability for carbonate fractured-vuggy rocks (CFVR).It shows that the permeability performance curves under different pore and confining pressures (i.e.altered stress conditions) for the fractured core models and the vuggy core models have similar change patterns.The ranges of permeability variation are significantly wider at high pore pressures,indicating that permeability reduction is the most significant during the early stage of development for fractured-vuggy reservoirs.Since each obtained effective stress coefficient for permeability (ESCP) varies with the changes in confining pressure and pore pressure,the effective stresses for permeability of four representative CFVR show obvious nonlinear characteristics,and the variation ranges of ESCP are all between 0 and 1.Meanwhile,a comprehensive ESCP mathematical model considering triple media,including matrix pores,fractures,and dissolved vugs,was proposed.It is proved theoretically that the ESCP of CFVR generally varies between 0 and 1.Additionally,the regression results showed that the power model ranked highest among the four empirical models mainly applied in stress sensitivity characterization,followed by the logarithmic model,exponential model,and binomial model.The concept of “permeability decline rate” was introduced to better evaluate the stress sensitivity performance for CFVR,in which the one-fracture rock is the strongest,followed by the fracture-vug rock and two-horizontalfracture rock;the through-hole rock is the weakest.In general,this study provides a theoretical basis to guide the design of development and adjustment programs for carbonate fractured-vuggy reservoirs.
1.Introduction
Statistical results show that at least 60%of the global oil and gas resources are distributed in carbonate reservoirs (Schlumberger,2007;Wei et al.,2017;Alzayer and Sohrabi,2018;Yousufi et al.,2019;Sun et al.,2022),two-thirds belonging to the type of fractured-vuggy reservoirs (Guo et al.,2022).Different from conventional porous formations (Anselmetti and Eberli,1993;Lucia,1995;Durrani et al.,2021),fractured-vuggy formations tend to have multiscale storage and flow space for hydrocarbons,mainly including matrix pores,dissolved vugs,karst caves,and natural fractures with different development degrees(Camacho-Velázquez et al.,2005;Tian et al.,2019a,2019b;Sun et al.,2021).Due to the extreme heterogeneity and complex flow environment of this kind of carbonate formation,it is a challenge to develop fractured-vuggy reservoirs efficiently (Tian et al.,2016;Bagni et al.,2022;Martyushev et al.,2022).In order to reveal the flow mechanisms of such reservoirs for field development practices,investigation of the effective stress law for permeability of carbonate fractured-vuggy rocks (CFVR),is needed.The CFVR can further be used to analyse the stress sensitivity performance in the process of liquid production(Zhang et al.,2016;Martyushev,2020;Khuzin et al.,2021;Han et al.,2022;Zhukov and Kuzmin,2021,2022).
Terzaghi (1923) first introduced the concept of effective stressin experimental studies of geotechnics
For the porous media,the physical properties of underground rocks are very different from those of soils,and some scholars have reported that the classical Terzaghi model cannot be used to calculate the effective stress in subsurface rocks (Warplnski and Teufel,1992;Li and Xiao,2008).In other words,the Terzaghi model is only applicable to extremely loose porous media,but not tight rocks.Thus,Biot (1941) proposed a widely used correction model for effective stress(Nur and Byerlee,1971):
where α is the Biot coefficient,which can be calculated by
wherecbandcsare the compressibility of the rock volume and skeletal particles (MPa-1),respectively.
From Eq.(3),it can be found that the Biot coefficient should always be less than 1.The looser the rock structure(the closer it is to the soil status),the closer its value to 1.The Biot coefficient has no practical physical meaning,and in most cases,it needs to be determined experimentally or selected empirically.Due to the uncertainty of the experimental processes,the distribution range of tested α is not exactly between 0 and 1,and there are extreme cases where the α value is less than 0 or greater than 1,indicating that experimental errors are difficult to overcome.In fact,in addition to external factors such as effective stress magnitude,experimental loading rate,and test scheme,the internal factors such as types of the fluids used,porosity,and composition of the rock sample can affect the test results to some extent(Cheng et al.,2015).Generally,the Biot coefficient decreases with increasing effective stress,decreasing porosity,and increasing cementation (Ma,2008).
Robin (1973) suggested that some physical property (Q) of a porous solid such as density,length,seismic velocity,porosity,or permeability is a function of the confining pressure and pore pressure:
whereQis the physical property of a porous solid;pcandppare the confining pressure and pore pressure (MPa),respectively.
Concerning rock permeability,Bernabe (1986) gave an expression for the relationship between permeability,effective stress,and confining pressure,pore pressure:
Once the ESCP (k) is determined,the effective stress can be obtained for different confining pressure and pore pressure conditions.Based on Eq.(5),the definition expression of ESCP is given by(Bernabe,1986):
whereKis the rock permeability (mD).
From Eq.(7),it is easy to see that if the rock permeability is more sensitive to the change of confining pressure,then k<1;if the rock permeability is more sensitive to the change of pore pressure,then k>1.In particular,for the classical Terzaghi model,according to Eq.(1),it yields:
where σnetis the net stress(MPa).
As Eq.(8) shows,many engineers directly applied the Terzaghi model to treat the net stress(the difference between the confining pressure and pore pressure)as the effective stress in field practices for convenience purpose.The value of ESCP is thus generally considered to be constant at 1 (Martyushev et al.,2019).Actually,many theoretical and experimental explorations regarding the value magnitude and variation range of ESCP have been reported in literature (e.g.Zoback and Byerlee,1975;Nur et al.,1980;Walsh,1981;Bernabe,1986;Berryman,1992;Kwon et al.,2001;Al-Wardy and Zimmerman,2004;Ghabezloo et al.,2009;Heller et al.,2014;Li et al.,2014).The results showed that different rocks would have varying ESCP values under different confining and pore pressures,and both the magnitude and range of ESCP obtained from different studies varied significantly.Zhao et al.(2011) pointed out that the ESCP could be affected by clay mineralogy,and the values of ESCP for clay-rich sandstones are always greater than 1.Li et al.(2014) studied a set of 26 sandstone cores from various hydrocarbon reservoirs in China and found that the ESCP values vary significantly from sample to sample,sometimes even reaching theoretically impossible values(i.e.,greater than 1 or lower than porosity).It is clear that the true ESCP values for most of the rocks are not always equal to 1 and may even deviate substantially from 1 (Li et al.,2009a;Han et al.,2022).Therefore,in most cases,net stress cannot be used in place of effective stress.
Up to now,few related studies have reported on ESCP features for different CFVR.Furthermore,the impact of effective stress on permeability for CFVR is still not clear.In this paper,several core models with different structural characteristics were first designed and fabricated.The permeability performance under altered stresses for the eight core models with different fractures,fracture roughnesses,and vug types was compared and discussed using the experimental data.After that,four representative core models were selected to determine the ESCP values based on the response surface method(RSM)and analyse the distribution differences of their ESCP surfaces.Calculation results showed that consideration of effective stress and permeability after RSM correction was superior to the classical Terzaghi model.Meanwhile,a mathematical ESCP model was proposed for CFVR.The model integrates the triple mediums,including matrix pores,fractures,and dissolved vugs.Furthermore,the adaptability of four empirical models mainly used for stress sensitivity characterization to CFVR was discussed,and the concept of“permeability decline rate”was introduced to better evaluate the stress sensitivity performance.This study aims to provide a theoretical basis to further guide the design of development and adjustment programs for carbonate fractured-vuggy reservoirs.
2.Experimental section
To determine the effective stress of a carbonate fractured-vuggy rock,the absolute permeability of the core sample under different stress conditions should firstly be tested using two load methods:(i) constant confining pressure and cyclic pore pressure;and (ii)constant pore pressure and cyclic confining pressure.Based on the obtained experimental data,the ESCP for the core sample can be obtained by different calculation methods,including(i)differential method(Kranzz et al.,1979;Bernabe,1986),(ii)translation method(Al-Wardy and Zimmerman,2004),(iii) cross-plotting method(Walsh,1981;Bernabe,1986),and (iv) response surface method(Warplnski and Teufel,1992;Li et al.,2009a;Han et al.,2022).Finally,the ESCP value would be input in Eq.(6) to calculate the corresponding effective stress for permeability under different confining and pore pressure conditions.In this section,some details related to the effective stress experiments were introduced,including the selected rocks,used fluid,designed fractured-vuggy core models,experimental setups,and performing procedures.
2.1.Experimental materials
2.1.1.Rock samples
More than 20 standard core samples,with length and diameter of 50 mm and 25 mm,respectively,were cut and processed from the carbonate outcrop in the target block of the Tarim Basin,China.The physical parameters of eight cores were tested by AP 608 porosimeter and other related instruments,and the results are shown in Table 1.The test results show that the porosity of this batch of rock samples is generally less than 3%,and the gas permeability is also extremely low;all of them are less than 0.02 mD,and some of them are even less than 0.01 mD.

Table 1 Physical parameters of eight core samples from the carbonate outcrop in the target block.
According to the Chinese national standards GB/T 29172-2012(2012) and GB/T 29171-2012 (2012),three core samples were selected for capillary pressure curve testing using Corelab CMS 300 and Micromeritics AutoPore IV-9505 Mercury Intrusion Porosimeter,as presented in Fig.1.For the three carbonate samples,it is found that the average threshold pressure is 1.595 MPa,the average maximum mercury saturation is 73.828%,and the average porethroat radius is 0.126 μm,respectively.Additionally,the average sorting coefficient and uniformity coefficient are 2.468 and 0.266,respectively,indicating that the pore-throat distributions for this batch of carbonate samples are not uniform and the particle sorting is relatively poor.The characteristic structure coefficient can reflect both the degree of pore-throat sorting and the connectivity of the rock medium.The average value for the three rock samples is 0.015,indicating that the rock samples have extremely poor pore structures.In carbonate fractured-vuggy reservoirs,fluid flow mainly relies on dissolved vugs,karst caves,fractures,and fracture networks,etc.In contrast,the permeability of the matrix part is extremely low,so the matrix pores are generally considered to have no flow capacity in the fractured-vuggy systems in actual development processes.
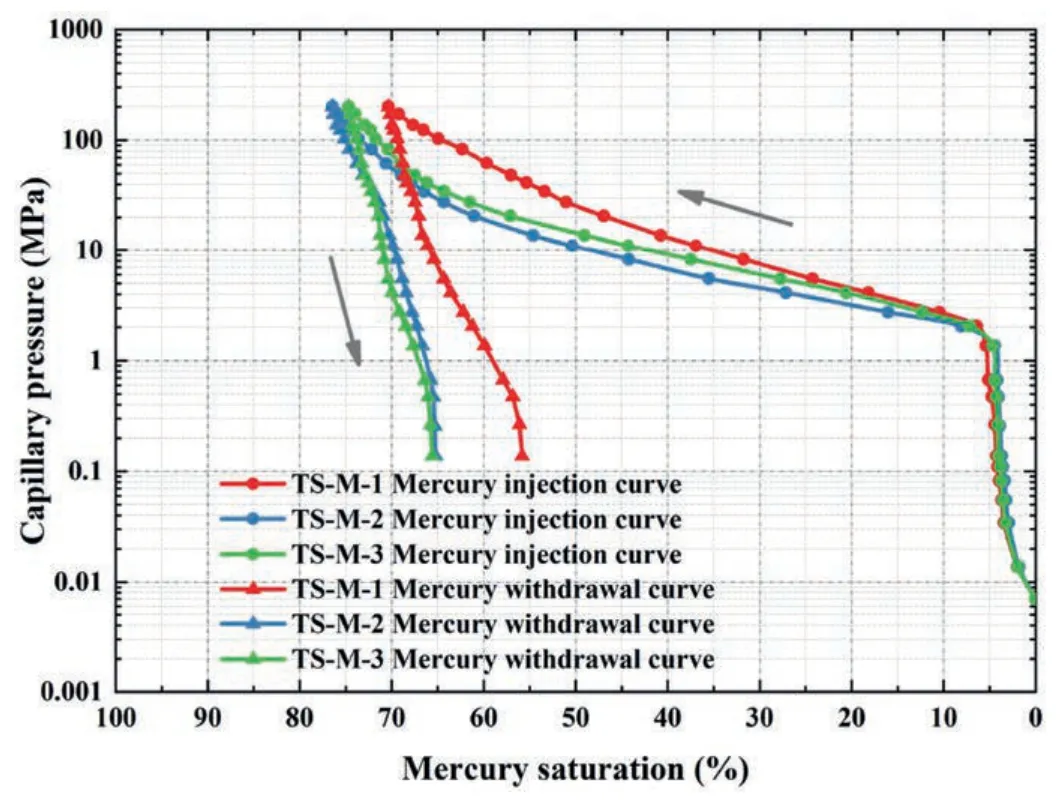
Fig.1.Capillary pressure curves for three carbonate core samples.
2.1.2.Testfluid
The effective stress experiments were conducted by the liquid measurement method.The simulated oil was selected as the onlytest fluid to prevent the small amount of clayey mineral in the rock samples from swelling with water,which would affect the accuracy of permeability determination.Since the fluid properties of the White Oil-#15 are very similar to those of the target reservoir in the Tarim Basin,it is used as the simulated oil in the experiment.The White Oil-#15 is a colourless,odourless,and non-fluorescent transparent liquid at room temperature (20°C) and pressure,with a density of 835.1 kg/m3at 20°C and a kinematic viscosity of 15.0 mm2/s at 40°C.In addition,the viscosity-temperature curve of the White Oil-#15 was also obtained using Anton Paar C-ETD 300/PR 1000 Rheometer,as shown in Fig.2.The viscosity-temperature curve indicates that when the temperature reaches 100°C,the dynamic viscosity for the simulated oil is 2.53 mPa s.
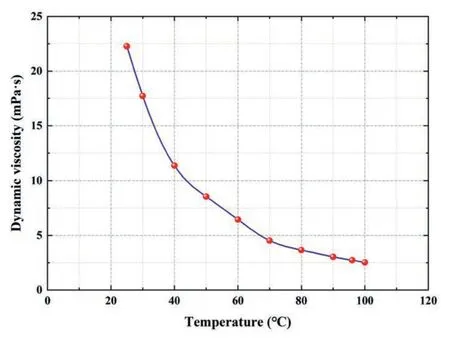
Fig.2.Viscosity-temperature curve of the White Oil-#15.
2.2.Design of fractured-vuggy core models
The actual fractured-vuggy reservoirs contain numerous fractures and vugs with different scales,geometries,and spreading patterns,and it is quite difficult to conduct coring operations and obtain the actual complete cores without any damage.In addition,the shapes of real and simulated fractures and vugs in each core may differ,which results in the findings that are only applicable to specific rock types and not broadly representative in a global sense.Therefore,we decided to design and fabricate a series of carbonate fractured-vuggy rocks with some general and representative structure characteristics to perform the tests.
To investigate the impact of effective stress on permeability for different types of CFVR,eight experimental core models with varying structural characteristics were designed and fabricated based on the obtained standard core samples.These eight core models can be classified into three groups according to their fracture development,fracture roughness,and vug type.The following describes the construction and making process of the three characteristic groups of fractured-vuggy core models.
2.2.1.Core models with different fracture development
In general,fracture development is mainly reflected by the number of fractures,spreading patterns,and developing scales(Liu et al.,2022).To investigate the impact of fracture development,four core models were constructed,including one-fracture core model,two-horizontal-fracture core model,two-vertical-fracture core model,and fracture network core model.According to the designed dimensions as shown in Fig.3,the carbonate rock samples are first cut by a wire-cutting machine.Then,all contact surfaces of the cut parts are polished with abrasive papers with a series of mesh numbers,ensuring that each contact surface has the same wall roughness.Before conducting tests,high-temperature resistant AB glue was used to make each cut wall surface bonded and fixed in the point-contact form to minimize the influence of the gluing point on experimental tests.The design schematics and photos of these core models are shown in Fig.3.
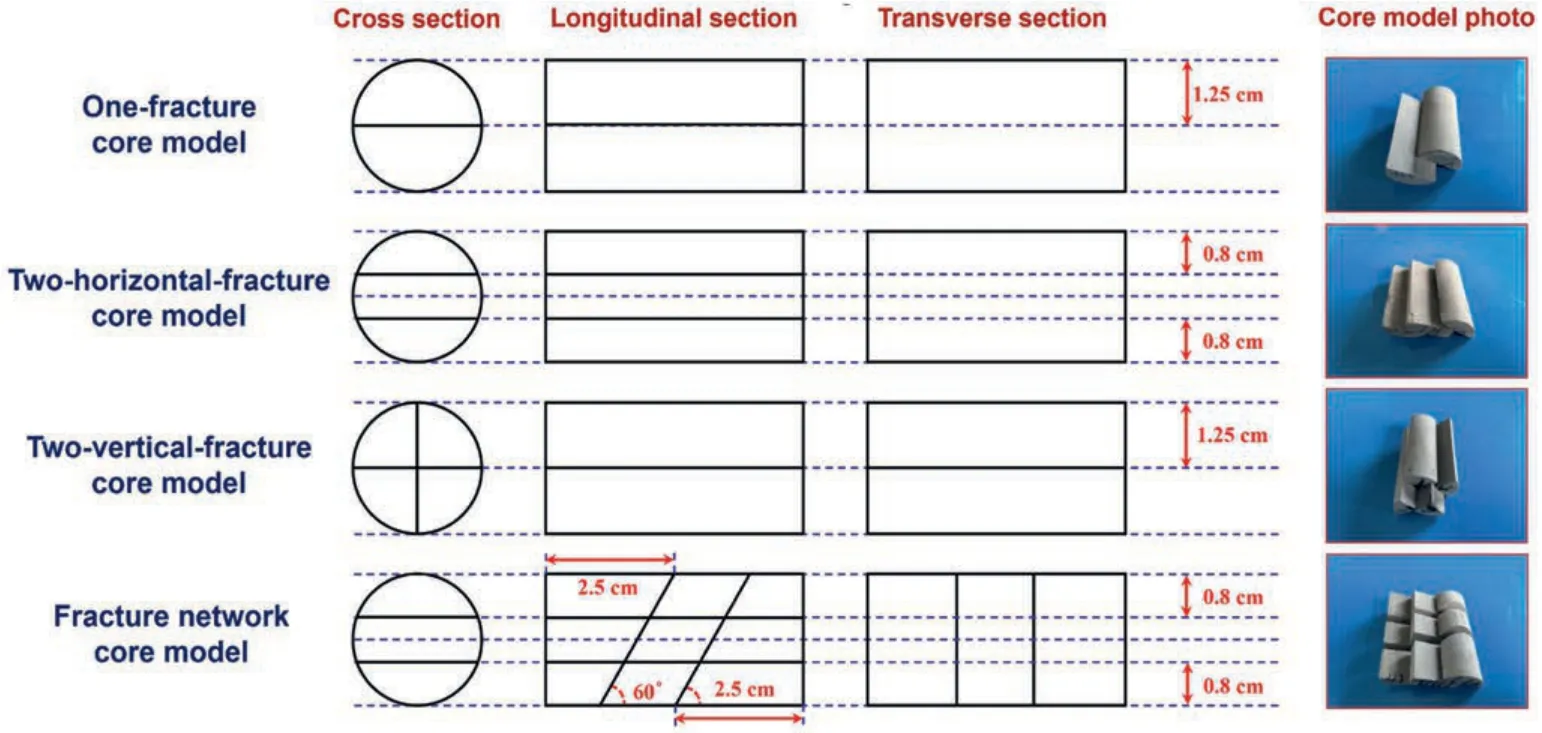
Fig.3.Design schematics and photos of carbonate core models with different fractures.
2.2.2.Core models with different fracture roughness
To explore the impact of fracture roughness of carbonate rocks,three core models with different fracture roughnesses were designed.The first one was the rough-walled-fracture core model with the highest wall roughness.The second one was the smoothwalled-fracture core model with the lowest wall roughness.The third one was with a wall roughness between the first and second models.The design schematics and photos of the core models with the highest and lowest fracture roughness are shown in Fig.4.Similarly,these two core models were first constructed by a wirecutting machine to create an artificial fracture in the core diameter direction.Then abrasive papers with different mesh numbers were used to sand the fracture walls of the two models in different sanding sequences.For the rough-walled-fracture core model,the relatively lower mesh abrasive papers were used to roughen the fracture walls from high to low mesh numbers.Conversely,for the smooth-walled-fracture core model,a series of higher mesh abrasive papers were used to polish the fracture walls from low to high mesh numbers.Again,high-temperature-resistant AB glue was used to bond the fracture walls before conducting the experiments.

Fig.4.Design schematics and photos of carbonate core models with different fracture roughnesses.
2.2.3.Core models with different vug types
Two types of vuggy models were designed to investigate the impact of dissolved vug and through-hole structures,and they were named the fracture-vug core model and the through-hole core model,respectively.The former core model was to add three equal-diameter vugs at both wall sides of the one-fracture core model in the middle.The latter one was to construct a persistent flow channel in the core section.The design schematics and photos are shown in Fig.5.The fracture-vug core model was fabricated based on the one-fracture core model by further processing vug structures using a drilling machine.The high-temperature resistant AB glue was also needed to fix the relative position of the two cut parts before the experiments.For fabrication of the through-hole core model,only a through-flow channel needed to be drilled at the centre of the core sample by using a drilling machine.

Fig.5.Design schematics and photos of carbonate core models with different vug types.
2.3.Experimental setups and procedures
To meet the requirements of an in situ high-temperature and high-pressure testing environment,the TC-180 Multifunctional Ultra-high-pressure Displacement System was employed in the experiments,which has stable testing performance and high metering accuracy and can be applied to core flow simulation tests favourably.The schematic of the experimental setup is shown in Fig.6.The setup mainly includes the liquid injection pump(TC-300 Duplex Plunger Pump,0.01 mL/min ≤flow rate ≤15 mL/min,pressure ≤150 MPa,pressure accuracy ≤0.1%,flow accuracy ≤0.01 mL/min),the ultra-high pressure piston container(max liquid volume ≤ 500 mL,pressure ≤ 200 MPa),the core holder(φ25.4 × 100 mm,pressure ≤200 MPa,temperature ≤180°C,temperature accuracy ≤1°C),the confining-pressure tracking pump (TC-300 Simplex Plunger Pump,0.01 mL/min ≤flow rate ≤15 mL/min,pressure ≤150 MPa,pressure accuracy ≤0.1%,flow accuracy ≤0.01 mL/min),the automatic back-pressure pump (TC-300 Simplex Plunger Pump),the pressure &temperature control system (Senex sensor,pressure ≤200 MPa,pressure accuracy ≤0.25%;PT-100 sensor,temperature ≤250°C),the data collection and processing system (MOXA data acquisition card),the measuring cylinder,and some different kinds of gauges and valves.
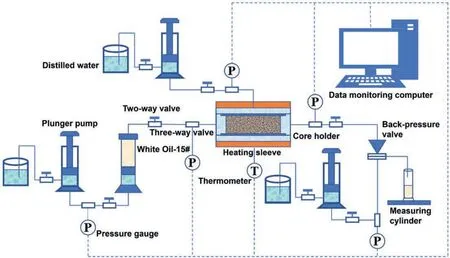
Fig.6.Schematic of the experimental setup for effective stress tests.
To replicate the changes in formation pressure and overburden pressure during actual reservoir development,the test method of constant confining pressure &cyclic pore pressure was employed.Before conducting the experiments,the core model should be aged first to make its physical properties stable and avoid stress hysteresis effects to ensure the reliability of experimental data.After that,the experiments are carried out according to the load procedures,as shown in Fig.7.
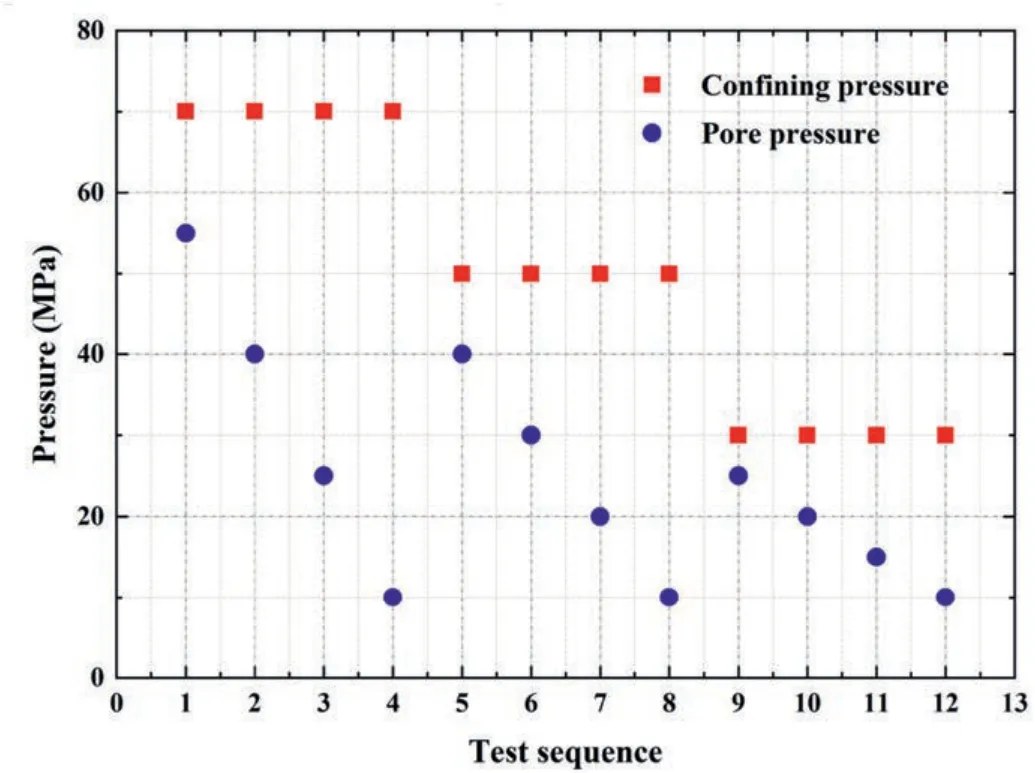
Fig.7.The diagram of load procedures for effective stress experiments.
The complete procedures for conducting an effective stress test on one core model mainly included five steps as follows:
(1) Place the core model in the core holder after oil-saturation operations,install the pipelines,raise the confining pressure to 2 MPa,and check the seal of the whole flow system.Then wear the heating sleeve on the core holder and set the temperature to 100°C.When the measured temperature reaches 100°C,raise the confining pressure to 5 MPa,start the liquid injection pump,and set the injection pressure to 2 MPa.
(2) Once the continuous oil outflow from the outlet is observed,the confining pressure increases to 70 MPa gradually with a rate of 5 MPa per step.Then decrease the confining pressure back to 5 MPa with the same step of 5 MPa.Next,measure the corresponding flow rate and calculate the permeability of the core model at each step;and finally adjusts the confining pressure until the calculated permeability values remain constant under the same pressure conditions.
(3) Incrementally raise the confining pressure,back pressure,and injection pressure until the confining pressure reaches 70 MPa,and the other two pressures reach 65 MPa.After each pressure value is stable,leave the whole system to stand for more than 2 h to restore the core model to the original in situ formation status.
(4) Perform the test step by step according to the load procedures depicted in Fig.7.The pore pressure is equal to half the sum of the injection and back pressures.Then,record the corresponding pressure and flow rate data at each step when the flow state is stabilized.Finally leave the whole system to stand for more than 2 h whenever the confining pressure changes.
(5) Remove the heating sleeve from the core holder at the end of the test;release the system pressure,and take out the core model.Then,reorganize the experimental setup and prepare the next test for another core model.
3.Variations of permeability with alternating stresses
The experimental data were used to estimate the absolute permeability values of these CFVR with different structural characteristics under different stress conditions.In this section,permeability variation laws for different fractured-vuggy rocks are discussed.
3.1.Permeability performance for fractured core models
Figs.8 and 9 show the permeability performance curves(i.e.Kas a function ofpp) of fractured rocks with different fracture development and roughness,respectively.For the majority of fractured rocks,the following common features can be observed:
(1) Under the same confining pressure,the permeability and its growth rate both gradually increase with increase of the pore pressure;
(2) Core models at lower confining pressure tend to have higher permeability,and their average permeability gradually decreases as the confining pressure increases;
(3) The variation range of permeability at lower confining pressure is wider,whereas it is significantly reduced at high confining pressure;and
(4) The variation range of permeability at lower pore pressure is often smaller than that at higher pore pressure.
When the confining pressure is 30 MPa,the impact of pore pressure change on the permeability performance of fractured rocks is extremely significant.However,when the confining pressure exceeds 50 MPa,the permeability is not so sensitive to the pore pressure changes.This demonstrates that the effect on the permeability reduction of fractured rocks is difficult to avoid or alleviate by raising the pore pressure as the confining pressure increases.In addition,the variation ranges of permeability become significantly larger at higher pore pressure conditions,which indicates that the permeability reduction is most significant during the early stage of development.
It can also be seen from Fig.8 that the permeability variation ranges for both one-fracture and two-horizontal-fracture core models are comparable(2-4.5 mD)when the confining pressure is 30 MPa.However,the permeability performance of the twohorizontal-fracture core model is significantly enhanced under higher confining pressures (pc>50 MPa),demonstrating that an increased number of parallel fractures can effectively improve the permeability performance of fractured rocks.For the two-verticalfracture core model,the corresponding permeability under each confining pressure condition is much larger than that of the former two core models,and the permeability values under higher pore pressure conditions are also much larger than those under lower pore pressure conditions.It suggests that the permeability performance of cross-fractured rocks is quite better than that of parallelfractured rocks,and that the difference in permeability sensitivity between early and late development stages for cross-fractured rocks will be significantly greater than that for parallel-fractured rocks.For the fracture network core model,the permeability variations with pore pressure under different confining pressure conditions(2-6 mD)do not exhibit obvious trends and features.From the perspective of liquid flow only,the fracture network does provide a larger flow space and more abundant flow paths for rocks.However,due to the increase in fracture complexity,the core model under alternating stress loads will produce complex fracture displacements and deformations,and each action of load change will cause a redistribution of the fracture network,eventually leading to fluctuating permeability changes.
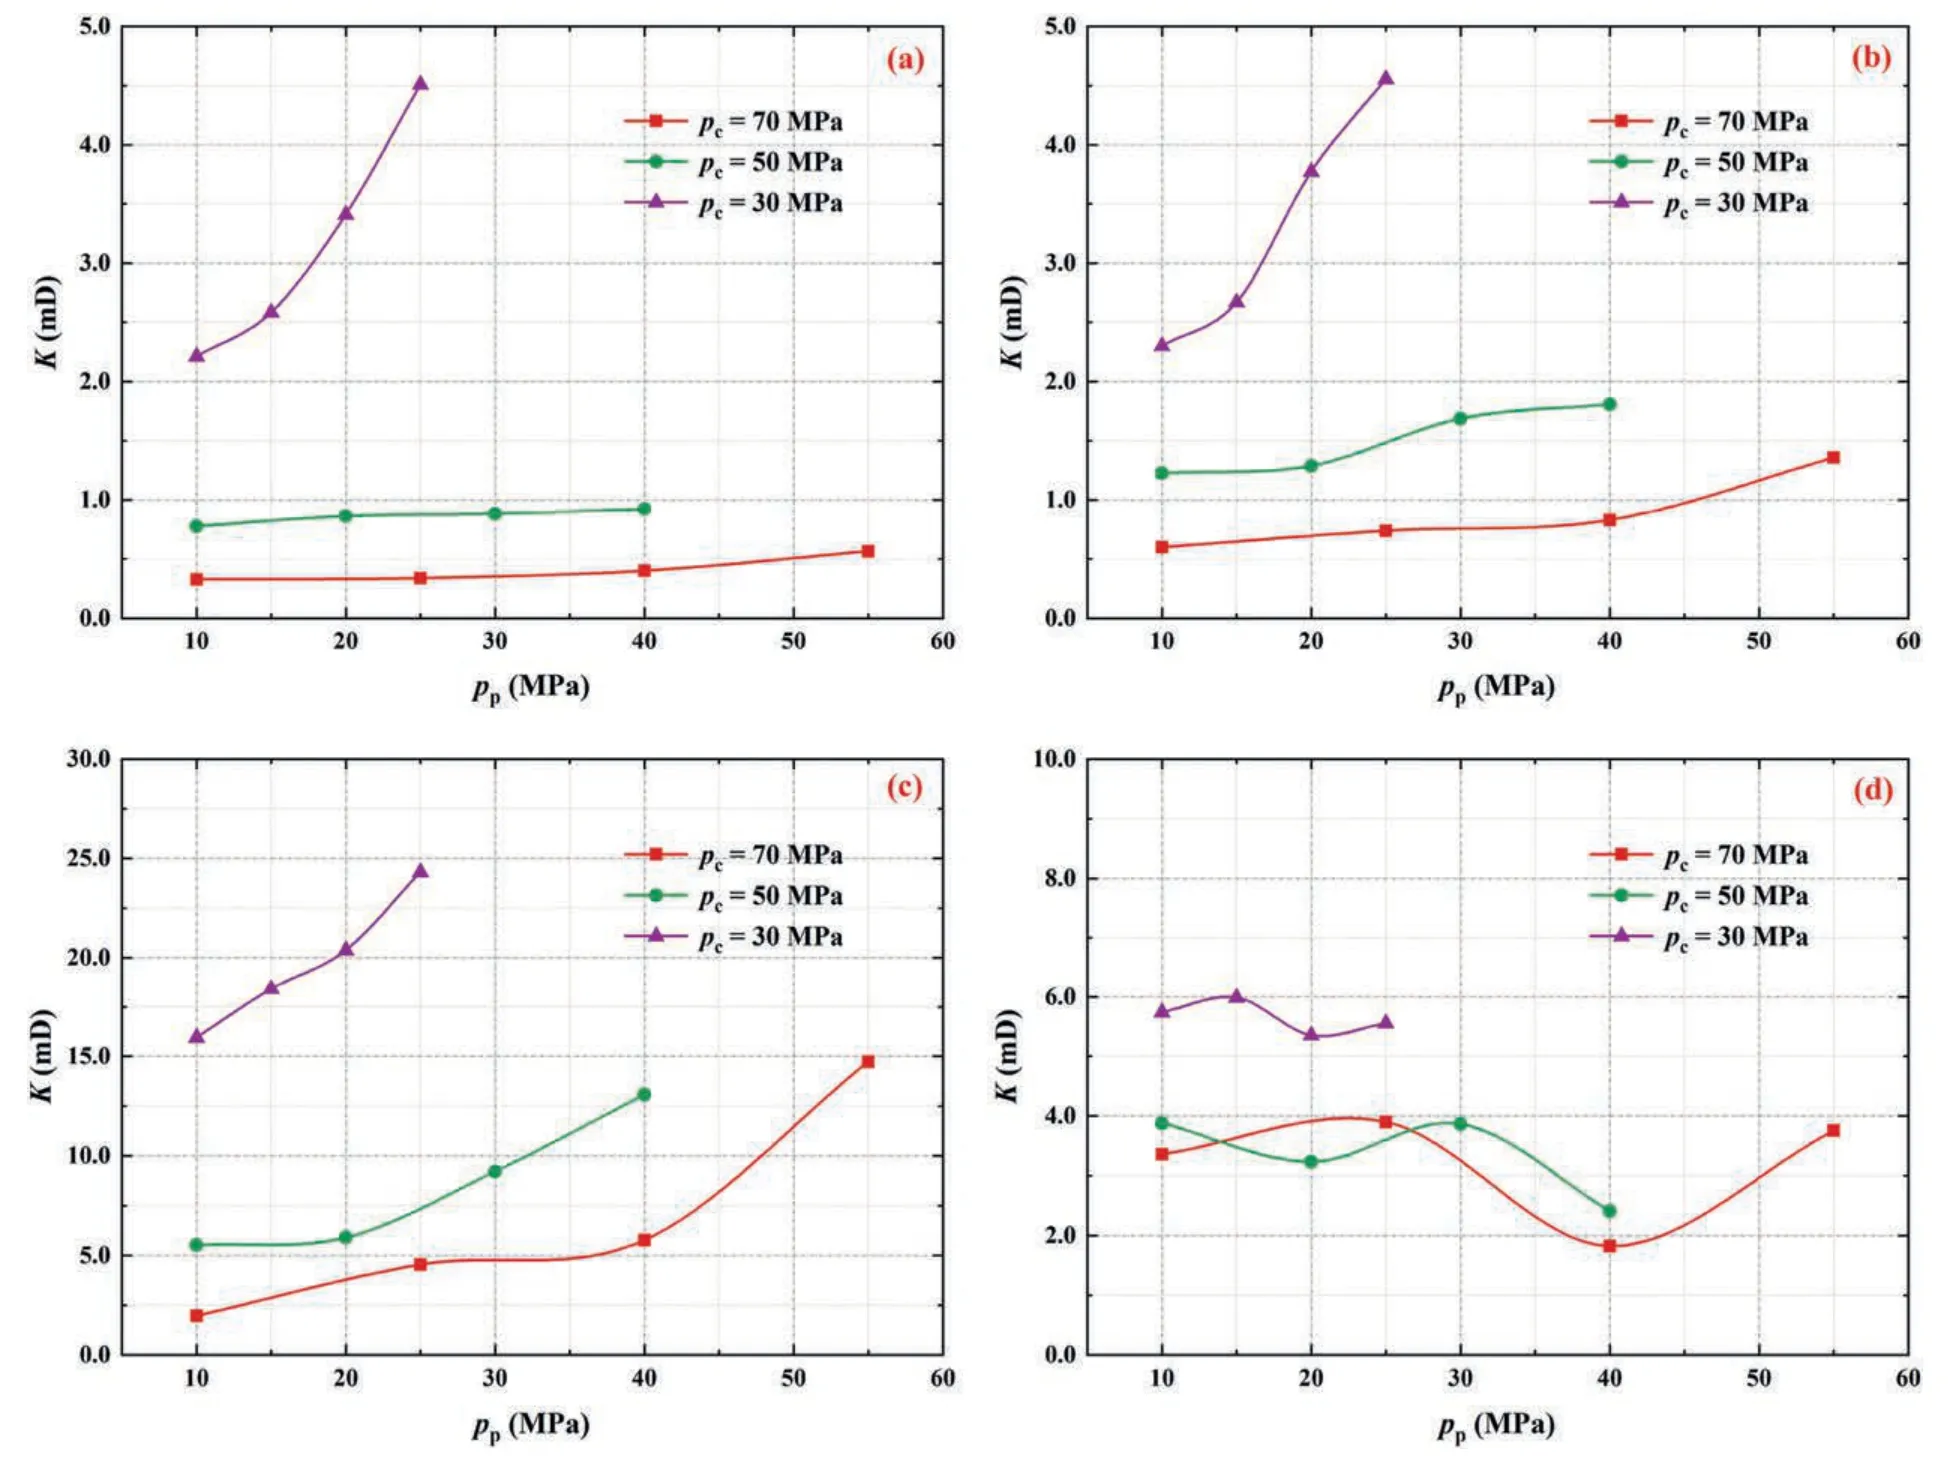
Fig.8.Permeability performance of carbonate core models with different fracture development under different stress conditions.(a)One-fracture core model;(b)Two-horizontalfracture core model;(c) Two-vertical-fracture core model;and (d) Fracture network core model.
Fig.9 illustrated the permeability curves of carbonate core models with different fracture roughnesses.It can be seen that the average value and the variation range of permeability of the roughwalled-fracture core model are comparatively larger than those of the smooth-walled-fracture core model,which is caused by the fact that the smooth fracture walls are likely to close under loading.When the confining pressure reaches 70 MPa,the permeability change of the rough-walled-fracture core model is less than 0.5 mD,and there is an evident lower limit of permeability.The unevenness of rough wall surfaces makes it difficult to close the fracture completely;the greater the fracture roughness,the more difficult it is to achieve full closure.Therefore,even if the confining pressure increases to 70 MPa and the pore pressure decreases to 10 MPa,the permeability of the rough-walled-fracture core model is still higher than 9.5 mD and it is difficult to decrease further,remaining at a quite higher level than that of the smooth-walled-fracture core model.

Fig.9.Permeability performance of carbonate core models with different fracture roughnesses under different stress conditions: (a) Smooth-walled-fracture core model;and (b)Rough-walled-fracture core model.
3.2.Permeability for vuggy core models
The permeability curves of fractured rocks and vuggy rocks under different stress conditions have similar patterns of change,as presented in Figs.8-10.Compared with the one-fracture core model,the average permeability of the fracture-vug core model is higher,and the variation range of permeability is significantly larger,particularly under lower confining pressures.When the confining pressure is greater than 50 MPa,the permeability of the fracture-vug core model decreases sharply with decreasing pore pressure,and then it falls below 2 mD under both confining pressures when the pore pressure decreases to 10 MPa.This indicates that vugs can increase the absolute permeability of the whole rock to a certain extent,especially under relatively higher pore pressure conditions.As the pore pressure decreases,the effect of dissolved vugs on improving permeability gradually decreases,and thus the fracture-vug core model exhibits a permeability change law similar to that of the one-fracture core model in the later stage of stress loads.For the through-hole core model,the experimental results showed that the average permeability at each confining pressure is much higher than that of other core models,but the relative change in permeability with pore pressure is quite small.When confining pressure is 30 MPa,the change in permeability for the through-hole core model is about 2 mD,and the change in permeability over the entire test interval is about 5 mD.The results indicate that the effect of alternating stresses on the permeability performance of dissolved through-hole rocks is extremely limited.Furthermore,due to the finite compressibility of the through-hole space,its difference in flow capacity under different confining pressures is smaller than that of other fractured-vuggy rocks.
4.Results and analysis
In this section,four representative carbonate fractured-vuggy core models with different structure characteristics were selected to calculate their ESCP values and analyse the distribution differences of their ESCP surfaces,including the one-fracture core model,two-horizontal-fracture core model,fracture-vug core model,and through-hole core model.First,the relationship curves between permeability and net stress under different confining pressure for the four core models are plotted,as shown in Fig.11.
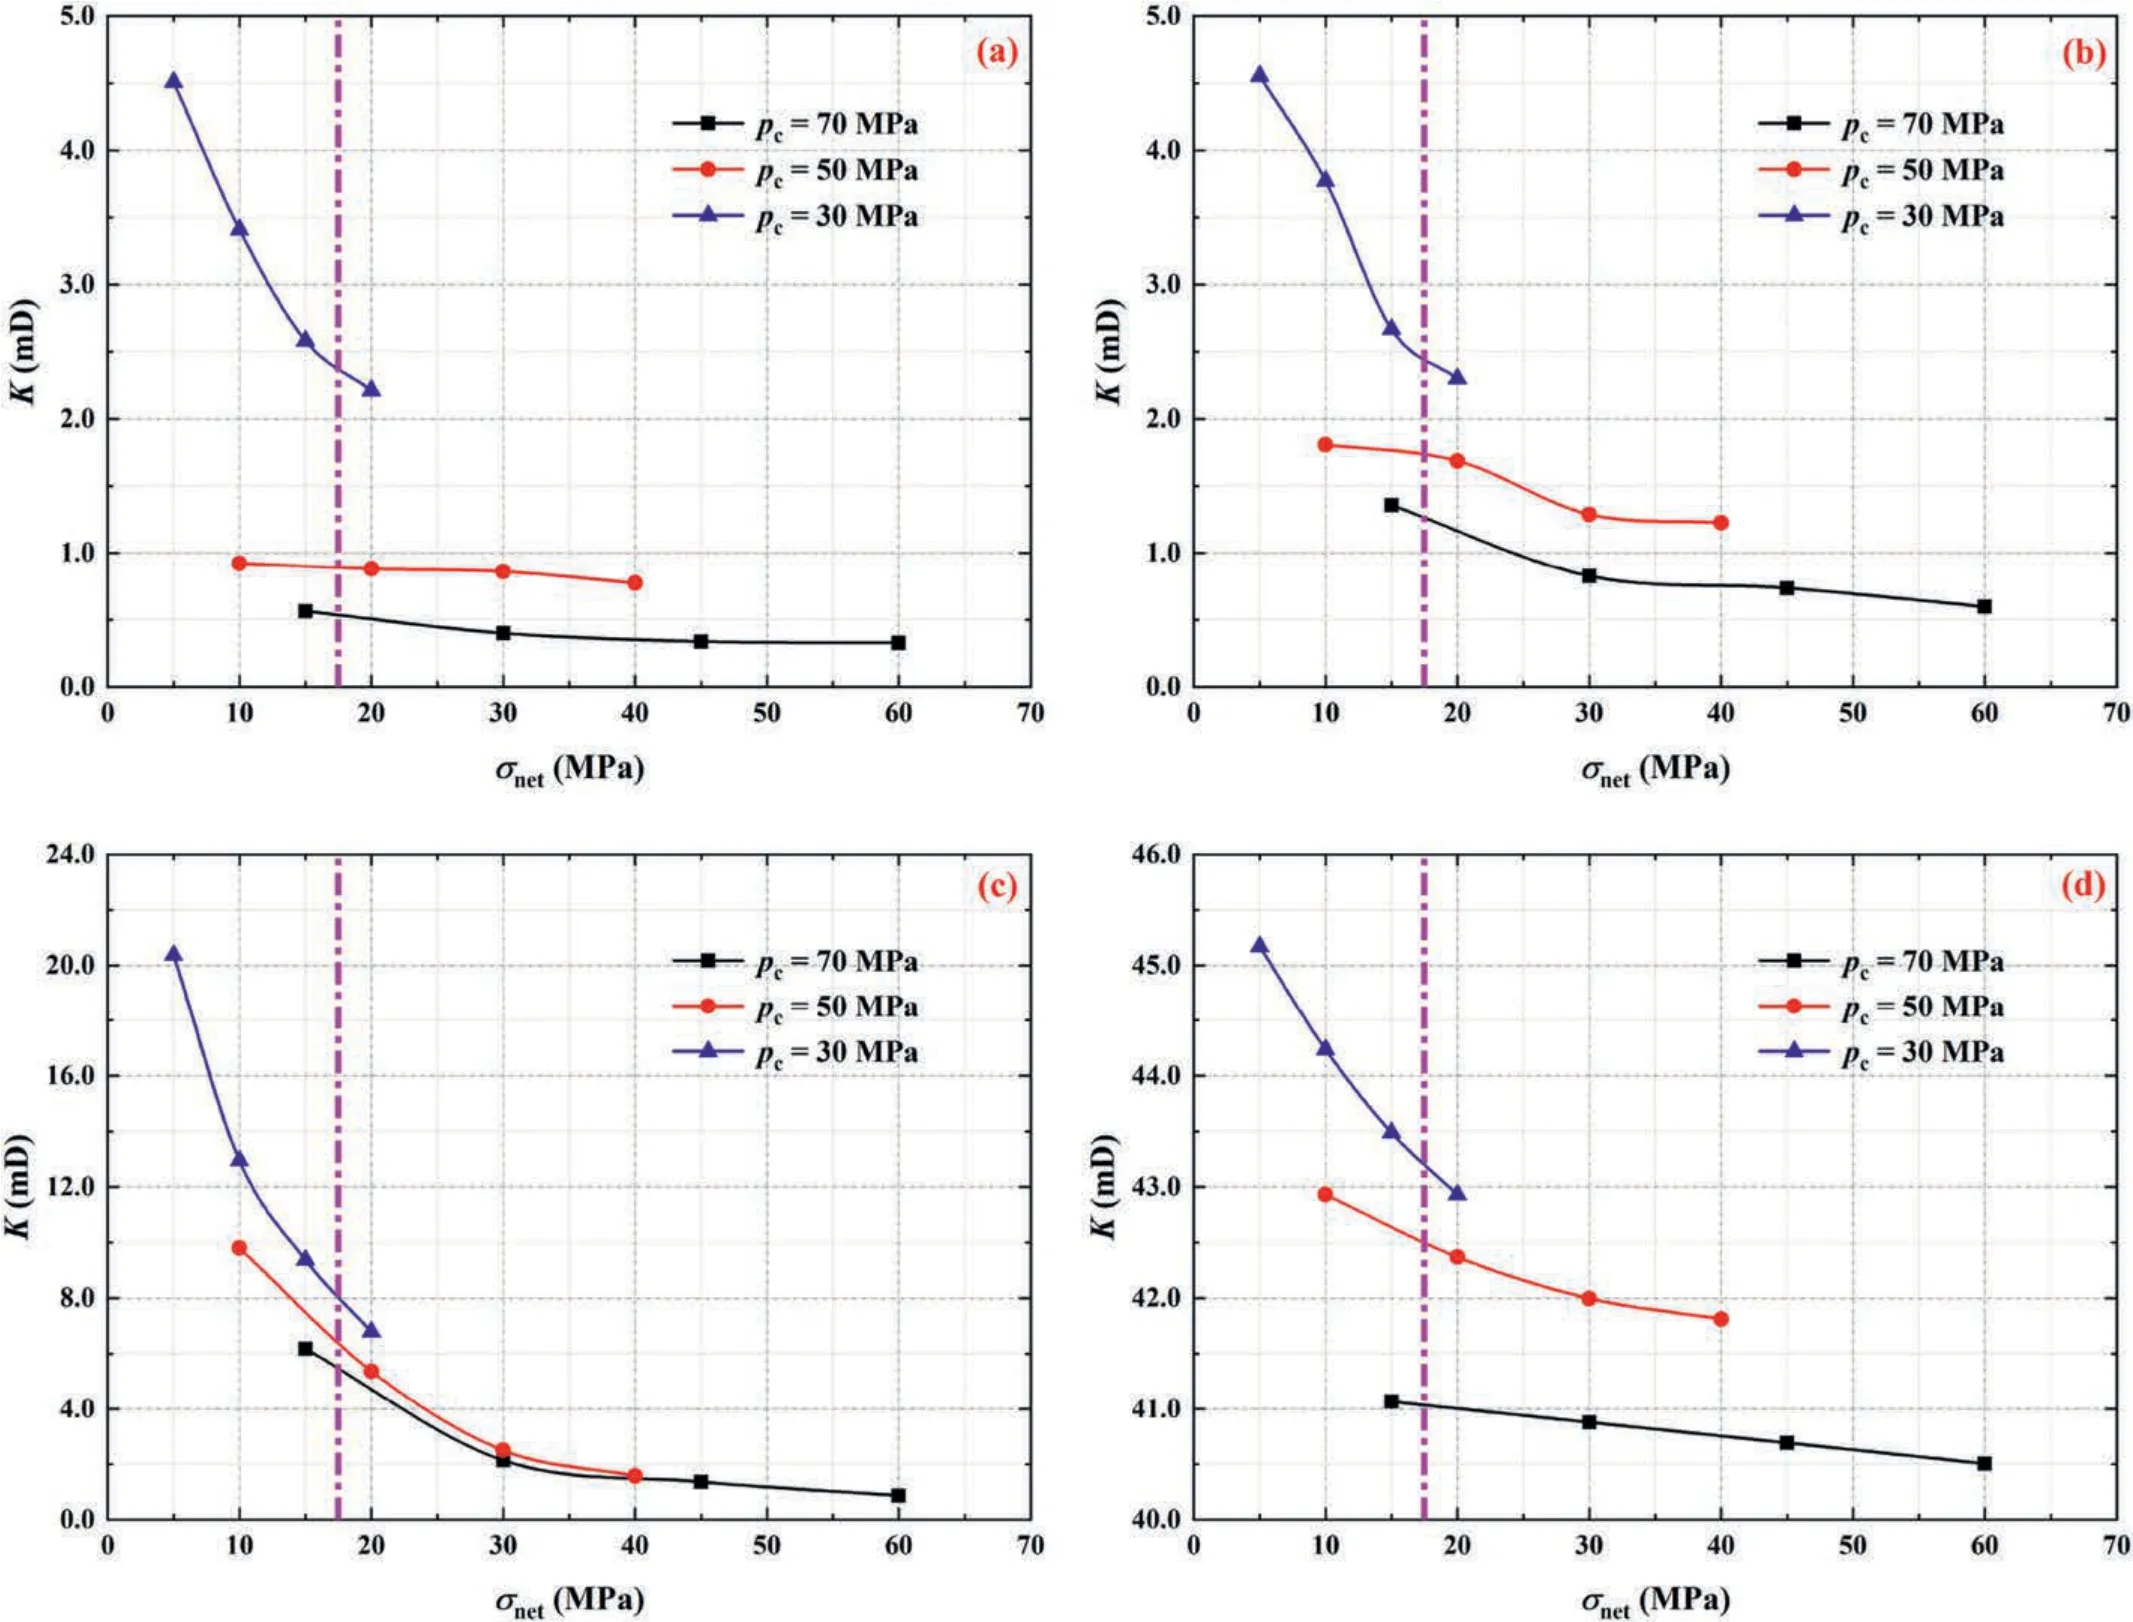
Fig.11.The relationship curves between permeability and net stress under different confining pressure:(a) One-fracture core model;(b) Two-horizontal-fracture core model;(c)Fracture-vug core model;and (d) Through-hole core model.
According to the definition of effective stress for permeability,its true value should have a good correspondence with the absolute permeability.Regardless of the confining and pore pressures applied,an effective stress value can only correspond to a defined permeability value.However,it can be seen from the magenta dash-dotted line in Fig.11 that when the net stress is equal to 17.5 MPa,the permeability values of four core models differ quite substantially from each other.This demonstrates that for CFVR,the effective stress cannot simply be replaced by the net stress since a significant value difference exists between the two concepts.Thus,the ESCP should be calculated accurately based on the experimental data to obtain the true effective stress.
4.1.ESCP based on response surface method (RSM)
When applying the RSM,it is not necessary to consider the intrinsic physical properties of the experimental object,and the empirical model can be built only by fitting the approximate response surface of the data.This approach is particularly useful for tight rock samples with relaxation microcracks,because such a microstructure can invalidate any mechanistic models based on linear elasticity(Warplnski and Teufel,1992).Thus,the RSM can be used to avoid biasing the real results,which is a completely empirical approach.Due to the significant advantages of RSM,it is chosen to calculate the ESCP values for the core models.In general,the RSM consists of three main steps: (1) transform the permeability data into a simpler form and weight the variance;(2)fit the converted data by using linear or quadratic surfaces;and (3) use standard statistical and graphical techniques to determine the value of ESCP.
Accordingly,the obtained permeability values can be transformed based on the following expression:
whereKTis the transformed permeability.The value of the power exponent λ is generally between -3 and +3.
By transforming the permeability data,the sum of squared residuals can be minimized and the response surface of the test data can be well fitted.The maximum-likelihood method proposed by Box and Draper(1987)can be used to determine the transformation power and optimize the transforming process.
Subsequently,the transformed permeability data were fitted with an expression of the quadratic surface:
whereai(i=1-6) is the coefficients of the quadratic surface.
Therefore,both theKT-pc-ppresponse surface and its inverseKpc-ppresponse surface could be obtained in the three-dimensional space.After that,theF-test suggested by Box and Draper (1987) is used to evaluate the significance of the regression model.The parameterFdenotes the ratio of the model mean square to the error mean square.Box and Draper (1987) considered the test criterion for a significant response surface regression was that theFvalue is at least 10 times theFdistribution percentage point(generally taken as 95%).In addition,a significance test of the regression coefficients is also required (Li et al.,2009b).The test criterion is that the significance test values are all greater than the corresponding values from theT-distribution tables,that is,the regression coefficients are significantly not equal to zero,indicating the regression coefficients corresponding to independent variables are significant to the dependent variable.
Finally,according to the definition expression of ESCP (see Eq.(7)),the ESCP values corresponding to different confining and pore pressure could be calculated by the following equation:
By applying the above procedures,the transformation powers of the permeability data for the four representative core models were determined,as shown in Table 2.To verify the accuracy of RSM calculation,the results ofKTcalculated by this method were compared with the actual test data ofKT,as shown in Fig.12.The calculated results and experimental data for these core models are scattered along the 45°straight line with minimal deviation,indicating that the results obtained by RSM are reliable.

Table 2 Transformation powers of the permeability data for the four representative core models.
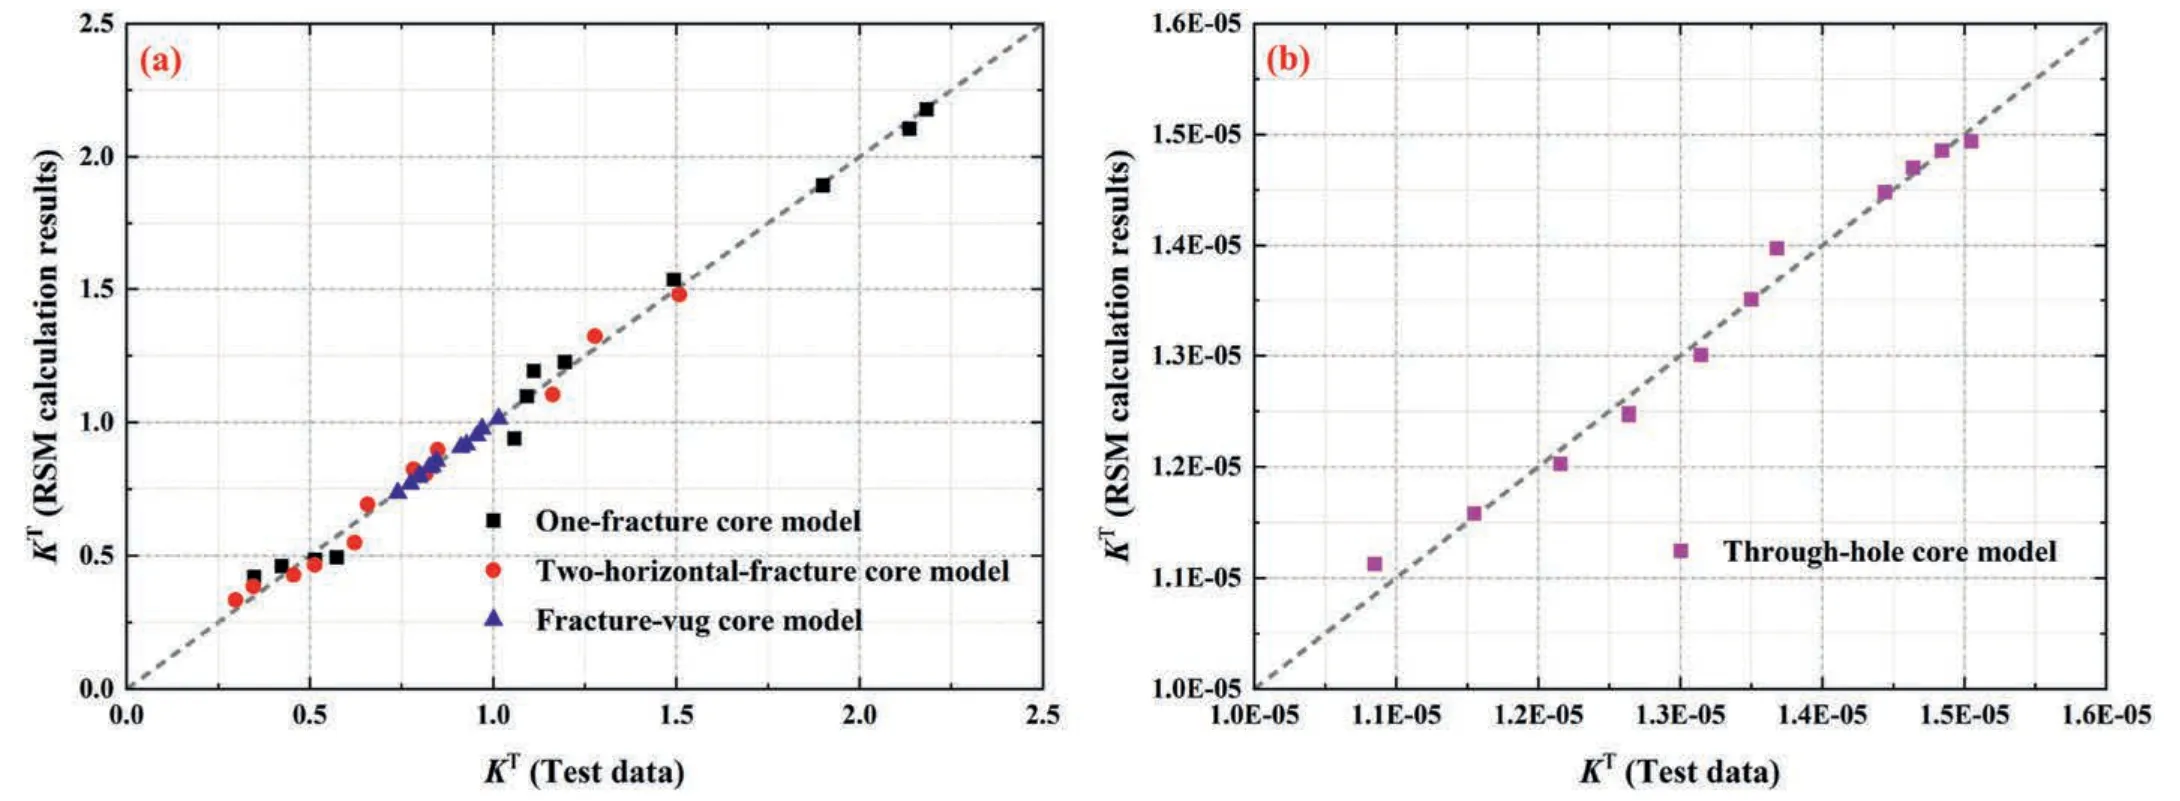
Fig.12.Comparison of the KT results calculated by RSM and the actual test data of KT for the four representative core models:(a)One-fracture core model,two-horizontal-fracture core model,and Fracture-vug core model;and (b) Through-hole core model.
The ESCP surfaces for the four representative core models calculated by RSM are shown in Figs.13 and 14.Overall,the calculation results demonstrated that:
(1) The effective stress for permeability of CFVR shows obvious nonlinear characteristics,since the ESCP values are all notconstants and vary with the changes of confining pressure and pore pressure;
(2) All obtained ESCP values are not equal to 1,but the variation range is concentrated between 0 and 1.This indicates that the permeability of CFVR is more sensitive to confining pressure than pore pressure;and
(3) The CFVR with different structure characteristics exhibit different variation features of ESCP.
Xiao et al.(2012) summarized previous research results on the relationship between ESCP and rock deformation response,and pointed out that single-component fractured rocks without clayey minerals have a significant feature that the ESCP value is less than 1 and varies with stress.Similarly,the results of this study are in agreement with this previous conclusion,indicating the fracture deformation effect of the rock model is very significant.
As shown in Fig.13a and b,the ESCP values for the one-fracture core model and the two-horizontal-fracture core model are distributed in the ranges of 0.002-0.534 and 0.254-0.672,respectively.It was found that the value of ESCP decreases with increase of the confining pressure and increases with increase of the pore pressure.Obviously,the ESCP values for both models vary in a range much smaller than 1.Theoretically,when the initial pore pressure is relatively high,the fracture is in an open state and the corresponding ESCP value of the ideal infinite fracture should thus be equal to 1(Bernabe,1986).Since the infinite fracture cannot exist in natural rocks,the initial value of ESCP is often less than 1.With the gradually decreased pore pressure,the rock skeleton deforms and is compressed.Then,the contact points on the two fracture surfaces gradually increase,resulting in the fracture becoming difficult to close,and the ESCP decreases continuously.As pore pressure continues to decrease,the fracture reaches the ultimate closure status,and the matrix pore space also gradually reaches the compression limit status.At this point,the total porosity and matrix porosity are all smaller than those of the initial state,and the ESCP decreases to the minimum value accordingly.Thus,the smaller the initial porosity,the smaller the minimum ESCP value.Since the carbonate fractured core models used in this study have very small porosity,the obtained lower limit value of ESCP is thus relatively small.For the one-fracture core model,the ESCP is much smaller than 1 and close to 0 atpp=10 MPa.Comparatively,the lower limit value of ESCP for the two-horizontal-fracture core model is 0.254,and the value surface is shifted upward overall.As mentioned above,the increase in the number of fractures increases the initial porosity of the core model.Accordingly,the porosity in the ultimate compression status is also relatively larger than that of the onefracture core model.
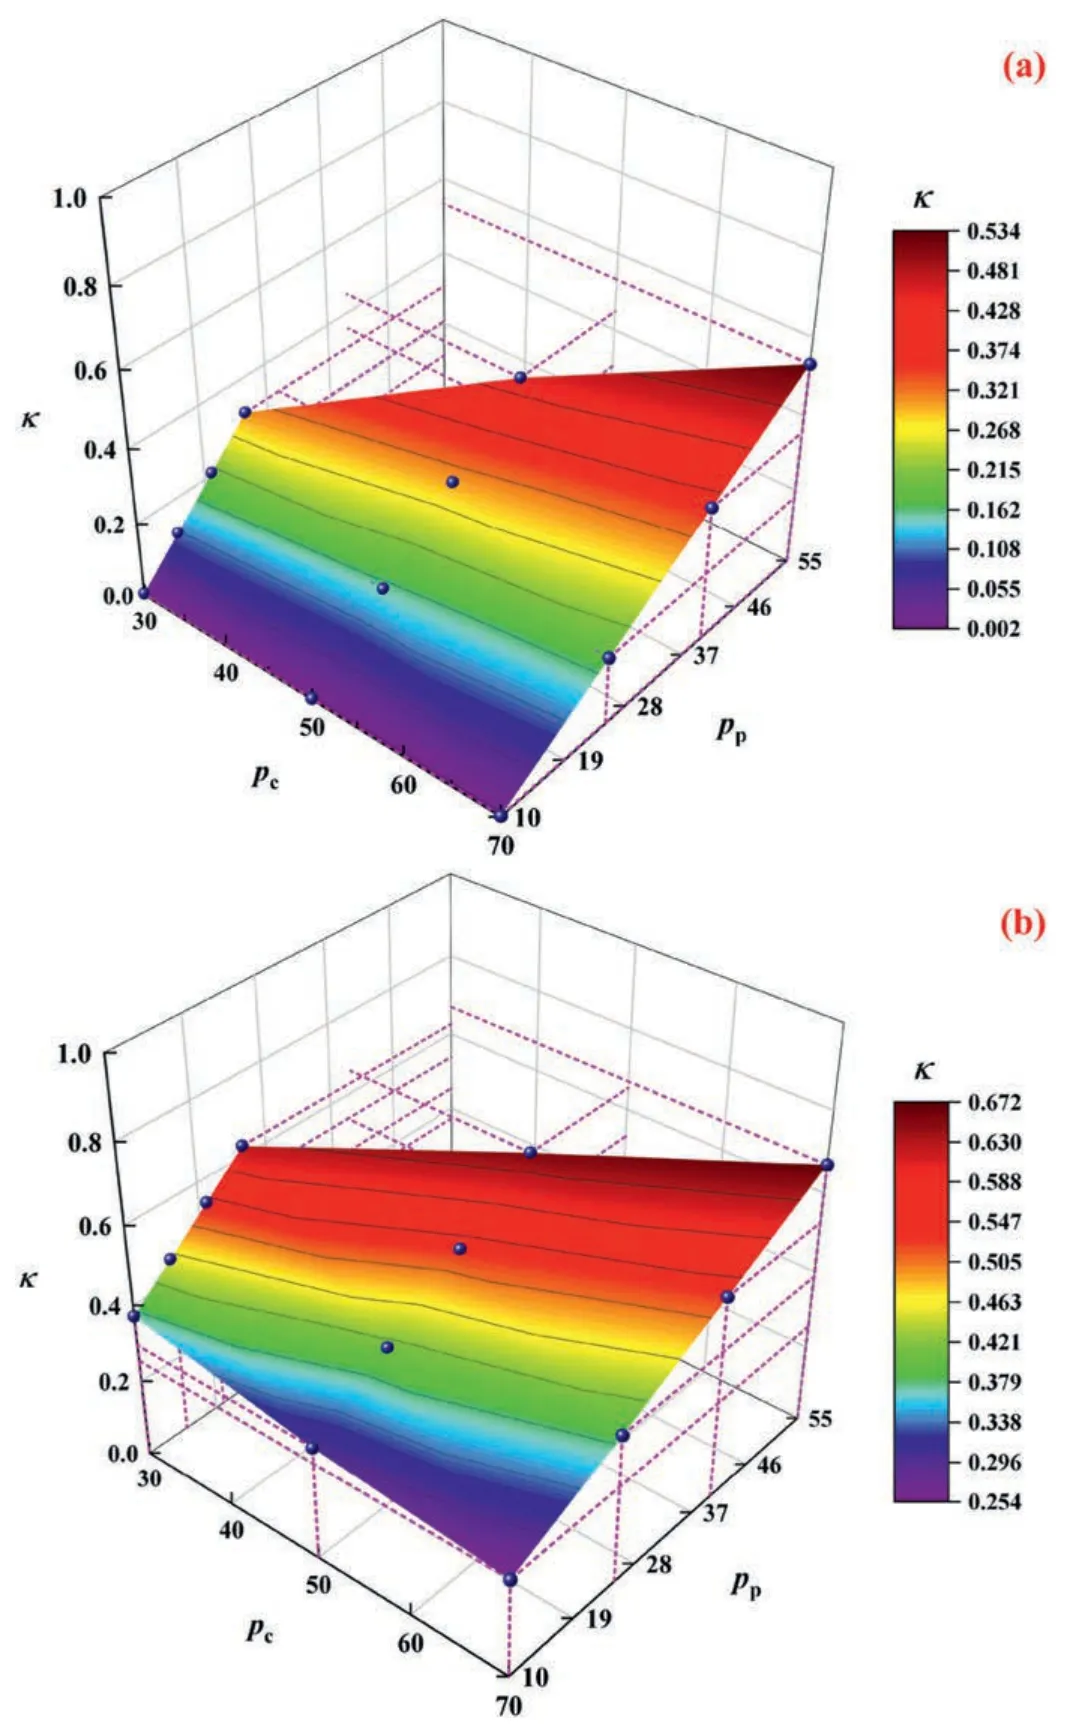
Fig.13.The ESCP surface of carbonate fractured core models calculated by RSM: (a)One-fracture core model;and (b) Two-horizontal-fracture core model.
Fig.14a and b shows the calculated ESCP surfaces for the fracture-vug core model and the through-hole core model,respectively.Compared with the fractured rocks,the distribution characteristics of ESCP for the vuggy rocks are more complicated.It can be found that the ESCP distribution interval for the fracture-vug core model is more concentrated (0.768-0.997).Furthermore,the ESCP value gradually increases with increase of the pore pressure,which proves that the value of ESCP for the fracture-vug rocks can be approximated to 1.When the pore pressure is relatively high,both the fracture and vug space is fully open and is much closer to the ideal infinite fracture model assumed by Bernabe (1986),thus its upper limit of ESCP is close to 1.Unlike fracture-developed carbonate rocks,the compressibility of the vug structure is extremely limited regardless of variation of the confining pressure and pore pressure,and the contactable area for the fracture surfaces is significantly reduced.As a result,the fracture-vug rocks quickly reach the limit state of contactable fracture closure under the combined action of internal and external pressure,so the lower limit value of ESCP is comparatively high and the range of ESCP variation is quite narrow,showing strong deformation response characteristics of porous rocks.In addition,the ESCP distribution interval for the through-hole core model is more dispersed(0.1-0.982),and the value of ESCP decreases continuously with increase of the confining pressure.As the flow space for the through-hole rock is a through-hole channel,the compressibility of the whole media is quite enhanced.The larger the applied confining pressure is,the smaller the through hole and matrix pore space are compressed.Therefore,the porosity decreases and the value of ESCP also reduces gradually.When confining pressure is equal to 70 MPa,the values of ESCP are just distributed around 0.1,which is much smaller than that of the fracture-vug core model.
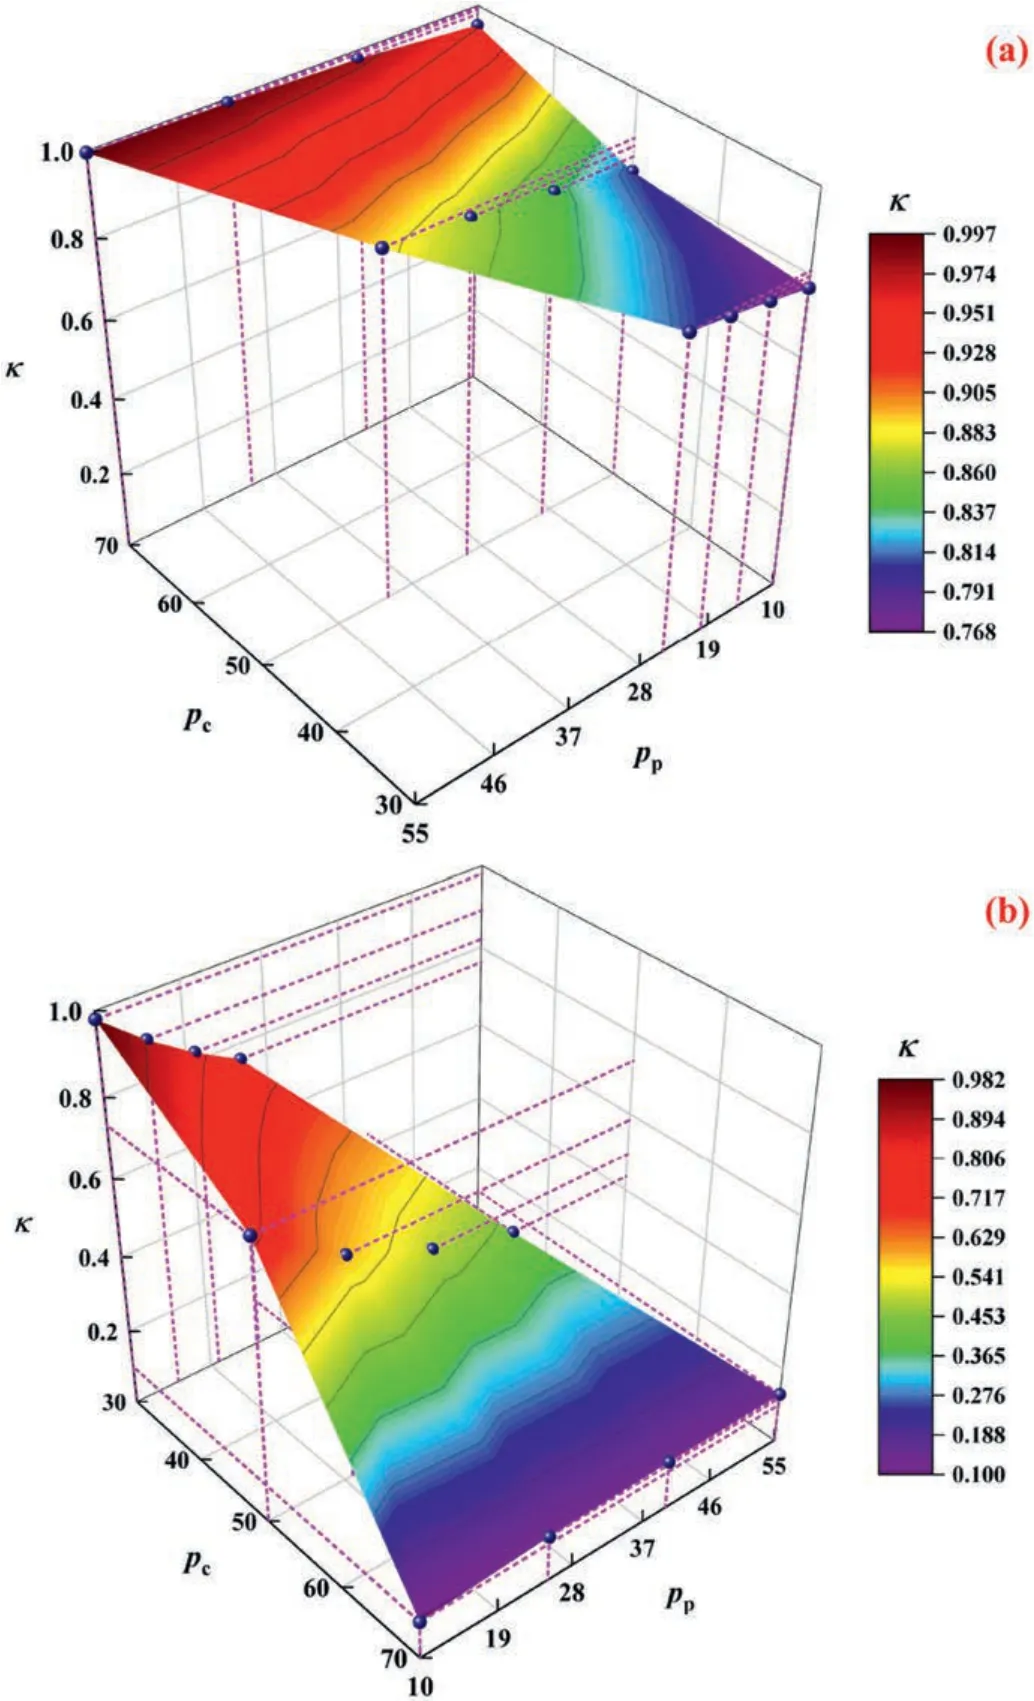
Fig.14.The ESCP surface of carbonate vuggy core models calculated by RSM: (a)Fracture-vug core model;and (b) Through-hole core model.
In order to verify the relationships between the effective stress and permeability for these carbonate fractured-vuggy core models after RSM correction,the results were compared with the ones based on the classical Terzaghi model,as shown in Fig.15a-d.It is clear that the distribution of data points in theK-σeffplots calculated by the Terzaghi method is scattered,and there is no obvious correspondence between the two variables.However,theK-σeffscatter plots after RSM correction are more consistent with the definition of effective stress,revealing the correspondence between permeability and effective stress is better and the fitting curves based on the power model is also in a good agreement.
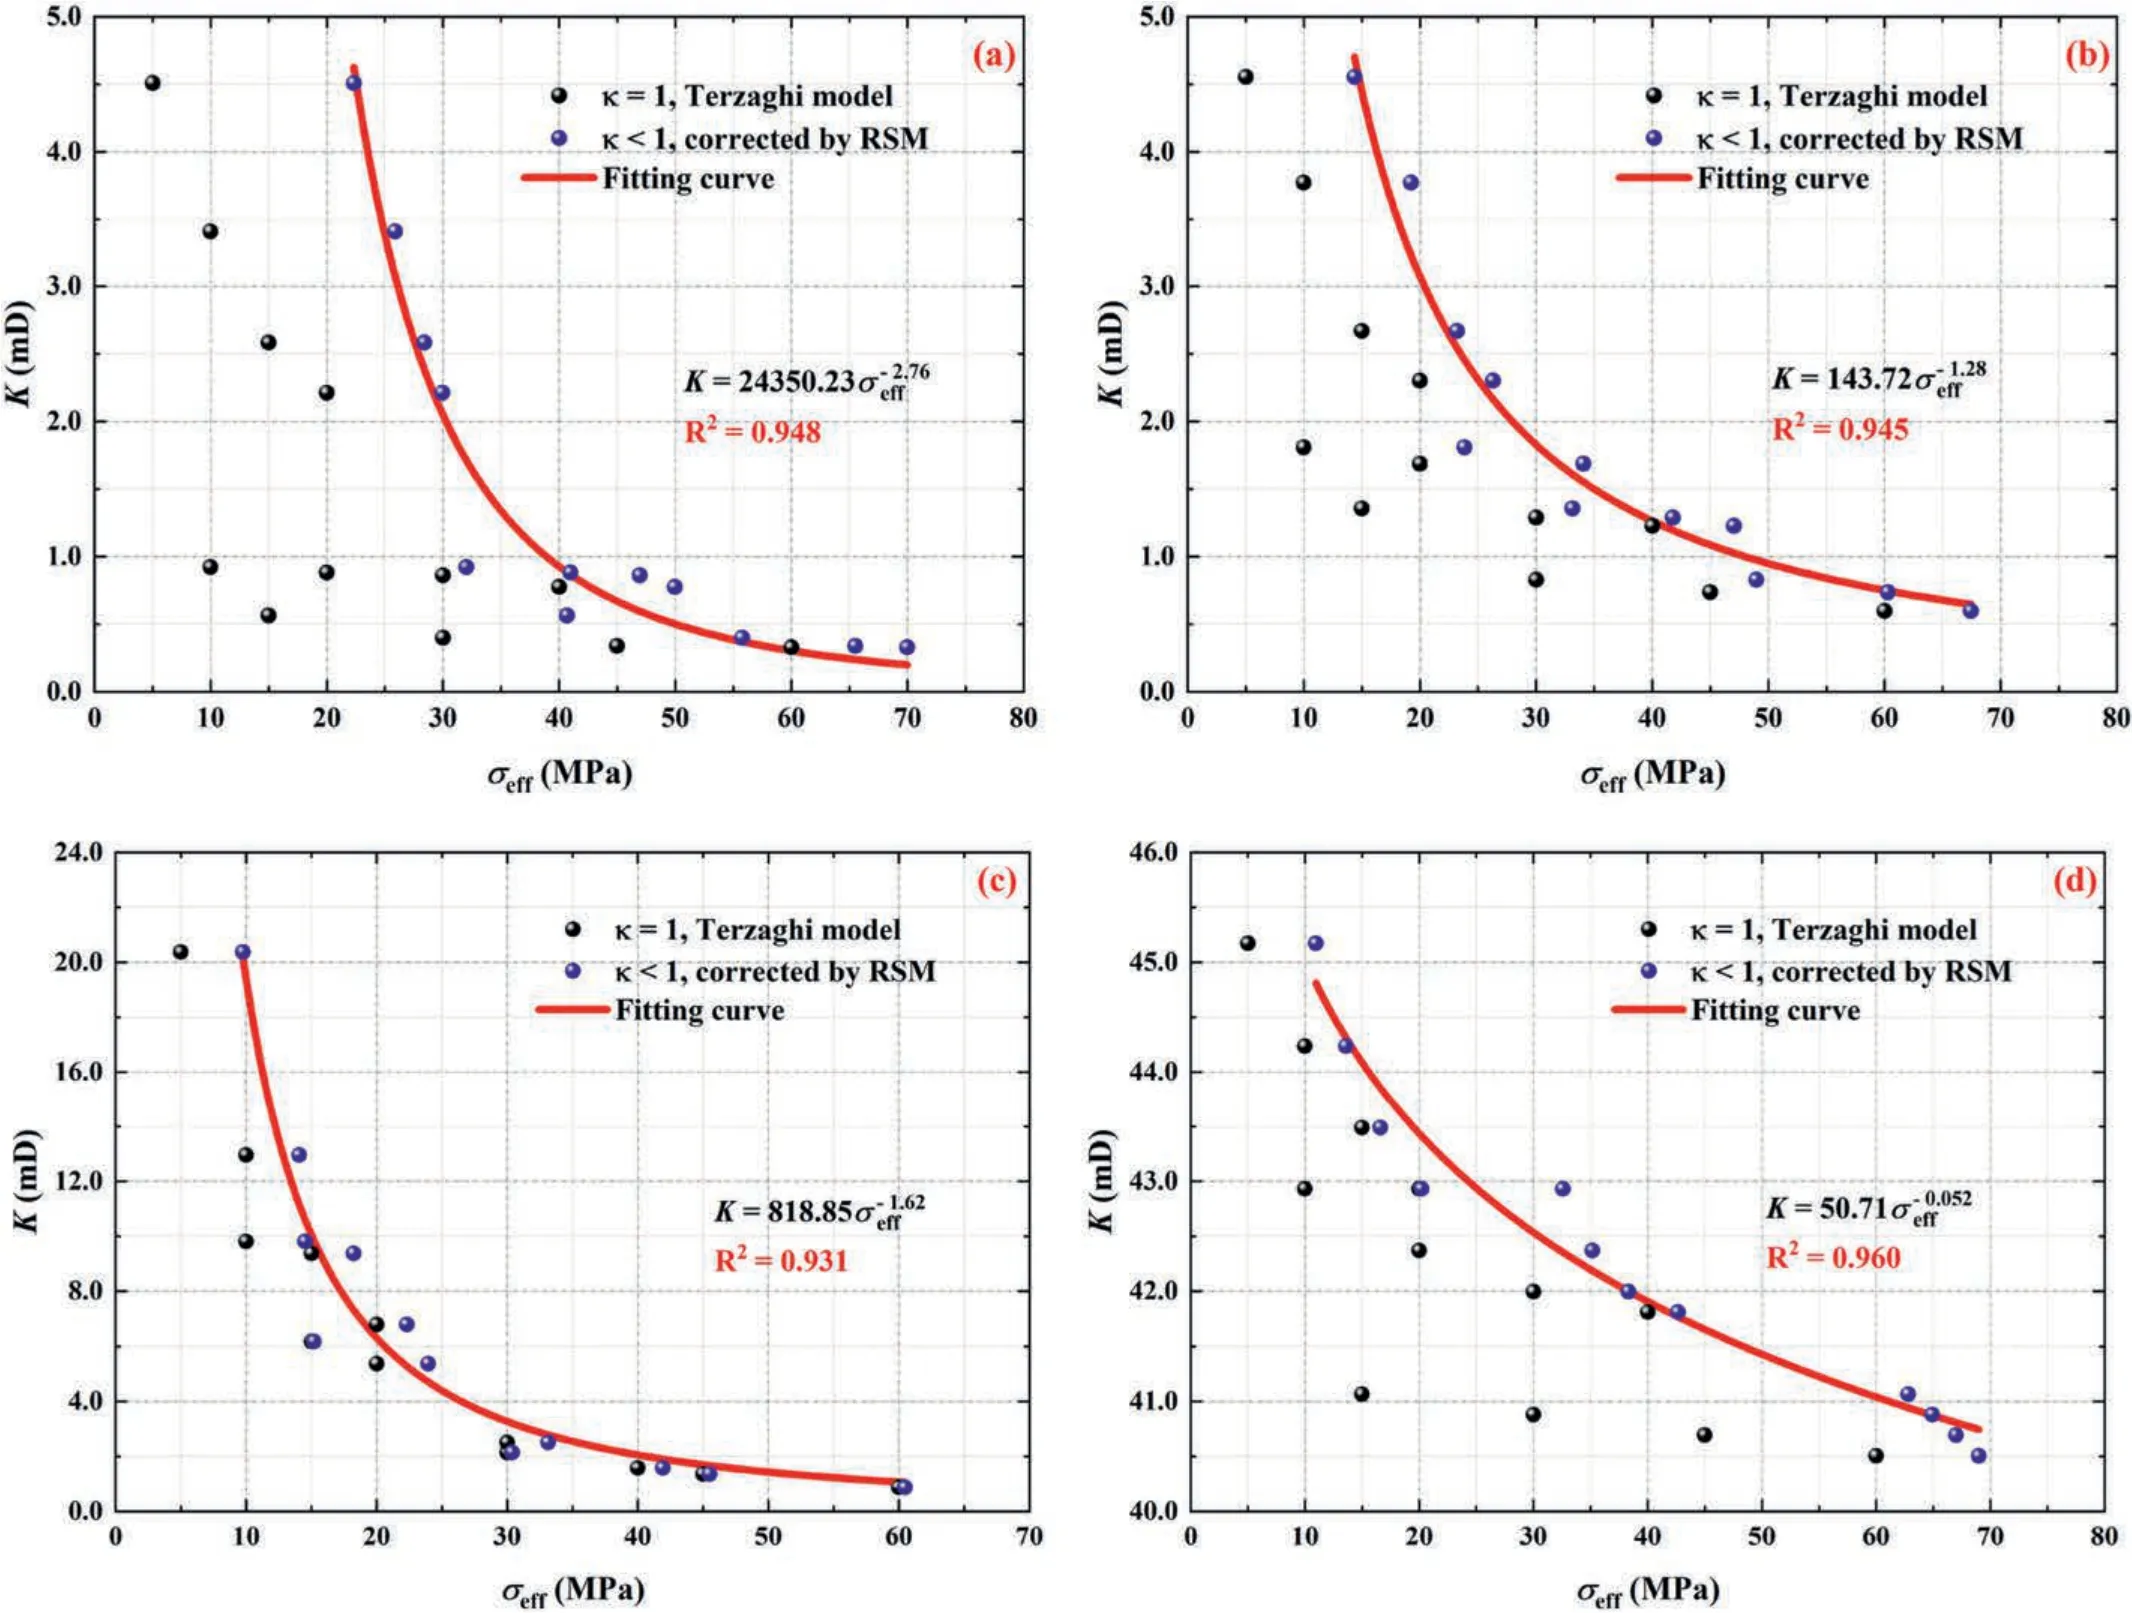
Fig.15.Comparisons of the corrected results based on RSM and the calculations based on the classical Terzaghi model for the relationship between effective stress and permeability: (a) One-fracture core model;(b) Two-horizontal-fracture core model;(c) Fracture-vug core model;and (d) Through-hole core model.
4.2.ESCP model for fractured-vuggy rocks
Due to the multiscale storage and flow space of CFVR,it is difficult to establish theoretically a suitable ESCP characterization model.Currently,most ESCP calculation models merely consider single-pore and pore-fracture rocks (Zhang et al.,2016) and the additional impact of dissolved vugs on the effective stress for permeability of rocks is not taken into consideration.In order to derive the effective stress law of the CFVR mathematically,an ESCP characterization model that integrates the triple mediums such as matrix pores,fractures,and dissolved vugs was established in this section.
For the pore-fracture-vug triple media system,assuming the permeability of combination systems in parallel connection,the integrated permeability can be expressed as follows:
whereKtis the integrated permeability of the triple media (mD);andKm,KfandKvrepresent the permeability of the matrix pore system,fracture system and dissolved vug system (mD),respectively.
According to the law of capillary flowing and the principle of equivalent-flow resistance (Yang and Wei,2004),equating the matrix pores to parallel capillary bundles with equal diameters,the permeability of the matrix pore system can be expressed by the following equation:
where φmis the porosity of the matrix pore system,rmis the average pore radius of the matrix pore system(mm).
Meanwhile,based on Boussinesq’s Equation and Poiseuille’s Law,combined with the principle of equivalent-flow resistance,the permeability of the pure fracture system and the dissolved vug system can be respectively expressed as follows (Yang and Wei,2004):
where φfand φvare the porosity of the fracture system and matrix pore system,respectively;wfis the average fracture width of the fracture system(mm);rvis the average vug radius of the dissolved vug system (mm).
Corresponding author.Correspondingly,the porosity expressions for the three systems of storage space can be derived by
wherenis the number of capillaries in the rock cross-section,lis the length of fractures in the rock cross-section,mis the number of dissolved vugs in the rock cross-section,andAbis the crosssectional area of the rock (mm2).
Substituting Eqs.13-15 into Eq.(12) and taking partial derivatives of the pressurepat both ends,the following expression can be obtained:
According to the definition of ESCP(see Eq.(7)),the expression of ESCP for the triple media system can be written by
For the dissolved vug system,the whole of an independent dissolved vug and its surrounding medium can be regarded as a“thick-walled cylinder”,and its cross-section is like a circular ring(Li and Zhang,2006).The inner and outer radii of the ring arer1andr2,which refer to as the distances from the boundary of the dissolved vug and the surrounding medium to the centre of the ring,respectively.Thereby,the circular ring will be elastically deformed under the combined action of internal pressure(pore pressurepp)and external pressure (confining pressurepc),as shown in Fig.16.

Fig.16.Schematic diagram of the thick-walled cylinder section (circular ring).
According to the relevant theory of elastic mechanics,the radial displacementurat any pointrinside the cylinder wall (circular ring) can be expressed by the following equation:
whereuris the radial displacement at the pointrof the circular ring(mm);ν is Poisson’s ratio of the rock;Eis the elastic modulus of the rock(MPa);andr1,r2are the inner and outer radius of the circular ring (mm).
The displacement atr1is exactly the change of the dissolved vug radiusrv.When external pressure (pc) does not change,the following expression can be derived:
Similarly,when the internal pressure (pp) does not change,the above expression can be reduced as
Additionally,the porosity of the dissolved vug system can be expressed as
whereVvis the dissolved vug volume (mm3),Vbis the total rock volume(mm3),Avis the dissolved vug area in the rock cross-section(mm2),rbis the outer boundary of the surrounding medium(mm).
For the matrix pore system,the pore compressibility to the pore pressure and the confining pressure is
whereCmppandCmpcare the compressibility of the pores to pore pressure and confining pressure (MPa-1),respectively.
Moreover,for the fracture system,the fracture compressibility to the pore pressure and the confining pressure can be expressed as
where ε is the aspect ratio of fractures;andCfpp,Cfpcare the compressibility of the fractures to pore pressure and confining pressure (MPa-1),respectively.
Reorganizing Eqs.(20)-(26)and substituting them into Eq.(18),the following expression of ESCP can be solved:
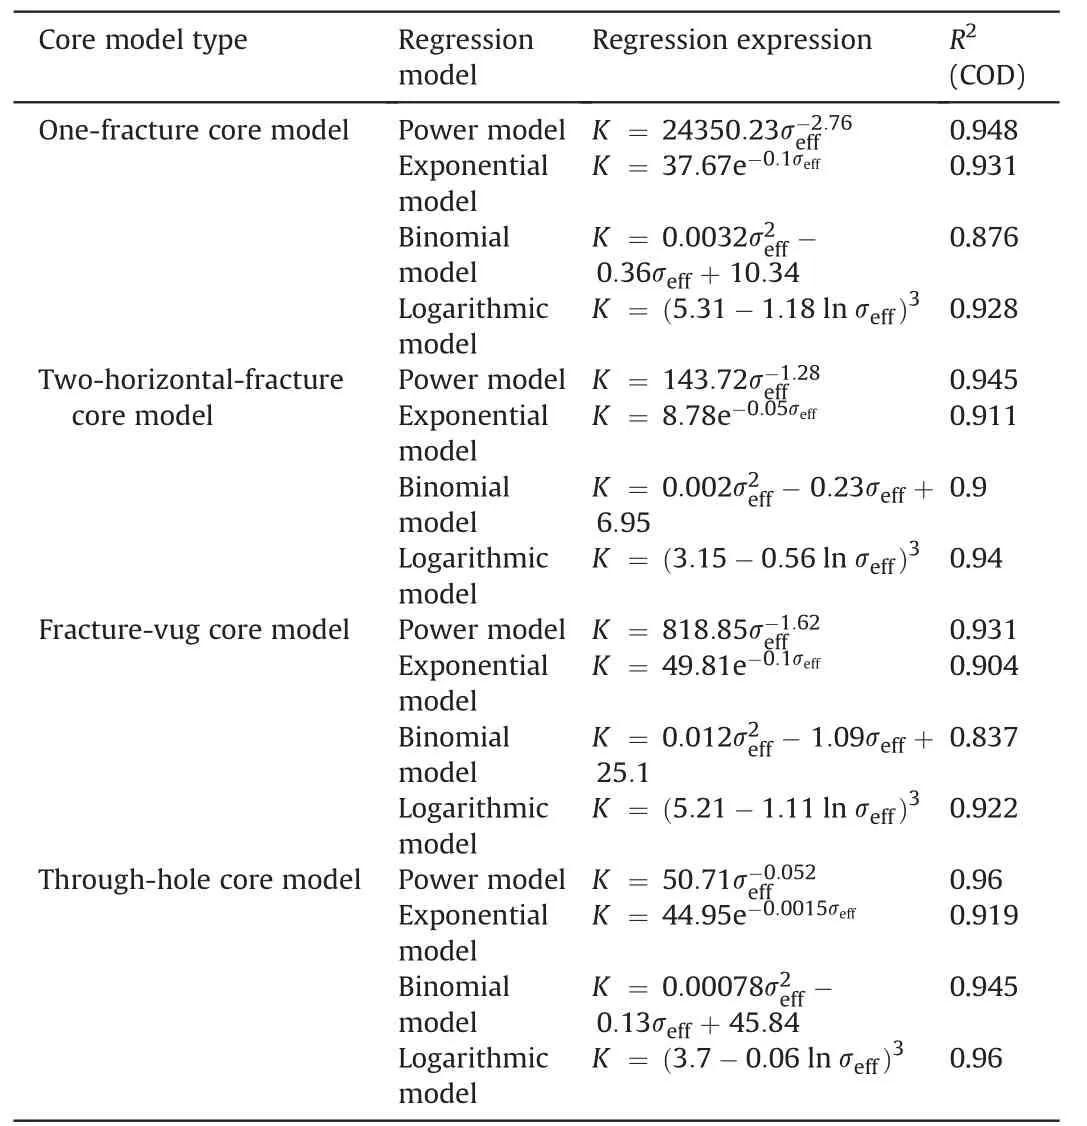
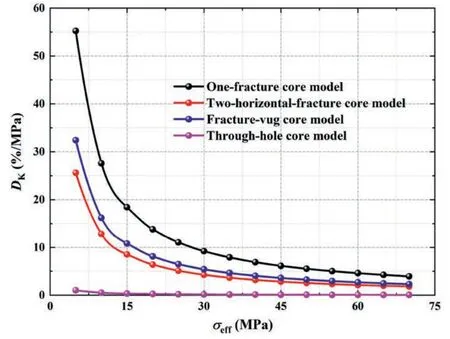
Eq.(27) is the established model of ESCP considering the influence of triple media such as matrix pores,fractures,and dissolved vugs.It can be seen that the ESCP is related not only to Poisson’s ratio but also to the dimensions of the pore,fracture,and vug structures (including the aspect ratio of fracture) and the porosity.The matrix pore size is very tiny compared to fractures and dissolved vugs.Especially for carbonate fractured-vuggy reservoirs,fluid flow in matrix pore space is often negligible (i.e.rm< In the following,two specific rock types were discussed based on Eq.(28).For fractured carbonate rocks,large-scale dissolved vugs are generally not present,but fracture networks are often developed.In one extreme scenario,assuming that only the fracture flow system exists in such reservoirs,the porosity of the dissolved vug system is equal to zero.Therefore,Eq.(28) can be simplified as follows: It can be seen that the ESCP is only related to Poisson’s ratio here,which is consistent with the results by Zhang (2018).The relationship curve between the ESCP and the Poisson’s ratio was drawn according to Eq.(29),and the results are shown in Fig.17.Obviously,the ESCP shows a monotonically decreasing law with the increase of the Poisson’s ratio.The calculated results of the theoretical model are in good agreement with the ESCP values of carbonate fractured core models obtained by experimental tests combined with RSM.Overall,the ESCP values of fractured rocks obtained by both methods vary in the range of 0-0.5,indicating that the experimental test and theoretical analysis methods proposed are accurate and reliable. For a typical carbonate fractured-vuggy reservoir,not only the matrix pore radius is extremely small,but the average fracture width (wf) in the fracture system is also much smaller than the average radius of the dissolved vugs(rv),i.e.wf< From Eq.(30),it could be found that the ESCP is related to both the Poisson’s ratio and the porosity of the dissolved vug system.Generally,the Poisson’s ratio of carbonate rocks varies in the range of 0.1-0.5.According to Eq.(30),the values of ESCP corresponding to the porosity of different dissolved vug systems under different Poisson’s ratios can be calculated.The theoretical relationship curves are shown in Fig.18. Fig.18.The theoretical relationship curve between ESCP and porosity of the dissolved vug system under different Poisson’s ratio conditions for vuggy rocks. In Fig.18,the following conclusions can be drawn: (1) The variation interval of ESCP values of carbonate vuggy rocks is 0.5 (2) Regardless of the Poisson’s ratio of rocks,there is a linear relationship between ESCP and porosity of the dissolved vug system,and the corresponding ESCP increases gradually with the increase of the system porosity;and (3) Under the same porosity of the rock system,the higher the Poisson’s ratio of rock,the higher the corresponding ESCP.In general,these insights obtained are in agreement with the experimental and analytical results. As a matter of fact,the multiplicity of storage and flow media,and the complexity of in-situ environments with high-temperature and high-pressure for carbonate fractured-vuggy reservoirs contribute to the complicated variation laws associated with the ESCP values.Despite these complexities,both experimental and theoretical analysis results have shown that the value of ESCP generally varies between 0 and 1. In order to guide the practice of oilfields,many empirical models have been developed,and are commonly used to determine the relationship between experimentally obtained permeability and effective stress of distinct reservoir rocks.Moreover,to examine the generality of these stress sensitivity models,four different kinds of empirical characterization models were mainly selected to investigate: (1) power model (Dong et al.,2010) (Eq.(31));(2) exponential model (David et al.,1994) (Eq.(32));(3) binomial model(Yin and Wang,2006)(Eq.(33));and(4)logarithmic model(Jones,1975) (Eq.(34)).The expressions of these four models are whereKrefis the permeability under the reference effective stress(mD);σrefis the reference effective stress (MPa);β and γ are the coefficients of the (general) power model and exponential model;η,θ,ω are the coefficients of the binomial model;Sis the coefficient of the logarithmic model;σeffis the effective stress (for permeability) (MPa). It was pointed out that different physical properties and rock types make the stress sensitivity performance of the reservoirs applicable to different empirical characterization models.In particular,the presence or absence of(micro)fractures in rocks can significantly affect the applicability of the characterization models.In addition to fractures,dissolved vugs of different scales and morphologies are also widely presented in carbonate fracturedvuggy reservoirs.In this section,the applicability and accuracy of these empirical models for stress sensitivity characterization in CFVR were discussed,and a concept for stress sensitivity evaluation was proposed. The effective stress for permeability after RSM correction and the measured permeability data of the four representative carbonate fractured-vuggy core models were fitted by the four empirical characterization models.More generally,the following hypothesis is proposed: where χ is the coefficient of the general power model;Krefis the permeability under the reference effective stress (mD);ξ is the coefficient of the general exponential model;and δ,ψ are the coefficients of the general logarithmic model. Then the power model (Eq.(31)),the exponential model (Eq.(32)),and the logarithmic model (Eq.(34)) can be rewritten as follows: Accordingly,Eqs.(33) and (38)-(40) were used to fit the four groups of actual data.The different regression expressions and the corresponding coefficients of determination (R2) are shown in Table 3,and the regression curves are shown in Fig.19. Table 3 Regression expressions and corresponding coefficients of determination for the four representative carbonate fractured-vuggy core models by using different empirical stress sensitivity characterization models. Fig.20 shows the coefficients of determination for different empirical stress sensitivity characterization models.It shows that the best regression results could be obtained using the power model or the logarithmic model.TheR2values for the two models are all greater than 0.920,and the accuracy is relatively higher than the other empirical models.In contrast,the binomial model shows the worst results for regression,especially for the fracture-vug core model,with coefficient of determination of 0.837.Therefore,the power model or logarithmic model is suggested to characterize the stress sensitivity of CFVR.In general,the adaptability of four main empirical representation models to CFVR from good to bad is in the following order:power model>logarithmic model>exponential model >binomial model. In fact,each of the four empirical characterization models is based on a corresponding theoretical model,and thus shows different adaptability to different types of rocks.The binomial and exponential models are derived from the capillary bundle theory model with different cross-sectional shapes (Xiao et al.,2016),so they are mainly applicable to characterize the stress sensitivity performance of porous rocks.However,both the logarithmic and power models are related to Walsh’s fracture model(Walsh,1981),so they are more suitable for characterizing the stress sensitivity offractured rocks.The matrix of CFVR is quite tight and the mobility mainly relies on the natural fracture channels with different degrees of development.Therefore,better regressions can be obtained by the power model or logarithmic model to characterize their stress sensitivity features. Because of the good adaptability and simplicity,power model was selected to further analyse and evaluate the stress sensitivity for CFVR.Based on the regression curves of the power model,the relationships between permeability and effective stress for the four representative core models are plotted,as shown in Fig.21.Although the values of rock permeability corresponding to different effective stresses can be directly obtained from the figure,the original permeability of different rocks is distinct,and the ranges and variation trends of permeability also vary considerably for different rocks. Fig.21.Variation of permeability with effective stress for the four representative carbonate fractured-vuggy core models. To quantitatively evaluate the stress sensitivity for different types of CFVR based on a unified standard,the concept of“permeability decline rate” was introduced to characterize the relative change amount in rock permeability with increasing effective stress,which is expressed by the permeability decreasing fraction within unit effective stress(DK,%/MPa): Substituting the power model Eq.(38) into Eq.(41),the corresponding expression ofDKcan be obtained: As can be seen from Eq.(42),the permeability decline rateDKis only related to the coefficient β among the power model.Under the same effective stress condition,the permeability decline rateDKincreases proportionally with te increase of the value of the coefficient β.Therefore,the value of β can be directly used to evaluate the strength of stress sensitivity for CFVR.The larger the value of β,the stronger the stress sensitivity of the tested rock;the smaller the value of β,the weaker the stress sensitivity of the tested rock. According to the calculated results,the values of β for the onefracture core model,two-horizontal-fracture core model,fracturevug core model,and through-hole core model are 2.76,1.28,1.62,and 0.052,respectively.Accordingly,it can be deduced that the stress sensitivity of the one-fracture core model is the strongest,followed by fracture-vug core model and two-horizontal-fracture core model.The stress sensitivity of the through-hole core model is the weakest.The relationships between the permeability decline rate and effective stress for the four representative core models are plotted in Fig.22. Fig.22.Variation of permeability decline rate with effective stress for the four representative carbonate fractured-vuggy core models. It could be found from Fig.22 that the main decreasing stage ofDKis concentrated when the effective stress is 0-15 MPa.When the effective stress is greater than 30 MPa,the value ofDKis generally less than 10%/MPa.When the effective stress is relatively smaller,the stress sensitivity of CFVR is stronger.Besides,the stress sensitivity is reduced gradually with the increase of effective stress.In this process,DKwould decrease rapidly at low values of σeffand level off at higher values of σeff.When the effective stress increases to 70 MPa,the values ofDKfor the four representative core models are all less than 5%/MPa,and the stress sensitivity is minimal.Therefore,in order to minimize the negative impact of stress sensitivity effect on production performance,it is necessary to control the drawdown pressure and the production rate in the early stage of effective stress increase in the carbonate fractured-vuggy reservoirs. In this study,several core models with different structure characteristics were developed to investigate the impact of effective stress on permeability for CFVR.The following conclusions can be drawn: (1) Permeability curves for the fractured core models and the vuggy core models are similar under different pore and confining pressures (i.e.different stress conditions).The ranges of permeability variation are significantly wider at high pore pressures,indicating that permeability reduction is the most significant during the early stage of development for fractured-vuggy reservoirs. (2) Since each obtained ESCP varies with the confining pressure and pore pressure,the effective stresses for permeability of the four representative CFVR show obvious nonlinear characteristics,but the variation ranges of ESCP are all between 0 and 1. (3) A mathematical ESCP model was proposed integrating the triple mediums such as matrix pores,fractures and dissolved vugs,which is theoretically proved that the ESCP of CFVR generally varies between 0 and 1. (4) The adaptability of four main empirical stress sensitivity models to CFVR is in the following order: power model>logarithmic model>exponential model>binomial model. (5) The concept of“permeability decline rate”was introduced to evaluate the stress sensitivity performance for CFVR,in which the one-fracture rock was the strongest,followed by the fracture-vug rock and the two-horizontal-fracture rock,and the through-hole rock is the weakest. Declaration of competing interest The authors declare that they have no known competing financial interests or personal relationships that could have appeared to influence the work reported in this paper. Acknowledgments This work was supported by the Joint Fund of NSFC for Enterprise Innovation and Development (Grant No.U19B6003-02-06),the National Natural Science Foundation of China (Grant No.51974331),and the Natural Science Foundation of Jiangsu Province(Grant No.BK20200525).The authors would like to sincerely acknowledge these funding programs for their financial support.Particularly,the support provided by the China Scholarship Council(CSC) during a visit of Ke Sun (File No.202106440065) to the University of Alberta is also sincerely acknowledged. List of symbols aiCoefficients of the quadratic surface (i=1-6) AbCross-sectional area of rock(mm2) AvDissolved vug area in rock cross-section (mm2) cbCompressibility of rock volume (MPa-1) csCompressibility of skeletal particles (MPa-1) CfpcCompressibility of fractures to confining pressure(MPa-1) CfppCompressibility of fractures to pore pressure (MPa-1) CmpcCompressibility of pores to confining pressure (MPa-1) CmppCompressibility of pores to pore pressure (MPa-1) DKPermeability decline rate(%/MPa) EElastic modulus of rock (MPa) KRock permeability (mD) KTTransformed permeability KfPermeability of fracture system (mD) KmPermeability of matrix pore system(mD) KrefPermeability under reference effective stress(mD) KtIntegrated permeability of the triple media (mD) KvPermeability of dissolved vug system(mD) lLength of fractures in rock cross-section mNumber of dissolved vugs in rock cross-section nNumber of capillaries in rock cross-section pInternal stress(pressure)(MPa) pcConfining pressure(MPa) ppPore pressure (MPa) QA certain physical property of a porous solid r1Inner radius of circular ring (mm) r2Outer radius of circular ring (mm) rbOuter boundary of surrounding medium (mm) rmAverage pore radius of matrix pore system(mm) rvAverage vug radius of dissolved vug system(mm) SCoefficient of logarithmic model urRadial displacement at pointrof circular ring (mm) VbTotal rock volume (mm3) VvDissolved vug volume(mm3) wfAverage fracture width of fracture system(mm) α Biot coefficient β Coefficient of (general)power model γ Coefficient of (general)exponential model δ,ψ Coefficients of general logarithmic model ε Aspect ratio of fractures η,θ,ω Coefficients of binomial model k Effective stress coefficient for permeability λ Transformation power ν Poisson’s ratio of rock ξ Coefficient of general exponential model σ External stress (pressure)(MPa) σeffEffective stress(for permeability) (MPa) σnetNet stress(MPa) σrefReference effective stress(MPa) φfPorosity of fracture system φmPorosity of matrix pore system φvPorosity of dissolved vug system χ Coefficient of general power model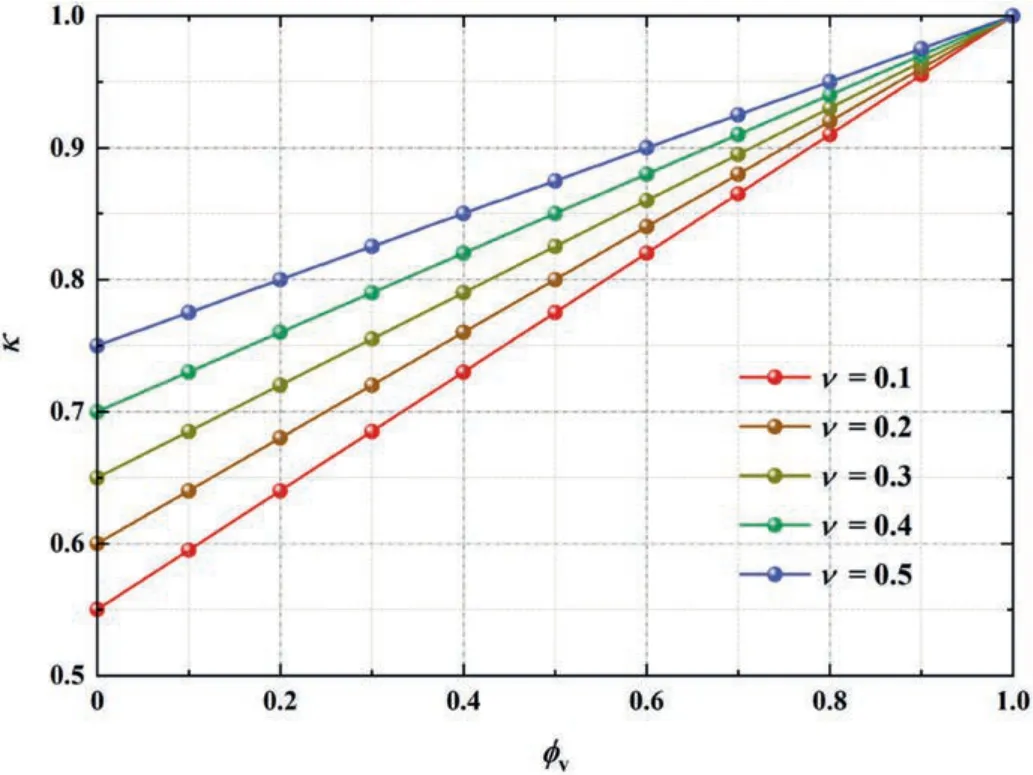
5.Stress sensitivity evaluation models
5.1.Regression analysis with empirical models
5.2.Evaluation with permeability decline rate

6.Conclusions
 Journal of Rock Mechanics and Geotechnical Engineering2024年3期
