Mechanical behaviors of backfill-rock composites:Physical shear test and back-analysis
Jie Xin,Qun Jing,Fengqing Gong,Lng Liu,Chng Liu,Qing Liu,Yo Yng,Pengfei Chen
a State Key Laboratory of Geomechanics and Geotechnical Engineering,Institute of Rock and Soil Mechanics,Chinese Academy of Sciences, Wuhan,430071,China
b University of Chinese Academy of Sciences, Beijing,100049, China
c School of Civil Engineering, Southeast University, Nanjing, 211189, China
d Energy School, Xi’an University of Science and Technology, Xi’an, 710054, China
Keywords: Physical simulation Backfill-rock composites Shear failure Cracking Shear constitutive model
ABSTRACT The shear behavior of backfill-rock composites is crucial for mine safety and the management of surface subsidence.For exposing the shear failure mechanism of backfill-rock composites,we conducted shear tests on backfill-rock composites under three constant normal loads,compared with the unfilled rock.To investigate the macro-and meso-failure characteristics of the samples in the shear tests,the cracking behavior of samples was recorded by a high-speed camera and acoustic emission monitoring.In parallel with the experimental test,the numerical models of backfill-rock composites and unfilled rock were established using the discrete element method to analyze the continuous-discontinuous shearing process.Based on the damage mechanics and statistics,a novel shear constitutive model was proposed to describe mechanical behavior.The results show that backfill-rock composites had a special bimodal phenomenon of shearing load-deformation curve,i.e.the first shearing peak corresponded to rock break and the second shearing peak induced by the broken of aeolian sand-cement/fly ash paste backfill.Moreover,the shearing characteristic curves of the backfill-rock composites could be roughly divided into four stages,i.e.the shear failure of the specimens experienced:stage I:stress concentration;stage II:crack propagation;stage III: crack coalescence;stage IV: shearing friction.The numerical simulation shows that the existence of aeolian sand-cement/fly ash paste backfill inevitably altered the coalescence type and failure mode of the specimens and had a strengthening effect on the shear strength of backfillrock composites.Based on damage mechanics and statistics,a shear constitutive model was proposed to describe the shear fracture characteristics of specimens,especially the bimodal phenomenon.Finally,the micro-and meso-mechanisms of shear failure were discussed by combining the micro-test and numerical results.The research can advance the better understanding of the shear behavior of backfill-rock composites and contribute to the safety of mining engineering.
1.Introduction
Backfill mining is a commonly used method in underground mines,effectively disposing of solid waste,reducing surrounding rock deformation,and controlling surface subsidence(Benzaazoua et al.,2002;Koupouli et al.,2016).The mined-out area is filled with backfill materials to form backfill-rock composites(B-R).However,the structural instability or failure of B-R not only endangers mining operations but also poses a significant threat to the safety of miners’lives and property,resulting in substantial economic losses to the mine (Fall and Benzaazoua,2005;Fall et al.,2005).Shear failure is a typical failure mode of B-R,leading to the structural instability of the surrounding rock (Jiang et al.,2017,2021).For example,in Jinchuan No.2 mine,the pronounced dislocation deformation of B-R caused by shear stress has led to large-area collapse (Ma et al.,2019).Therefore,understanding and revealing the shear mechanism of B-R is of great significance to the management of underground engineering.
To date,studies on strength characteristics and fracture behavior of B-R have been constructive,involving various loading tests,including uniaxial compression test (Sun et al.,2018;Wang et al.,2021;Zhao,2021),triaxial compression test (Wu et al.,2021a;Yu et al.,2021) and fracture toughness test (Fang and Fall 2020).For example,Wang et al.(2021) investigated the failure behavior of B-R under uniaxial compression and found that B-R exhibited a mode of tensile-shear mixed failure,with the damage process dominated by backfill and the final failure controlled by rock.Yu et al.(2021)conducted triaxial compression tests on B-R,indicating that both the rock and the rock-backfill interface fractured,while the interior of the backfill remained relatively intact.Fang and Fall (2020) studied the mode I and mode II fracture toughness of the B-R interface,revealing that temperature and sulfate ions significantly affected the evolution of the fracture toughness.These studies have provided pioneering insights into BR,focusing on compression characteristics,fracture behavior,and failure modes.
However,in practical backfill mining operations,where the environment is dominated by shear stress,roadway roofs and surrounding rock’s free surface exhibit complex instability phenomena and failure modes along the B-R interface.This highlights the need for academia and industry to fully recognize the importance of B-R’s shear failure.Nonetheless,investigations into the shear behavior of B-R have recently been initiated,primarily covering studies on curing times (Koupouli et al.,2016),temperature (Fang and Fall 2018),raw material recipes (Zhao et al.,2022),and interface angles(Wu et al.,2021b).For example,Koupouli et al.(2016) investigated the shear characteristics of backfill-rock and backfill-backfill interfaces,finding that the shear strength at backfill-backfill interface was higher than that at backfill-rock interface in curing time of 3 d and 7 d.Fang and Fall (2018)explored the role of curing temperature on the shear behavior of the backfill-rock interface,revealing that a higher curing temperature could increase the peak shear stress at the backfill-rock interface.However,comprehensive studies involving the shear characteristic curve,acoustic emission (AE) characteristics,failure mode,and micro-and meso-failure mechanisms of large-scale backfill-rock composites subjected to shear loading are still lacking.Furthermore,there exists a research gap in developing a shear constitutive model of B-R.
To gain a deeper understanding of the evolution process of shear failure under shear loading,we conducted laboratory shearing tests on both unfilled-rock(U-R)and B-R specimens.The shear tests on U-R and B-R specimens,subjected to constant normal loads,were performed using a shear apparatus.The macro-and meso-features of the specimens were synchronously recorded using a high-speed camera and AE system.Additionally,a scanning electron microscope(SEM)was used to investigate the micro-mechanism of shear failure.Furthermore,we used numerical modeling to investigate the stress field and meso-mechanism of U-R and B-R using the discrete element method(DEM).Finally,we proposed a novel shear constitutive model to investigate the shear behavior of the specimens.Finally,we established a revised Mohr-Coulomb criterion to estimate the shear strength of the specimens.
2.Materials and methods
In mining backfill practices,fly ash(FA),aeolian sand(AS),52.5 ordinary Portland cement (P.O 52.5),and tap water were used to prepare aeolian sand-cement/fly ash paste backfill(ACFPB),and the physico-chemical properties of raw materials were elaborated.Additionally,the machining process and physico-chemical properties of U-R were described.Finally,the experimental scheme and set-up were introduced.
2.1.Experimental materials
2.1.1.Raw materials
We evaluated the physical characteristics of FA,AS,and P.O 52.5 using a particle-size laser scanner (Malvern Mastersizer 2000,England),as shown in Fig.1a.According to Fig.1a,the uniformity coefficient of FA,AS,and P.O 52.5 were 7.02,6.69,and 2.24,respectively,all of which conformed to the Talbot equation(Jackson and Talbot,1986).However,the particle size distribution curve showed that FA and AS had relatively low coarse particle content,whereas P.O 52.5 had a relatively high coarse content,which improved the particle gradation of ACFPB.Furthermore,XRF(WISDOM-1000,China)and XRD (D/Max-3B,Japan) were adopted to analyze the chemical properties of raw materials (Table 1 and Fig.1b).Specifically,Fig.1b shows the main chemical composition of FA,with the primary phase being CaO.

Table 1 Oxide compositions of raw materials.

Fig.1.Physico-chemical characteristics of raw materials: (a) PSD and (b) XRD.
2.1.2.Red sandstone
According to literature (Gong et al.,2018;Xin et al.,2023) and experimental design,red sandstone was selected as the test material due to its brittle,homogeneous,and easily accessible nature.The petrography of the sandstone was examined through petrographic images,as illustrated in Fig.2.The analysis revealed that the sandstone was mainly composed of quartz (60%),and the mineral particle size ranging from 0.06 mm to 0.5 mm,classifying it as fine-grained feldspathic quartz sandstone (Wu et al.,2021a).In accordance with the International Society for Rock Mechanics(ISRM)(Aydin,2009),the mechanics parameters of sandstone were tested,and the results are summarized in Table 2.

Table 2 Basic mechanical parameters of red sandstone.

Fig.2.Petrographic analysis of sandstone: (a) Plane polarized light,and (b) Cross polarized light.
2.2.Experimental scheme
To prepare the U-R specimen for the shear box,we manufactured cuboid specimens with dimensions ofL×W×H=300 mm×200 mm×200 mm.Similarly,the minedout area was also cuboid,with dimensions ofL×W×H=60 mm × 60 mm × 200 mm.The specimens underwent elaborate processing to achieve the desired surface roughness and curvature,following the guidelines of GB/T 50266 (2013).The prepared U-R specimen is shown in Fig.3a.According to Zhou et al.(2020),the ACFPB slurry is mixed according to the proportions outlined in Table 3.Subsequently,the U-R was injected with ACFPB slurry and then cured for 28 d (Fig.3b).

Table 3 Mix proportions of aeolian sand-cement/fly ash paste backfill (ACFPB).
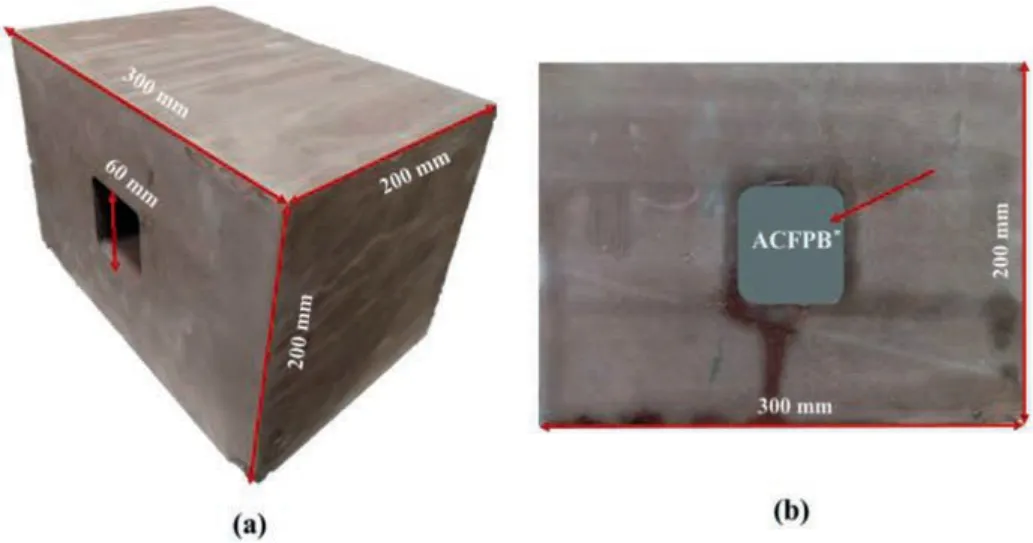
Fig.3.Red sandstone specimens and dimensions: (a) Unfilled rock,and (b) Backfillrock composites.
2.3.Experimental set-up
We conducted the shear test using a self-developed large-scale direct shear device.This servo-driven shear test device was equipped with an observation window to facilitate the inspection of the failure evolution of specimens.
The normal stresses were set as 2 MPa,3.5 MPa and 5 MPa,respectively,and the shear rate was 0.005 mm/s.Meanwhile,a high-speed camera was used to record the cracking evolution of the sample.The parameters of high-speed imaging are:resolution=1080 pixels per inch,and frame rate=120 frame per second.To monitor micro-crack events during the shearing process,two AE sensors were installed on both sides of the specimen,with a detection threshold set to 45 dB to mitigate possible environmental noise (Wu et al.,2019).Finally,we utilized SEM to scan the exfoliated rock and observe fracture morphology.The entire test procedure is illustrated in Fig.4.
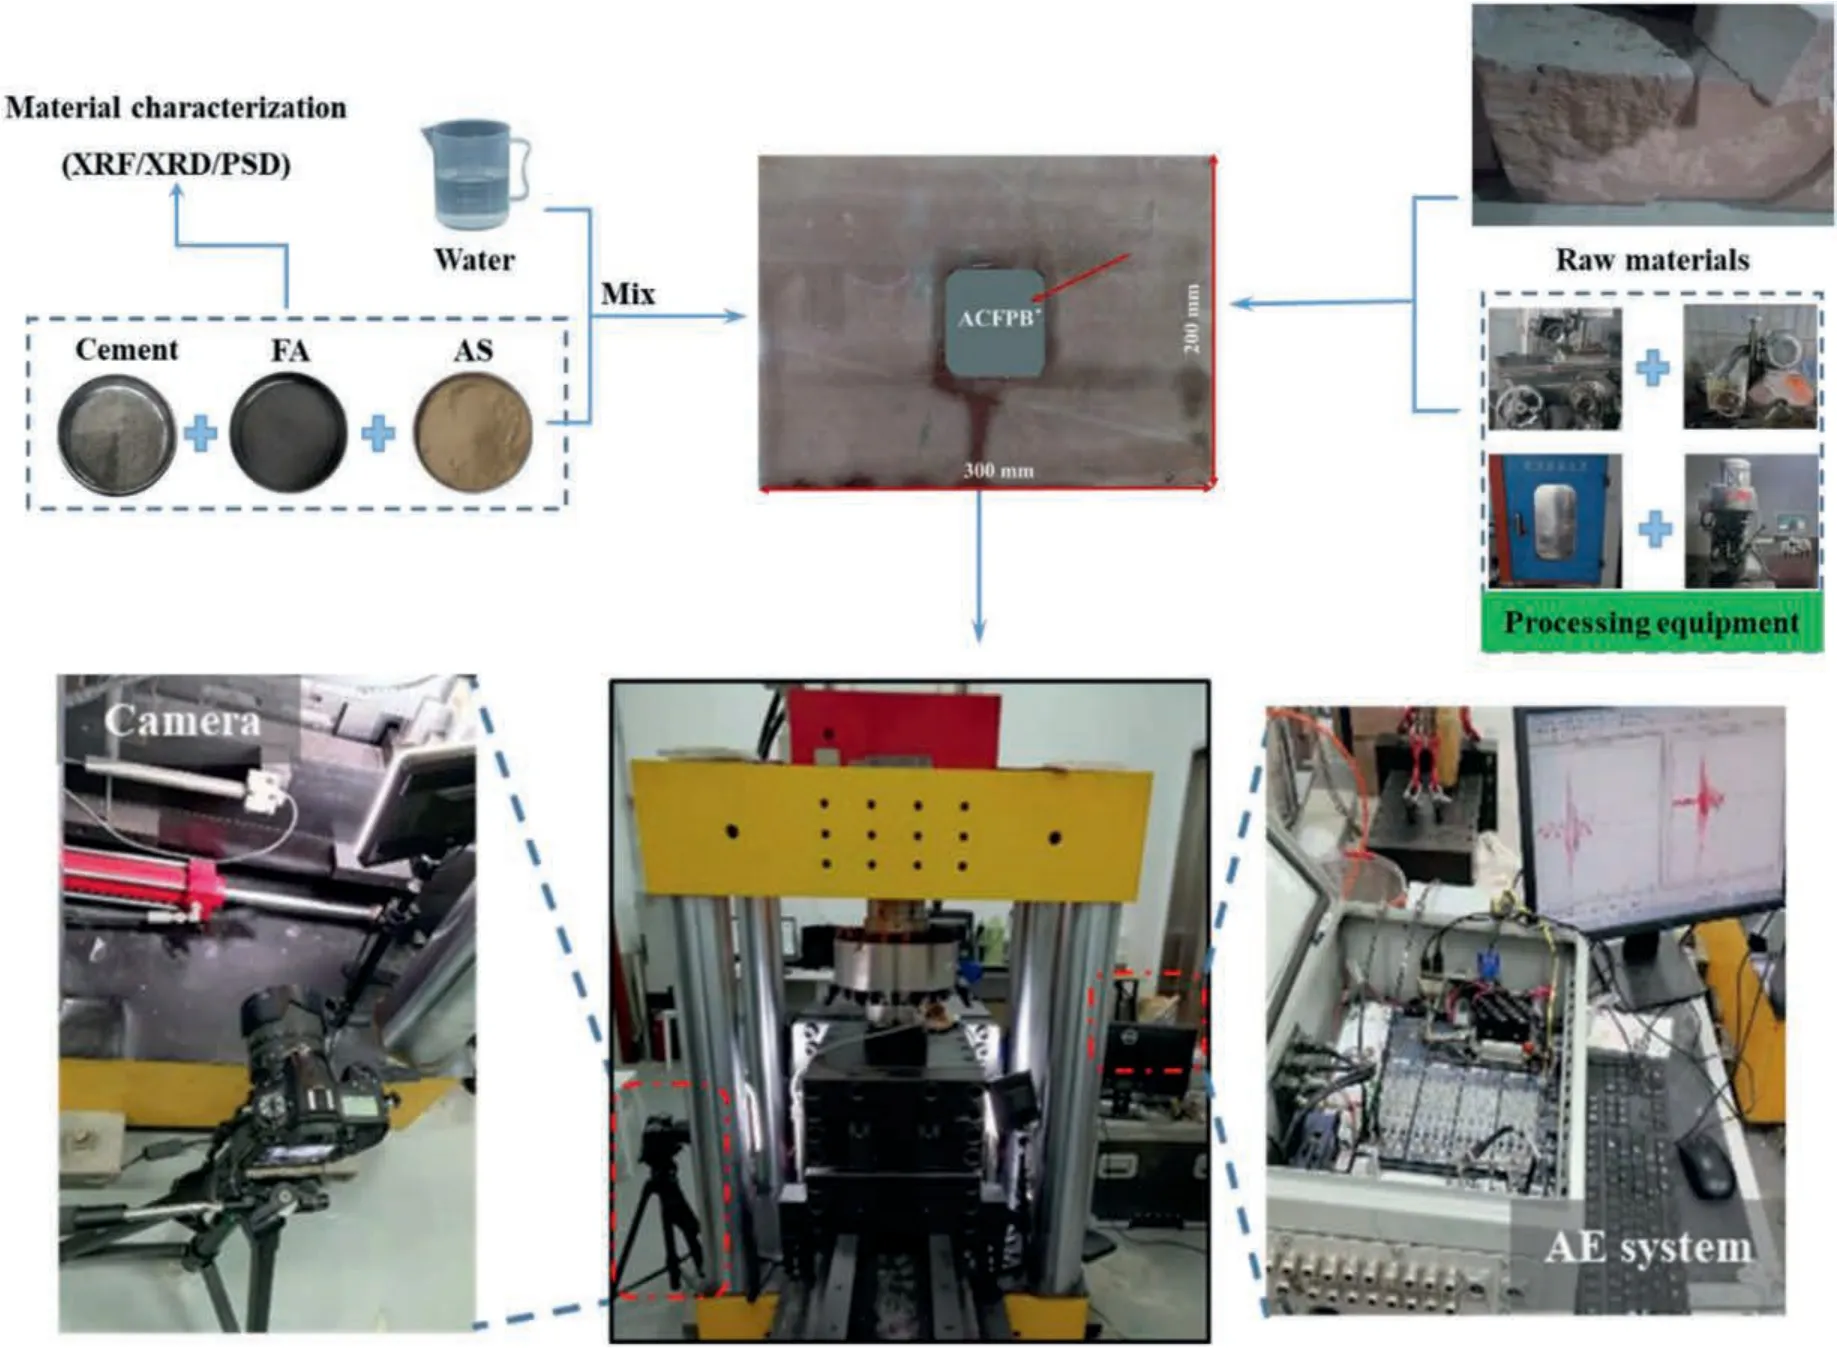
Fig.4.Experimental flow chart.
3.Experiment results and analysis
Following the proposed experimental scheme,the macro-and meso-shear failure features of both U-R and B-R specimens were detected,including the shearing characteristic,shear strength,shear modulus,AE temporal curves,crack propagation,and failure mode.Furthermore,based on SEM,the micro-mechanism of shear failure in the specimen was analyzed.
3.1.Shear deformation characteristics
In the shear experiment,the linear variation transformer and the loading cell are used to record the shearing characteristic.The shear stress is obtained by dividing the shearing load by the corrected shearing area.We conducted shear tests on U-R and B-R specimens under three constant normal loads.The shearing characteristic curve is presented in Fig.5.In addition,peak shear stress(τp),Shear modulus(G),peak strain(εp),and type of shear behavior are summarized in Table 4.

Table 4 Summary of shear test results.
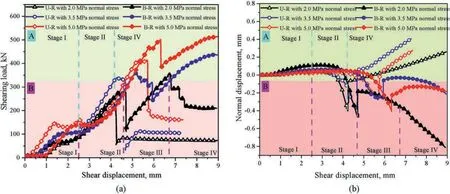
Fig.5.Results of the shear test on specimens: (a) Shear stress-displacement curves,and (b) Dilation behavior curves.
In the shear test,the shearing load increased to the peak shearing load and then decreased sharply (Fig.5),which is consistent with the typical curve of shear characteristics under low normal stress (Tian et al.,2015;Mouzannar et al.,2017).After reaching the peak shearing load,a nonlinear relationship between shearing load and displacement emerged,leading to two typical shear behaviors: labeled as A (unfilled rock) and B (backfill-rock composites).Notably,Fig.5 shows the four typical stages of U-R(A in yellow)and B-R(B in red)specimens under 2 MPa normal stress.
(1) Typical curve "A" -The shearing load-deformation curve of U-R samples exhibited similar characteristics in Fig.5,i.e.shear single peak.From shear loading to crack initiation(stage I),the specimens were in contact compression subjected to shear loading.From the crack initiation to the first shearing peak(stage II),the shearing load-deformation was a non-linear behavior,that was,large numbers of cracks initiated in stage II,mainly manifested in the unstable propagation and coalescence of cracks.After reaching the peak shearing load,the shearing load sharply dropped,indicating a typical brittle failure.In the post-peak stage(stage IV),the specimens were subjected to shearing friction,driven by the friction characteristics of rock particles(Tembe et al.,2010).It is worth noting that the transition from the first shearing peak to the second shearing peak(stage III)was not obvious for the U-R specimens.
(2) Typical curve "B" -the shearing load-deformation curve of B-R specimens exhibited similar features in Fig.5,with a bimodal pattern.The first shearing peak corresponded to the breakage of the rock,while the second shearing peak corresponded to the breakage of ACFPB.In other words,there was a transformation in the shear surface,resulting in increasing normal displacement,but the B-R specimens remained in a state of shear contraction.However,this finding contrasts with the results reported by De Toledo et al.(1993) and Indraratna et al.(2013).The test also indicated that U-R specimens followed a typical failure process from shear failure to shear friction,while B-R specimens exhibited a typical failure process from double shear failure to shear friction.Table 4 summarizes the shear characteristic parameters of specimens.Notably,the shear strength of B-R(Shear behavior: A) was larger than that of U-R (Shear behavior: B),and the strength increase rate was between 3.77% and 12.21%.This improvement is attributed to the presence of ACFPB in the U-R specimens,which contributes to partial shear strength and is reflected in the bimodal shear behavior observed in Fig.5.
3.2.Acoustic emission characteristics and crack evolution
To elucidate the cracking process,taking the results of U-R with 2 MPa normal stress and B-R with 2 MPa normal stress as examples,the failure features of specimens are summarized.These two kinds of specimens exemplify the crack coalescence type and failure mode of specimens discussed in Section 3.3.Fig.6 shows the curves of shearing load and AE temporal.Fig.7 highlights key points in the shearing load curve and provides corresponding video images that aid in visualizing the process.
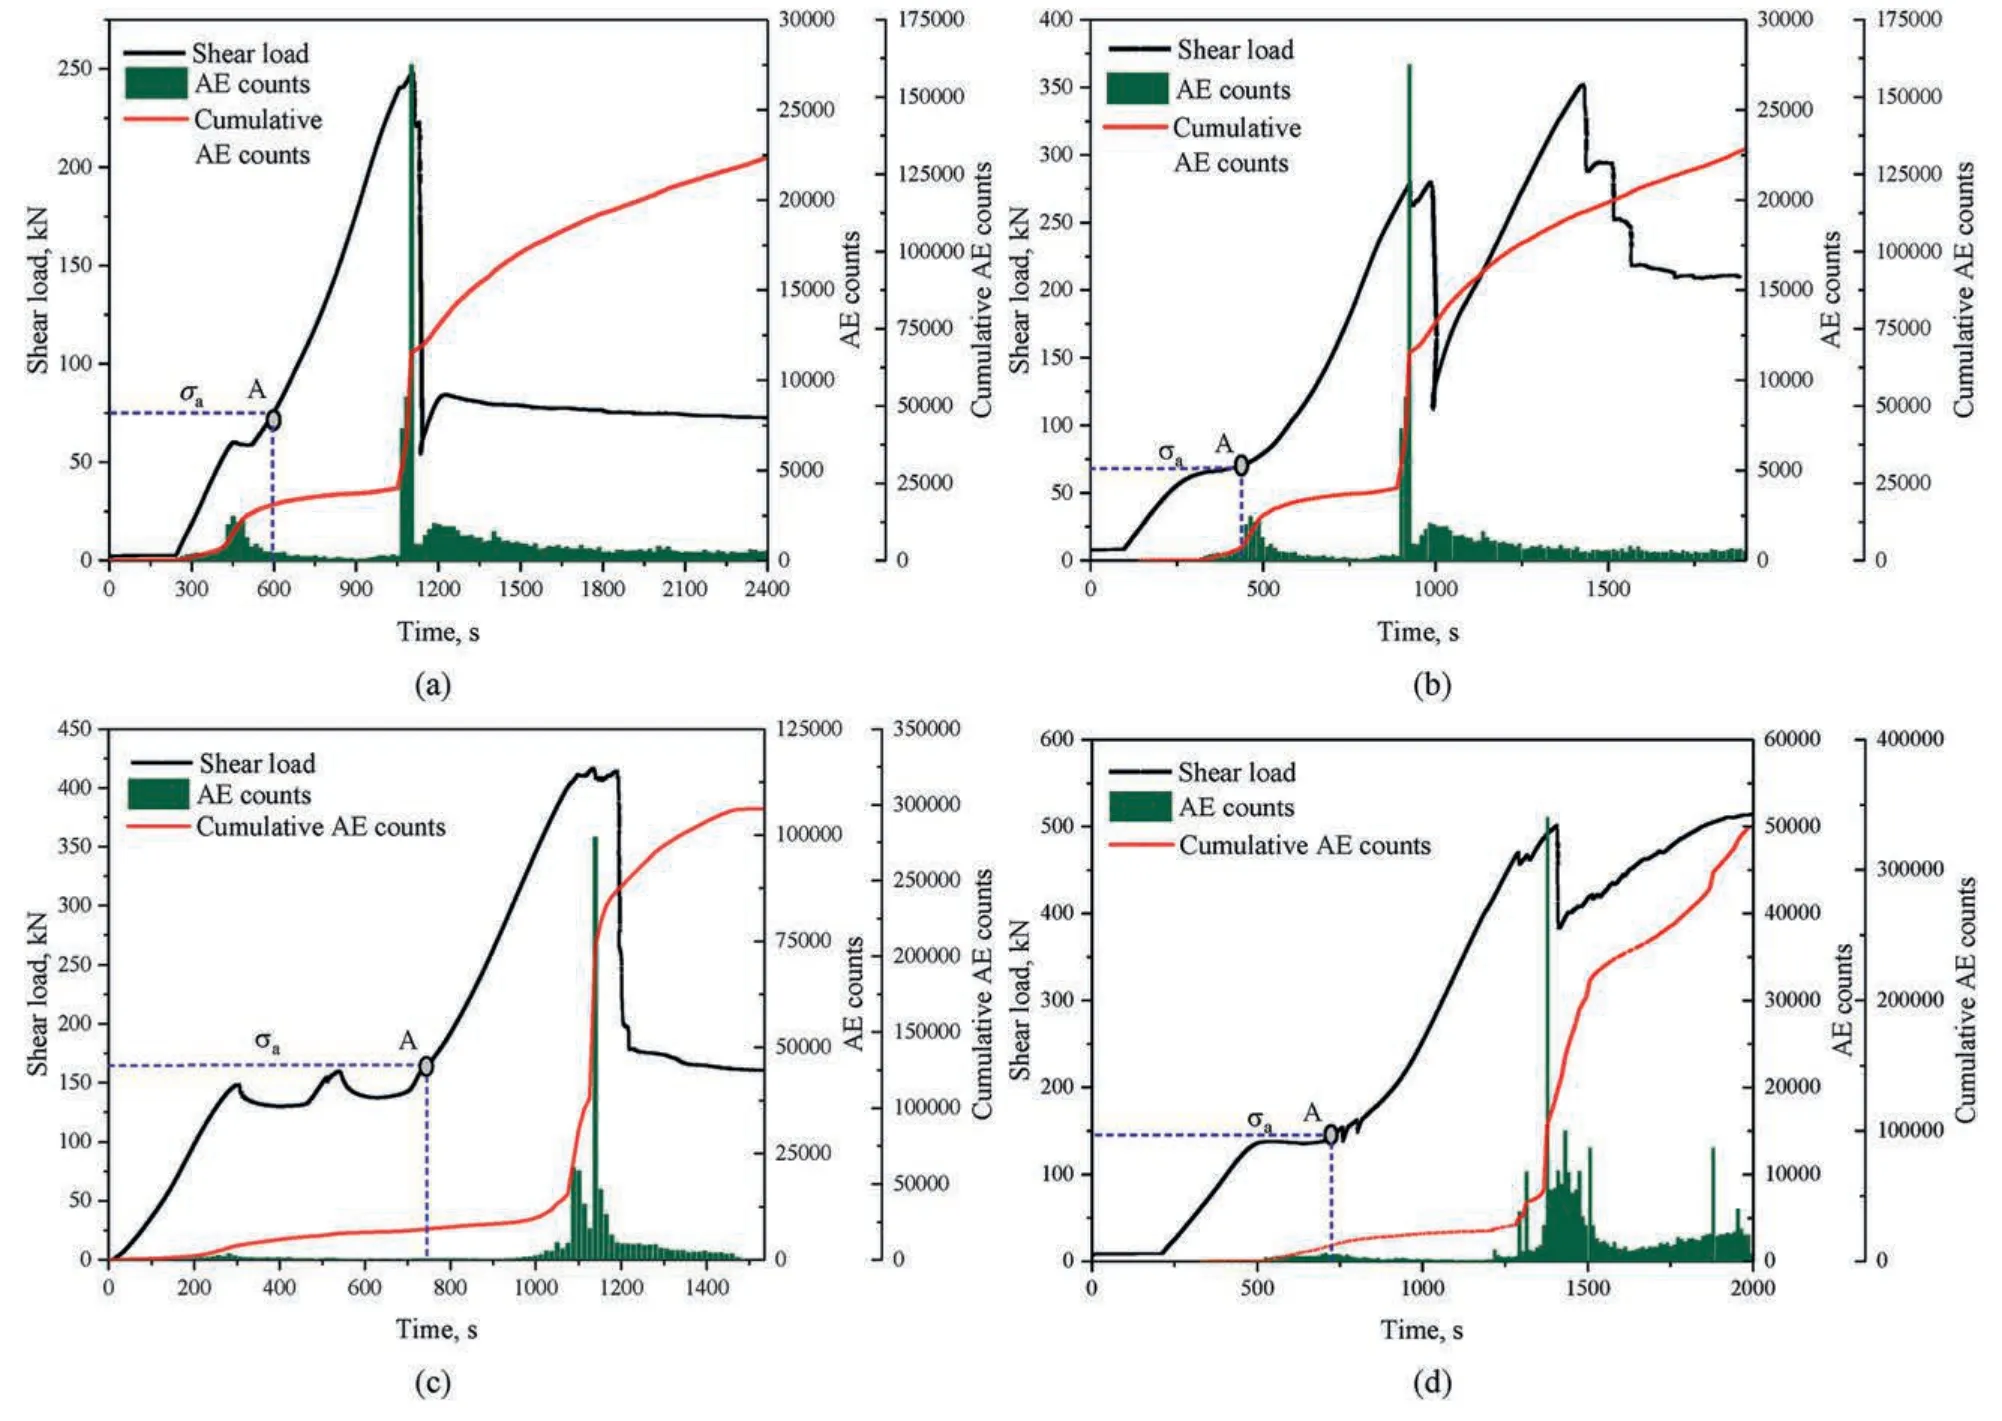
Fig.6.AE counts and cumulative AE counts of specimens:(a)Unfilled rock with 2 MPa normal stress,(b)Backfill-rock composites with 2 MPa normal stress,(c)Unfilled rock with 5 MPa normal stress,and (d) Backfill-rock composites with 5 MPa normal stress.

Fig.7.Shear failure processes of the specimens: (a) Unfilled rock with 2 MPa normal stress,(b) Backfill-rock composites with 2 MPa normal stress,(c) Unfilled rock with 5 MPa normal stress,and (d) Backfill-rock composites with 5 MPa normal stress.
Fig.6a presents the shearing load curve and AE characteristics of the U-R specimen under 2 MPa normal stress during the shearing process,and the corresponding crack evolution is shown in Fig.7a.In stage I(0-688.87 s),the sample showed no obvious damage,and the number of AE counts detected was minimal(Fig.6a).However,two stress concentration areas emerged.One was located at the upper left angle (ULA) of the mined-out area and the other was located at the lower-right angle (LRA) of the mined-out area,evolving along the boundary at both ends of the specimen along the loading direction.This phenomenon resulted from the generation of tensile stress at the corner of the mined-out area under compressive stress in the central area of the specimen(Yang et al.,2019b),as shown in Fig.7a1.Notably,the initiation stress is an important characteristic parameter characterizing crack initiation(Wu et al.,2020a),corresponding to point A in Fig.6.As shear deformation increased,the sample entered stage II (688.87-1384.47 s).During this stage,two tensile cracks,labeled as 1aand 1binitiated at the ULA and the LRA of the mined-out area.Meanwhile,shear cracks 2aand 2bwere initiated and linked to 1aand 1b,eventually merging quasi-tensile-shear crack (Fig.7a2).However,very few AE counts were detected at this stage,indicating relatively stable crack evolution.Subsequently,shear cracks 2aand 2bpropagated steadily,and a secondary shear crack 2cwas initiated on the left side of 2a,eventually merging into shear bands.Block debris spalling suddenly occurred on both sides of the mined-out area,as shown in Fig.7a3.During this stage,numerous AE signals were detected,reflecting the non-linear behavior (Taheri et al.,2016).With continuous loading,1a,2band 2ccoalesced the left middle boundary of the mined-out area and the ULA,while 1band 2bcoalesced with the right-middle boundary of the mined-out area with LRA.At this point,the AE counts rapidly increased to a higher level,triggered by the overall instability of the sample.Finally,the shearing load-deformation curve entered stage IV,and the overall strength of the specimen decreased to residual strength,but it remained in a state of shear friction.
Fig.6b presents the shearing load curve and AE characteristics of B-R specimens under 2 MPa normal stress during the shearing process,and the corresponding crack evolution is shown in Fig.7b.Similar to the U-R specimen with 2 MPa normal stress,there was a stress concentration area at the ULA of mined-out area.However,another stress concentration area was observed at the URA of the mined-out area,influenced by the presence of the ACFPB,as shown in Fig.7b1.To analyze these stress concentration areas,strain gauges (SG) were employed during stage I.Fig.8 shows the strain variation curve of the B-R specimen under 2 MPa normal stress,where a sharp increase in strain value indicated the failure of SG(Weng et al.,2018).Notably,SG2 and SG1 failed earlier than other SG,suggesting the existence of a stress concentration area in ULA of the mined-out area.Moreover,the initiation and propagation of cracks were driven by tensile stresses parallel to the loading direction,as indicated by the positive SG values.As the specimen entered stage II (947.66-1414.61 s),a tensile crack 1aand a shear crack 1binitiated at the ULA and the URA of the mined-out area.Subsequently,a secondary shear crack 2bappeared on the right side of 2a,resulting in rock spalling (3a) and the formation of a quasitensile-shear crack.During this stage,a significant increase in AE counts occurred,signaling localized instability in the B-R specimen.With the progression of shear deformation,the test entered stage III (1414.61-1479.65 s),and exfoliated rock 4aappeared on the surface of the ACFPB.Tensile cracks 1a-1bcoalesced with the ACFPB,leading to the formation of more spalling blocks 4band 4caround 4a,which merged into larger spalling,resulting in pronounced local instability of the ACFPB.2ccoalesced the left middle boundary of the mined-out area with LLA,and 1a-1b-2b-2a-3acoalesced with the entire specimen.This process was accompanied by the continuous appearance of AE signals,associated with the overall instability of the specimen.Finally,the test entered stage IV,and its overall strength decreased to the residual strength.However,due to the fragmentation and rolling of hard and brittle mineral components such as quartz and feldspar during the shear friction process (Meng et al.,2016),the AE counts remained relatively high but tended to stabilize,although they were higher than those in stage I.
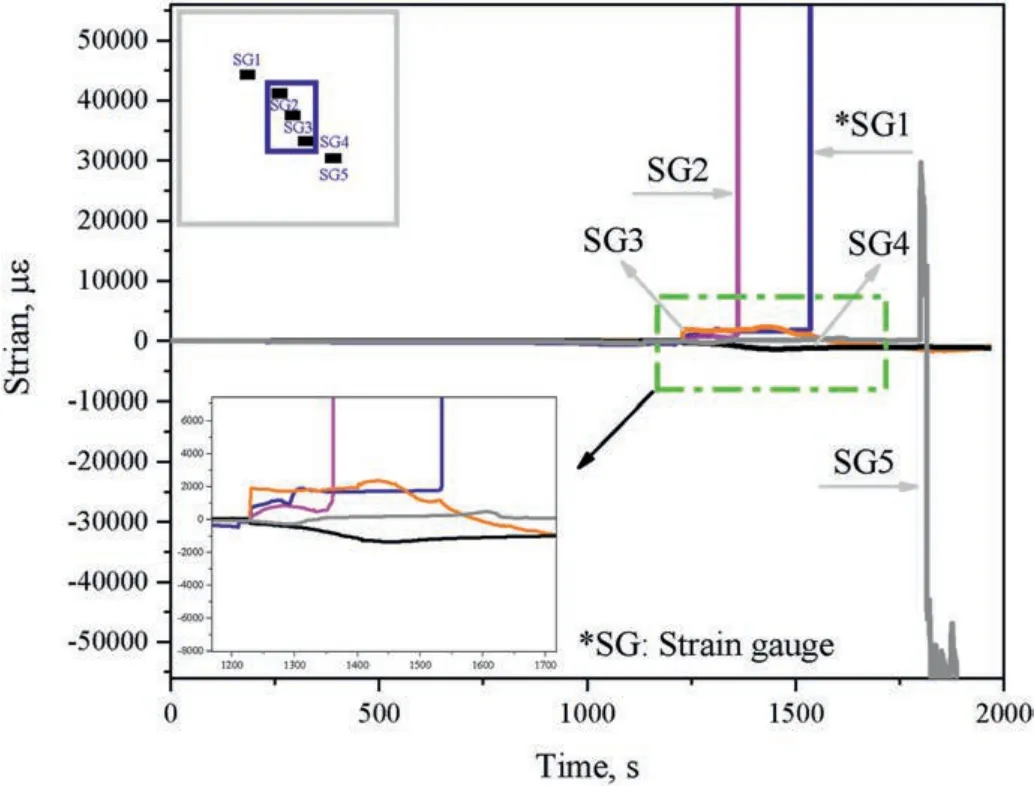
Fig.8.Strain variation curve of backfill-rock composites with 2 MPa normal stress.
RA and AF values serve as fundamental parameters for analyzing shear fracture mechanisms.As described by Eqs.(1)-(3),a large signal RA value combined with a small AF value indicates that the AE signal exhibits shear wave characteristics,which is referred to as shear fracture.Conversely,if the conditions are reversed,it signifies tensile fracture (Rodríguez and Celestino,2019).Fig.9 illustrates the distribution of RA and AF values of B-R specimens under 2 MPa and 5 MPa normal stresses.The distribution patterns of RA and AF values under different normal loads were found to be roughly similar.In both cases,there were roughly equal RA values and AF values i.e.suggesting a tensile-shear mixed failure.This observation aligns with the research findings of Yu et al.(2021).

Fig.9.RA and AF distribution of specimens.
3.3.Failure mode
Based on the research results(Fan et al.,2022),the definition of tensile crack and shear crack was clearly stated.By analyzing the fracture characteristics of the typical specimens(Fig.10),the failure modes were deduced.The green line,red line,and yellow line were the main cracks,and the brown area was the rock debris spalling area.Notably shear failure modes were predominantly characterized by the presence of main crack and debris spalling.According to the findings summarized in Fig.10,the typical failure modes of U-R and B-R specimens were identified as the shear-dominated mixed failure mode with quasi-central symmetry and tensile-shear mixed failure,respectively.This difference was likely attributed to the influence of ACFPB which changed the failure mode from sheardominated mixed failure (U-R) to tensile-shear mixed failure (BR),in contrast to the findings reported by Wang et al.(2020).

Fig.10.Failure modes of specimens:(a)Shear-dominated mixed failure,(b)Tensile-shear mixed failure,(c)Shear-dominated mixed failure,and(d)Tensile-shear mixed failure.①-crumb flaking area;②-quasi-tensile-shear crack;③-oblique secondary crack;④-quasi-coplanar secondary crack;⑤-quasi-tensile-shear secondary crack;⑥-quasi-oblique secondary crack;⑦-shear crack;⑧-tensile crack.
3.4.Micro-mechanism of shear fracture
The micro-mechanism of shear failure in the specimens were investigated using SEM,and the fracture morphology of typical exfoliated rock was presented in Fig.11.Combining these observations with Fig.2,we can identify the major components of red sandstone as quartz,potash feldspar,plagioclase,and a small amount of muscovite.In Fig.11a-e,the basic structural units of the exfoliated rock primarily appeared as irregular block structures randomly distributed throughout the sample.These block structures in the basic units were usually characterized by edge-plane,edge-edge,and plane-like shapes.Some areas even exhibited a flocculation-like structure.Additionally,the fracture morphology of exfoliated rocks revealed typical tensile failure characteristics including cleavage fracture,intergranular fracture,and their coupling forms,such as tongue-like,fishbone-like,root-like,steplike,and grain boundary fracture morphologies.Notably,the formation of step-like morphology was attributed to the susceptibility of potassium feldspar,a weak mineral particle,to stress perpendicular to the layer under shearing load (Zang et al.,1996),as illustrated in Fig.11.The interlayer potassium ion bond of potassium feldspar was provided by a relatively weak Coulomb force(Hull,1999),making micro-fractures more likely to occur inside the specimen.However,the step-like morphology formed after the fracture of potassium feldspar particles represented a small-scale fracture.Moreover,there were also typical shear fracture characteristics,including serpentine sliding morphology and parallel sliding line morphology.Quartz mineral particles tended to fracture along their internal discontinuities or boundaries under shearing load.These fracture surfaces were typically flat and rough(Fig.11),consistent with the typical feature of quartz fracture morphology(Zhang and Zhao,2014).Given that quartz was the predominant mineral in red sandstone,its fracture surface often passes through quartz particles,causing significant internal damage due to the higher strength of quartz particles compared to potassium feldspar particles.Finally,SEM analysis of the ACFPB(Fig.11f)revealed that the shear strength of ACFPB was enhanced by the hydration products (C-S-H,AFt,and CH) (Ruan et al.,2023a,2023b),contributing to the improved shear strength of the backfill-rock interface.In summary,the micro-mechanisms contributing to shear failure in the specimens were the results of combined tensileshear failure processes induced by the directional movement,rotation,and fragmentation of particles,leading to transgranular and intergranular fracture as well as shear sliding under shearing load.
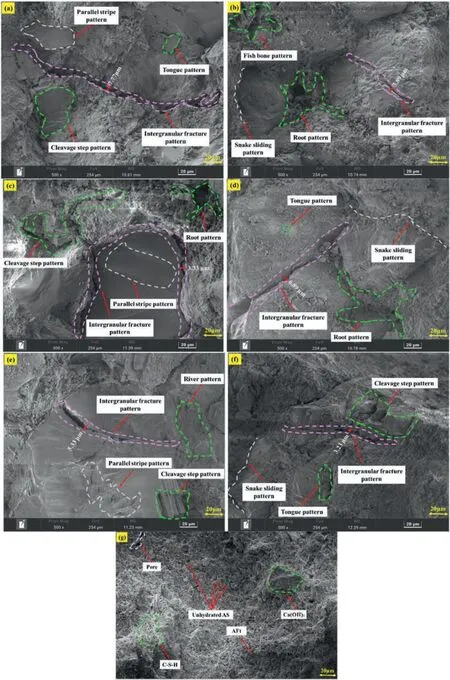
Fig.11.Microscopic fracture morphology of specimens:(a)Unfilled rock with 2 MPa normal stress,(b)Unfilled rock with 3.5 MPa normal stress,(c)Unfilled rock with 5 MPa normal stress,(d)Backfill-rock composites with 2 MPa normal stress,(e)Backfill-rock composites with 3.5 MPa normal stress,(f)Backfill-rock composites with 5 MPa normal stress,and(g)ACFPB.
4.Numerical results and back-analysis
Using the DEM,we conducted simulations to model the interaction relations between unfilled rock and backfill-rock composites.This allowed us to investigate the meso-characteristics of shear failure in specimens,which included the shearing loaddeformation curve,displacement field,crack propagation,and meso-cracking mechanism.
4.1.Numerical model and meso-parameter calibration
In terms of studying meso-shear failure characteristics,the particle flow code (PFC) is a dominant tool for simulating crack evolution and failure mode.In PFC,the parallel bond model(PBM)has been well-verified for replicating the shear behavior of materials(Wang et al.,2003,2023;Potyondy and Cundall,2004;Li et al.,2018;Yang et al.,2019a;Chen et al.,2022;Wang and Yan,2023).In this study,the PBM method is adopted to investigate the mesomechanism underlying shear failure in the specimens.
Fig.12 illustrates the shear numerical model built using the PFC2D.The particle size distribution (PSD) in the rock model was uniformly distributed in the range of 0.25-2.5 mm,while in the ACFPB model,it ranged from 0.2 to 2 mm.The numerical model consisted of more than 20,000 particles and 52,000 contacts,with particle contacts following the PBM.The U-R model generated a rectangle tunnel after removing particles from a specific area(Fig.12b),while the B-R model generated particles in a specific area(Fig.12c).Shear deformation was controlled by displacement,and the shear rate was set to 0.005 mm/s.The selection of appropriate meso-parameters is crucial to obtaining accurate simulation results.To determine the meso-parameters that could effectively represent specimens,a trial-and-error approach is used until the simulated shear characteristics are consistent with experimental results.The calibrated meso-parameters were listed in Table 5.Based on these calibrated meso-parameters,the numerical model tests for U-R and B-R specimens were carried out.Fig.13 presents a comparison between experimental and numerical results.The numerical shear load-deformation curves were similar to the test results.Moreover,the simulated shear modulus,peak shear stress,failure mode,and bimodal phenomenon were highly consistent with laboratory test results.The key findings are summarized in Table 6,revealing that the error in shear characteristic parameters between the experiment and the simulation was within 4%,confirming the reliability of the numerical simulation.
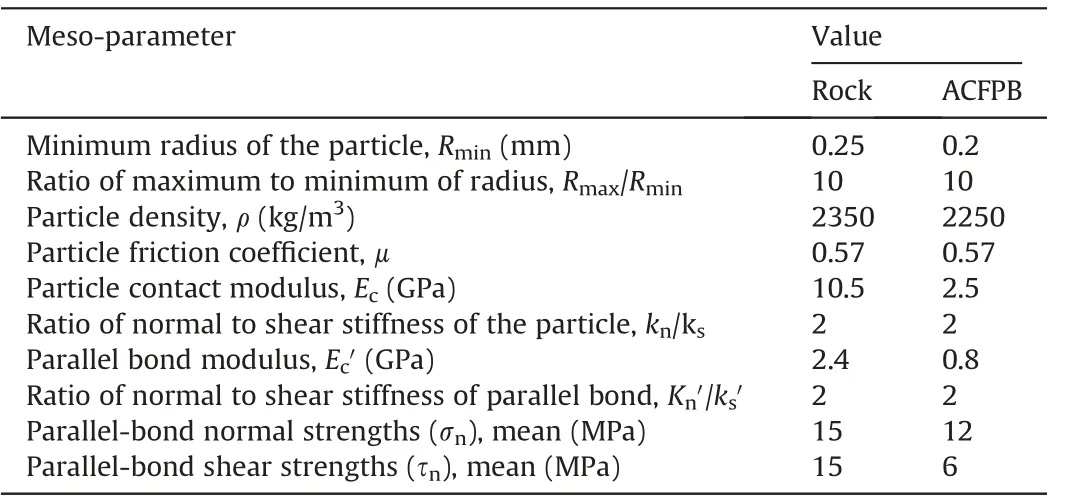
Table 5 Calibrated meso-parameters of particles in PFC2D model.

Table 6 Calibration results of PFC.

Fig.12.PFC2D model for shearing test: (a) Numerical model,(b) Unfilled rock model,and (c) Backfill-rock composites model and local amplification diagram.

Fig.13.Comparison of experimental and numerical results.
4.2.Contact force distribution and cracking
The laboratory shear tests of U-R and B-R specimens under 2 MPa and 5 MPa normal stresses were conducted,and the representative shear failure behavior was analyzed in Section 3.2.Considering the complexity of the shear test and the difficulty of observing the failure mode of the specimen after failure,there were no shear tests for low normal stress (0.5 MPa) and high normal stress(>5 MPa).Therefore,the numerical models of U-R and B-Rspecimens under 0.5 MPa normal stress,U-R and B-R specimens under 6.5 MPa normal stress,and U-R and B-R under 8 MPa normal stress were established by PFC2Dto comprehensively study the meso-characteristic of specimens’ shear failure.
The stress field is vital for analyzing the crack evolution of rock(Ju et al.,2017).Under shearing load,the magnitude of normal force and the existence of ACFPB significantly affected the stress distribution and crack propagation behavior of U-R and B-R specimens.In the PBM,many micro-cracks produced by parallel bond fracture merged into macro-cracks,which can record the whole evolutional process of the samples’ shear failure.To illustrate the process,the typical shear failure characteristics of Stage I,Stage II,Stage III,and Stage IV are shown in Fig.14.In Fig.14,the cyan line represented the crack;the magenta dots and the gray dots represented the tensile stress and compressive stress,respectively.The denser the distribution of the dots was,the stronger the stress field was.

Fig.14.Crack evolution process of specimens.
Fig.14 shows the stress field distribution and crack behavior of the specimens.In stage I for U-R specimens,compressive stress was widely distributed,while the tensile stress concentrated in the tunnel surrounding,such as in U-R under 0.5 MPa normal stress and U-R specimen under 6.5 MPa.This indicated that the presence of arch effects (Wu et al.,2022) and boundary effects (Bahaaddini,2017)leads to stress concentration.In addition,with the increase in normal stress,the concentration of tensile stress became less obvious,suggesting an increase in the difficulty of crack initiation.For instance,i.e.U-R specimens under 0.5 MPa normal stress exhibited concentrated tensile stress,while U-R specimens under 8 MPa showed the opposite trend.In stage II,in the stress concentration area dominated by tensile stress at the ULA and LRA of the mined-out area,micro-cracks merged with crack ②and crack⑧,resulting in the coalescence between the mined-out area and the boundary.The stress concentration area dominated by compressive stress was located at the middle boundary of the specimen,resulting in the initiation of a shear crack (crack ⑦).In stage IV,the tensile stress area was always located near the crack,while the compressive stress was distributed throughout the specimen,albeit at a lower density,due to the unloading of the specimen after failure.
For the B-R specimens,the addition of ACFPB led to a significant difference in shear failure characteristics compared to U-R specimens.In stage I,both compressive stress and tensile stress were widely distributed in the specimen,with no obvious stress concentration area.With the increase of normal stress,the stress distribution became more uniform,indicating that the presence of ACFPB changed the stress distribution in the specimens.In stage II,the stress concentration area dominated by compressive stress in the middle of the specimen led to the combination of micro-cracks into crack ⑦and crack ⑧,resulting in a trend of coalescing the left and right halves of the specimen through ACFPB.In stage III,crack⑧and damage areas appeared in the middle left of the specimen,while crack ⑦and damage areas appeared in the middle right of the specimen,leading to overall coalescence along the loading direction.In stage IV,similar failure characteristics were observed as in the experimental tests,which further verified the rationality of the accuracy of the simulation.By comparing the crack behavior and stress field distribution in the specimens,it was concluded that the presence of ACFPB reduced the concentration of compressive and tensile stresses,significantly enhancing the shear strength.The role of ACFPB promoted the transition in shear characteristics of the specimen from type A to type B.
4.3.Parallel bond force field evolution
Fig.15 presents the evolution of the parallel bond(PB)force field in specimens under six normal stress states.The color representation in the PB force field progresses from blue to green to yellow,indicating an increase in PB force.By comparing the U-R and B-R numerical modeling,we analyzed the effect of ACFPB on the shear failure characteristics of the specimens.The simulated PB force field of two typical specimens (U-R and B-R specimens under 2 MPa normal stress) were selected to clarify the failure features of specimens subjected to shear loading.

Fig.15.PB force field evolution process of specimens.
For the U-R specimen under 2 MPa normal stress,in stage I,there was a significant initial PB force concentration near both ends in the middle of the specimen,indicating stress concentration due to boundary effects,as shown in Fig.15.In stage II,the high PB force was distributed in the middle of the mined-out area,forming a stress concentration area.Micro-cracks rapidly propagated along this PB stress concentration area near the corner of the mined-out area,ultimately forming a macro-crack.Subsequently,the specimen reached its peak shearing load,resulting in some coalescence phenomena between the mined-out area and the specimen boundary,such as crack ②.In stage III,micro-cracks continued to merge,forming a large number of cracks,such as crack ②and crack④,leading to macroscopic shear fracture.It is worth noting that the U-R specimen with under 2 MPa normal stress transitioned from stage I to stage IV.The overall PB force first decreased and then increased,which was associated with the unloading behavior of the specimen after shear failure.
For the B-R specimen under 2 MPa normal stress,in stage I,large PB forces were distributed on the left upper corner,right lower corner and ACFPB,as shown in Fig.15.In stage II,high PB force was concentrated on the ACFPB,but the stress distribution within the ACFPB showed strong anisotropy and heterogeneity,resulting in an inclined stress concentration area.However,microcracks propagated rapidly along the PB stress concentration area at the interface between the mined-out area and ACFPB,forming macro-cracks and leading to the first shearing peak.In stage III,coalescence occurred between the interface of the mined-out area and ACFPB,as well as the right-middle boundary of the specimen,such as cracks ⑧.In stage IV,a larger number of micro-cracks merged rapidly,such as crack ②and crack ⑥,culminating in the shear failure mode.Notably,the PB force exhibited a pattern of increase,decrease,and then increase during stage I-stage IV of the specimen,which was closely related to the shear failure of ACFPB.The results presented in Fig.15 shows that the presence of ACFPB changed the distribution of PB force and enhanced the shear strength of the specimens.The extent of strengthening in the specimens depended on the distribution of PB force and the magnitude of normal stress.
4.4.Meso-cracking mechanism
Despite our analysis of the coalescence types and failure mode in the specimens,the underlying failure mechanisms remained elusive.Herein,the mesoscopic fracture mechanisms of specimens were revealed by particle displacement field.Fig.16 shows the distribution of the displacement field after the failure of specimens.In this representation,the color gradient-from blue to green to yellow to red-indicates increasing displacement.Fig.16 shows that each failed specimen presented a distinct displacement interface,consistent with the macroscopic shear fracture observed during testing.This further confirmed the reliability of numerical simulation.We have provided enlarged diagrams detailing typical coalescence types and failure modes along with the macroscopic shear fracture and key failure points.These enlarged diagrams revealed six distinct crack types as shown in Fig.17.Five of these types (Fig.17a-e-1) were also observed in the direct shear test of rock-like samples with multiple non-persistent joints(Zhang et al.,2020).However,a new type of crack in Figs.17e-2(ST)and Fig.17f block rotation(BS) can be observed in this shear experiment.
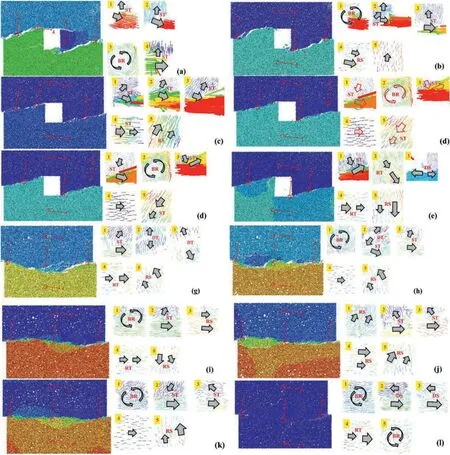
Fig.16.Displacement field after specimens’ failure: (a)Unfilled rock specimen with 0.5 MPa normal stress,(b) Unfilled rock specimen with 2 MPa normal stress,(c) Unfilled rock specimen with 3.5 MPa normal stress,(d)Unfilled rock specimen with 5 MPa normal stress,(e)Unfilled rock specimen with 6.5 MPa normal stress,(f)Unfilled rock specimen with 8 MPa normal stress,(g)Backfill-rock composites specimen with 0.5 MPa normal stress,(h)Backfill-rock composites specimen with 2 MPa normal stress,(i)Backfill-rock composites specimen with 3.5 MPa normal stress,(j) Backfill-rock composites specimen with 5 MPa normal stress,(k) Backfill-rock composites specimen with 6.5 MPa normal stress,and (l)Backfill-rock composites specimen with 8 MPa normal stress.

Fig.17.Displacement relation types between particles:(a) Direct shear crack (DS),(b)Relative shear crack(RS),(c)Direct tensile crack(DT),(d)Relative tensile crack(RT),(e)Shearing tensile crack (ST),and (f) Block rotation (BR).
According to the numerical results in Fig.16,crack ②exhibited a tensile-shear mixed characteristic characterized by RT,such as b2,c3,f2in Fig.16.Specifically,the tensile crack was mainly controlled by DT (Fig.16(g3)) and RT (Fig.16(e2) and Fig.16(e4)),while the shear crack was dominated by DS(Fig.16(l2)).Crack ⑧was a tensile crack,featured by ST(Fig.16(g1)).The block rotation occurred in the cracks characterized by ST,such as Fig.16(h1),Fig.16(i1),and Fig.16(11),which was in good agreement with the experimental test results.It also explained the local instability of the rock caused by an acute AE signal in stage II of the B-R specimen under 2 MPa normal stress in Section 3.2.In addition,we focused on understanding the meso-mechanism of shear failure in the ACFPB,which is characterized by RT,ST,RS and DS.This indicated that the presence of ACFPB added complexity to the shear failure mechanism of the specimen.In summary,tensile cracks can result from DT,RT,or ST,while shear cracks can be induced by DS,RS or CS.The macroscopic shear failure of B-R specimens was predominantly characterized as a tensile-shear mixed failure.It is essential to emphasize that the presence of ACFPB significantly changed the coalescence type and failure mode of the specimens.
5.Model and verification
5.1.Shear constitutive model
5.1.1.Establishment of constitutive model
Damage mechanics considers material damage as a cumulative process involving micro-unit damage.As micro-units deteriorate,the mechanical properties of macro-structure also exhibit corresponding changes.Before establishing the shear constitutive model,the following assumptions need to be made:(1)Each microunit follows an elastic damage constitutive relationship before specimen failure;(2) The specimen is assumed to be isotropic,homogeneous,continuous,and brittle;(3)The transition of microunits from intact state to damaged state is instantaneous and irreversible;(4)The macroscopic failure of specimens results from the continuous accumulation of micro-units damage.The rheological model element (Zhao et al.,2017)is employed to study the shear deformation characteristics of micro-units,as shown in Fig.18.According to the deformation coordination principle,the intact and damaged micro-units are combined,ensuring that their displacements of the two portions are equal.Consequently,the critical displacement of the micro-units aligns with the critical displacement of the specimen at the yield point (Xie et al.,2020).Given that specimen damage arises from the continuous damage of its micro-units,the shearing force can be expressed using Eq.(4).

Fig.18.Mechanical response of micro-units (revised Xie model) (Xie et al.,2020).
whereTis the shearing force of the specimen,Ais the contact shear area of specimen,Nis a micro-unit number,Nfis number of microunits’ failure,k1iandk2iare the stiffnesses of specimens,uis the shear displacement,Pniis the normal stress acting on the microunits,and φiis the internal friction angle of the micro-unit.Based on Fig.18 and Eq.(4),it can be further deduced as follows:
where τ is the shear stress on the contact interface of the specimen,ks=k1i+k2i,andusis the critical displacement of specimen damage.
The damage variable (D) is introduced to characterize the damage degree of specimens,which can be expressed by
Combining Eqs.(5) and (6),we have
Eq.(8) can be deduced from Eq.(7):
where τ*=ksuand τrare provided by intact micro-units and damaged micro-units,respectively.
The presence of micro-cracks within rock introduces significant variations in the shape and strength of micro-units.As a result,the failure of these micro-units exhibits randomness during the shear process,making it critical to accurately determine the parameter“D” in Eq.(6).When compared to other probability distribution functions such as the Improved Harris distribution (Xie et al.,2023a,b,2023b),Power distribution (Chen et al.,2018),Normal distribution (Cao et al.,2007),Lognormal distribution (Deng and Gu,2011),Weibull distribution (Xie et al.,2020) stands out due to its notable advantages.Consequently,the Weibull distribution is selected to describe the probability density function of rock microunits:
whereFais the shear strength of the micro-units,andmandu0are the model parameters.
Thus,the evolution equation ofDis as follows:
As per Mohr-Coulomb criterion,the shear strength (Fa) of micro-units is as follows:
where ψyandcyare the internal friction angle and cohesion of specimen at the yield point,respectively.
Eq.(12) can be deduced from Eq.(11):
whereuyis the shear displacement of specimen at the yield point.Combining Eq.(12) and assumptions (1)and (2),we have
where τyis the shear stress of specimen at the yield point.
Combining Eqs.(8)-(13),Dof the specimen can be deduced by
Substituting Eq.(14) into Eq.(8),we have
Based on the shear peak characteristics of specimen,it is known that Eqs.(16) and (17) should satisfy the shear constitutive equation:
Combining Eqs.(16)and(17),the model parameter(Eq.(18))of the specimens can be obtained:
5.1.2.Analysis of shear constitutive model
According to the constitutive model established in Section 5.1.1,the constitutive model of the U-R specimen was as follows:
Considering the bimodal shear characteristics and the post-peak shear features of the B-R specimens,the shear constitutive model was exhibited in Eq.(20):
whereks*,uy*,τr*,m*andu0*are the stiffness,yield displacement,residual stress and model parameters of the second shear peak,respectively.
To validate the effectiveness of the proposed constitutive model,the shear test data from three sets of U-R specimens and three sets of B-R specimens were utilized,as shown in Fig.19.In the model,the constitutive model parameters were determined based on the shear stress-displacement curve (Table 7).The proposed constitutive model demonstrates its capability to accurately capture the entire shear process of the specimens,including the bimodal phenomenon (Fig.19),as indicated by the classification criteria of the correlation coefficient (R2) (Yan et al.,2023a,2023b).

Table 7 Shear constitutive model parameters of specimens.
5.2.Shear strength models
Shear strength is one of the most important mechanical indexes of rock,and the failure mechanisms of jointed rock mass are complex and affected by many factors,including normal stress.Based on the experimental data and shear strength envelope of specimens (Fig.20).A revised Mohr-Coulomb criterion is summarized,as follows:
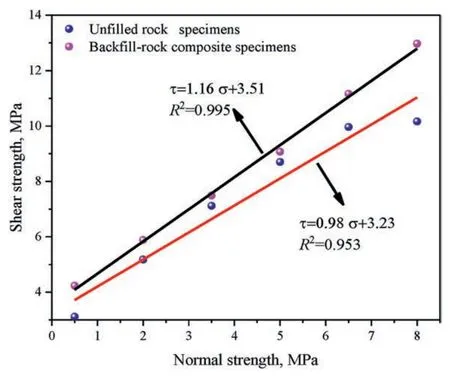
Fig.20.Peak shear strength envelope.
where τpis the peak shear strength of specimen;σnis the normal stress;φrandcrare the basic friction angle and apparent cohesion of U-R specimens,respectively;φcandccare the basic friction angle and apparent cohesion of AFPCB,respectively;and ω is the ratio of volume of ACFPB (Vc) to the volume of intact rock (Vr),i.e.Vc/Vr.
Eq.(22)proposed by Liu et al.(2017)was employed to assess the prediction error of peak shear strength:
By comparing the test results with those obtained from therevised Mohr-Coulomb models,it was found that the errors (δ)ranged from 1.54% to 7.14% (Table 8).These findings validate the rationality of the proposed model.Fig.20 shows that the fitted two curves for B-R specimens were greater than those of U-R specimens.This indicated that the addition of AFPCB increased the internal friction angle of the specimens.In other words,the presence of ACFPB resulted in closer embedding and interlocking of particles,increasing the friction required to break away from the occlusal state and making it more challenging for particles to slide (Jaeger,1960).Moreover,the apparent cohesion of B-R specimens exceeded that of U-R.This is attributed to the hydration products within the ACFPB which enhanced the interlocking of concave and convex bodies at the backfill-rock interface,thereby increasing apparent cohesion and further improving the shear strength of the specimens(Fang et al.,2023;Zhu et al.,2023).In addition,Barton(1973)found that under high normal stress,the shear strength of joints would increase due to the crack over-closure effect.This effect can explain the occurrence of the second shearing peak of the B-R’s shear characteristic curve.In this case,i.e.the ACFPB and surrounding rock formed a complete rock mass,and the crack overclosure effect became more pronounced.The difference in the slopes between the two peak strength lines signifies a transformation in the shear failure characteristics of specimens,specifically from type A to type B.This transformation is because the surfaces of the U-R specimens were relatively smooth and there were no obvious micro-cracks,while rough,tooth-shaped microcracks were present at the interfaces of B-R specimens.

Table 8 Comparison results of the revised Mohr-Coulomb criterion.
6.Conclusions
In this study,we conducted laboratory experiments to investigate the shear fracture process of unfilled rock(U-R)and backfillrock composites (B-R) under three constant normal loads.We recorded the real-time crack evolution and meso-failure features of the specimens subjected to shear loading using a high-speed camera and AE monitoring.In addition,we performed numerical analysis to elucidate the shear failure meso-mechanism of B-R.Moreover,we proposed a novel shear constitutive model to explore the mechanical mechanism of rock.Finally,we established a revised Mohr-Coulomb criterion for estimating shear strength.
Compared to U-R,the unique feature of the shear characteristics curve for B-R was the bimodal phenomenon.The first shear peak corresponded to rock breakage,while the second shear peak was associated with ACFPB breakage.The presence of the ACFPB transformed the failure mode from shear-dominated mixed failure(U-R) to tensile-shear mixed failure (B-R).Our analysis of the shearing characteristics and AE features curves revealed that the shear failure of the specimens experienced stages:(i)stage I:stress concentration;(ii) stage II: crack propagation;(iii) stage III: crack coalescence;and (iv) stage IV: shearing friction.
Based on the numerical simulation results,we successfully replicated the bimodal phenomenon and failure mode of specimens.The existence of ACFPB altered the coalescence types and failure modes of the specimens and strengthened the shear strength.The degree of strengthening depended on the distribution of parallel bond force and the magnitude of normal stress.
Using the damage mechanics and statistics,our proposed constitutive model effectively depicted the entire shear process of the specimens,especially the bimodal phenomenon.We also investigated the shear strength of the specimens using the revised Mohr-Coulomb criterion.Additionally,by combining the numerical results with micro-test results,we interpreted the micro-and meso-mechanisms of shear failure.It was found that the shear failure of specimens was mainly a tensile-shear mixed failure.The SEM results revealed that the micro-mechanism of shear failure in the specimens was driven by a combination of tensile-shear failure caused by directional movement,rotation,and fragmentation of particles,resulting in transgranular fracture,intergranular fracture and shear sliding.
Declaration of competing interest
The authors declare that they have no known competing financial interests or personal relationships that could have appeared to influence the work reported in this paper.
Acknowledgments
The authors gratefully acknowledge the financial support from the National Natural Science Foundation of China (Grant No.52325905) and Open Research Fund of State Key Laboratory of Geomechanics and Geotechnical Engineering,Institute of Rock and Soil Mechanics,Chinese Academy of Sciences(Grant No.Z020005).
List of symbols
εpPeak strain
φ Internal friction angle
ν Poisson’s ratio
τ Shear stress
σcUniaxial compressive strength
σnNormal stress
σtTensile strength
τpPeak shear strength
τrResidual stress
cCohesion
DDamage variable
EcElastic modulus
EtTensile modulus
GShear modulus
ksStiffness
uShear displacement
uyYield displacement
 Journal of Rock Mechanics and Geotechnical Engineering2024年3期
- Journal of Rock Mechanics and Geotechnical Engineering的其它文章
- Limit load and failure mechanisms of a vertical Hoek-Brown rock slope
- Limit state analysis of rigid retaining structures against seismically induced passive failure in heterogeneous soils
- Bearing capacity of circular footings on multi-layered sand-waste tire shreds reinforced with geogrids
- Experimental investigation on the permeability of gap-graded soil due to horizontal suffusion considering boundary effect
- Damage constitutive model of lunar soil simulant geopolymer under impact loading
- Wetting-drying effect on the strength and microstructure of cementphosphogypsum stabilized soils
