ldentification of hub genes associated with Helicobacter pylori infection and type 2 diabetes mellitus: A pilot bioinformatics study
Han Chen,Guo-Xin Zhang,Xiao-Ying Zhou
Abstract BACKGROUND Helicobacter pylori (H. pylori) infection is related to various extragastric diseases including type 2 diabetes mellitus (T2DM).However,the possible mechanisms connecting H. pylori infection and T2DM remain unknown.AIM To explore potential molecular connections between H. pylori infection and T2DM.METHODS We extracted gene expression arrays from three online datasets (GSE60427,GSE27411 and GSE115601).Differentially expressed genes (DEGs) commonly present in patients with H. pylori infection and T2DM were identified.Hub genes were validated using human gastric biopsy samples.Correlations between hub genes and immune cell infiltration,miRNAs,and transcription factors (TFs) were further analyzed.RESULTS A total of 67 DEGs were commonly presented in patients with H. pylori infection and T2DM.Five significantly upregulated hub genes,including TLR4,ITGAM,C5AR1,FCER1G,and FCGR2A,were finally identified,all of which are closely related to immune cell infiltration.The gene-miRNA analysis detected 13 miRNAs with at least two gene cross-links.TF-gene interaction networks showed that TLR4 was coregulated by 26 TFs,the largest number of TFs among the 5 hub genes.CONCLUSION We identified five hub genes that may have molecular connections between H.pylori infection and T2DM.This study provides new insights into the pathogenesis of H. pylori-induced onset of T2DM.
Key Words: Helicobacter pylori;Type 2 diabetes mellitus;Βioinformatics analysis;Differentially expressed genes;Hub genes
lNTRODUCTlON
The infection rate ofHelicobacterpylori(H.pylori) is still increasing recently and it infects almost 50% of the world’ population.The prevalence rate is even higher in less developed countries[1].It not only affects gastric disease but also affects extragastric diseases such as non-alcoholic fatty liver disease[2],cardiovascular disease[3],autoimmune disease[4],and endocrine disorders,such as diabetes[5].In recent years,the prevalence rate of type 2 diabetes mellitus (T2DM) and its complications have also increased significantly[6].The consequences of poor glycemic control in the long and short term can be significant on social and economic levels[7,8].Patients with T2DM are more susceptible toH.pyloriinfection,according to our previous meta-analysis[9,10].There is a significant decrease in the eradication rate ofH.pyloriinfection in T2DM patients withH.pyloriinfection compared to T2DM patients without infection[11].Additionally,H.pylori-infected T2DM patients have worse glycemic control capability[12].All these clinical studies strongly suggest that there is an association betweenH.pyloriinfection and T2DM.
However,the detailed mechanisms underlyingH.pyloriinfection and T2DM remain unclear.According to previous studies,both innate and adaptive immune reactions may be activated in the mucosa of the stomach as a result ofH.pyloriinfection[13].This local inflammation in the stomach may spread systematically as a result of proinflammatory cytokines released by the stomach[14].Chronic low-grade inflammation,which is a feature ofH.pylori-associated T2DM,would be more likely to develop as a result[15].Our previous mechanistic study suggested thatH.pyloriinfection induces hepatic insulin resistance by the c-Jun/miR-203/SOCS3 signaling pathway[16].The gut microbiota may also play a role in the immune and metabolic homeostasis of the host,and the infection ofH.pylorinot only disrupts the balance of commensal bacterial species in the gastric mucosa but also causes alterations in the microbial composition of the human gut[17].However,these hypotheses have not been formally confirmed and validated.
This study aimed to investigate the potential molecular connections betweenH.pyloriinfection and T2DM.We identified differentially expressed genes (DEGs) by analyzing gene expression datasets through comprehensive bioinformatics analysis.DEGs were screened by combining the results from GEO datasets.Protein-protein interaction (PPI) construction,Gene Ontology (GO) term analysis,and Kyoto Encyclopedia of Genes and Genomes (KEGG) pathway enrichment analyses were performed to identify the hub genes linked to the two diseases.A miRNA-hub gene network and transcription factor (TF)-gene mRNA interaction network were also constructed.We sought to provide new insights into the pathogenesis ofH.pylori-induced onset of T2DM.
MATERlALS AND METHODS
Data sources
The NCBI-GEO database is a publicly available database containing gene expression datasets[18,19].Three datasets were retrieved from the GEO database (https://www.ncbi.nlm.nih.gov/geo/),including two gene expression profiles related toH.pylori(GSE60427 and GSE27411) and one dataset related to T2DM (GSE115601).Detailed information on the microarray datasets is provided in Supplementary Table 1.Gene expression profiles were set accordingly,including: (1) Tissue samples collected from diseased and normal gastric tissues;and (2) datasets with more than three samples.
Identification of DEGs
The NCBI-GEO2R interactive tool was utilized to analyze and compare data under similar experimental conditions from two or more sample groups to identify genes significantly differentially expressed for both diseases (https://www.ncbi.nlm.nih.gov/geo/query/acc.cgi?)[20].Genes that satisfied the criteria of log fold change > 0.4 with adjustedPvalue less than 0.05 were identified as DEGs.Genes presenting upregulation or downregulation in bothH.pyloriand T2DM were selected using the Venn diagram web tool (http://bioinfogp.cnb.csic.es/tools/venny/).
Functional enrichment analysis of DEGs
DAVID (Database for Annotation,Visualization,and Integrated Discovery),as an online tool,was used to predict the functions of hub genes based on GO enrichment analysis and KEGG pathway analysis (https://david.ncifcrf.gov/)[21] at three levels: Biological process (BP),molecular function (MF),and cellular component (CC).Bubble maps were used for representing BP,MF,CC,and KEGG pathways,using R package of ggPlot2.A statistically significantPvalue was defined asPvalue less than 0.05.
Construction of PPI network and identification of hub genes
A public online database,named STRING (https://string-db.org/),can be used to search for and predict PPIs.This inclusive resource facilitates the investigation of direct physical associations between proteins,as well as the detection of indirect functional connections unveiled through correlation analyses[22].When common DEGs between different groups were identified,they were uploaded to STRING’s official website (https://cn.string-db.org/) and the interactions between DEGs and STRING database proteins were then assigned (with a minimum needed interaction score of 0.40).We followed the method of Liuetal[23],in which PPI interaction networks were visualized using Cytoscape (Version 3.6.1).Cytoscape is from National Institute of General Medical Sciences,United States.We used CytoHubba (Version 0.1) to identify hub genes using a maximal clique centrality algorithm.
Evaluation of infiltrated immune cells
To explore the association between infiltrating immune cells andH.pyloriinfection,data on proportions of the 22 immune cell types were obtained using the “cell-type identification by estimating relative subsets of RNA transcripts” (CIBERSORT) algorithm (https://cibersort.stanford.edu/).As a result,only samples with aPvalue of < 0.05 were included in the immune cell infiltration matrix.Boxplots and violin plots were utilized to visualize the proportions of infiltrated immune cells in each sample and each group.The correlation between expression of the five hub genes and the abundance of six immune cell subsets [B cells,CD4+T cells,CD8+T cells,macrophages,dendritic cells (DCs),and neutrophils] was analyzed in the gene module of TIMER (http://timer.cistrome.org/)[24].
MiRNAs prediction and gene-miRNA interaction network construction
In order to predict their targeted miRNAs,hub genes were selected and analyzed using the miRWalk database (http://mirwalk.umm.uni-heidelberg.de/).The filter setting with a score of > 0.90 was implemented.The target gene binding region was the 3'-UTR,and the intersection with other databases was set to miRDB.Further data processing was carried out by Cytoscape.
TF-gene interaction network
The Network Analyst database (https://www.networkanalyst.ca/) was applied to identify human TFs of the related hub genes[25].The database includes all three data sources named JASPAR,ENCODE and ChIP Enrichment Analysis.ChIP Enrichment Analysis was used to identify target TFs of hub genes in our current study.Moreover,the Cytoscape tool was used to visualize the TF-gene interaction network among TFs and hub genes.
Singlegene gene set enrichment analysis
Gene set enrichment analysis (GSEA) of each hub gene was performed using the “clusterProfiler” R package to identify regulatory pathways and biological functions associated with each hub gene.An adjustedP< 0.05 was used to indicate significant thresholds for GSEA.
Hub genes validated in clinical specimens
The results of our bioinformatics-based analysis were further verified by RT-qPCR assays.Gastric antrum tissues from patients and controls were collected (control:n=30;T2DM:n=30;H.pylori:n=30;T2DM+H.pylori:n=30).
H.pyloriinfection was diagnosed by the 13C-urea breath test (Headway Bio-Sci Co.,Ltd,Shenzhen,China) according to the manufacturer’s instructions.A delta over baseline of > 4% indicates a positiveH.pyloriinfection status.Patients with T2DM were diagnosed based on one of the following American Diabetes Association diagnostic criteria: fasting blood glucose level ≥ 7.0 mmol/L,2-hour postload glucose level ≥ 11.1 mmol/L during an oral glucose tolerance test,glycated hemoglobin level ≥ 6.5%,or a random plasma glucose level ≥ 11.1 mmol/L in a patient with classic symptoms of hyperglycemia or hyperglycemic crisis.This study was approved by the ethics committee of the First Affiliated Hospital of Nanjing Medical University (2021-SRFA-034).Total RNA was extracted from each tissue sample using TRIzol (Invitrogen,F10488,Waltham,MA,United States),following the manufacturer’s instructions.The kit,EasyScript All-in-One First-Strand cDNA Synthesis SuperMix for RT-qPCR Kit (TransGen Biotech,Beijing,China),was utilized for reverse transcription,with incubations performed at a tempertature 42°C for 15 min and then at 85°C for 15 s.Subsequently,StarLighter SYBR Green RT-qPCR Mix (Universal) (Forever Star,Beijing,China) kit was utilized for RT-qPCR analysis,with an ABI 7500 system (Applied Biosystems,United States).The primers used are listed in Supplementary Table 2.The reaction conditions were as follows: Predenaturation (95°C for 5 min),40 cycles of denaturation (94°C for 20 s),annealing and extension (60°C for 34 s).β-actin was served as an internal control for RT-qPCR.The 2-ΔΔCtmethod was utilized to determine relative the expression levels of genes.Statistical analysis was performed using GraphPad Prism (Version 9.0,Boston,MA,United States).Expression differences of hub genes were compared using one-way ANOVA in four groups (control,H.pyloriinfection,T2DM,and T2DM withH.pyloriinfection),and pairwise comparisons within the two groups were performed using Student’sttest.Statistically significant was defined asP< 0.05.
RESULTS
Identification of DEGs
Figure 1 illustrated the overall study design.In brief,a total of 3541,2186 and 1364 DEGs were identified from the GSE60427,GSE217411 and GSE115601 datasets,respectively.In the GEO datasets,volcano plots (Figure 2A-C) and heatmaps (Supplementary Figure 1) were used to illustrate the dysregulated genes (including upregulated and downregulated).Among these datasets,67 common DEGs were extracted,including 48 upregulated and 19 downregulated genes (Supplementary Table 3;Figure 2D).

Figure 2 The expression levels of differentially expressed genes in three datasets. A-C: The volcano plot distribution of differentially expressed genes (DEGs) of GSE60427 (A),GSE27411 (B) and GSE115601 (C).The blue dots indicate the screened downregulated DEGs,red dots indicate the screened upregulated DEGs,and the grey dots indicate genes with no significant differences;D: The Venn diagram of DEGs based on the three datasets.DEGs: Differentially expressed genes.
Functional annotation of DEGs
After DEGs were selected,GO and KEGG pathway enrichment analyses were performed to explore the biological functions of these genes involving three functional categories: BP,MF,and CC.Major BP terms associated with DEGs included regulation of the immune effector process,neutrophil activation and neutrophil mediated immunity (Figure 3A).Major CC terms associated with these DEGs included the secretory granule membrane,blood microparticle,and tertiary granule (Figure 3B).Finally,MF-associated GO terms were mainly associated with sulfur compound binding,heparin binding,glycosaminoglycan binding,etc.(Figure 3C).According to KEGG pathway analysis results,the DEGs were mainly enriched for pathways related to complement and coagulation cascades,Staphylococcusaureusinfection,and neutrophil extracellular trap formation (Figure 3D).
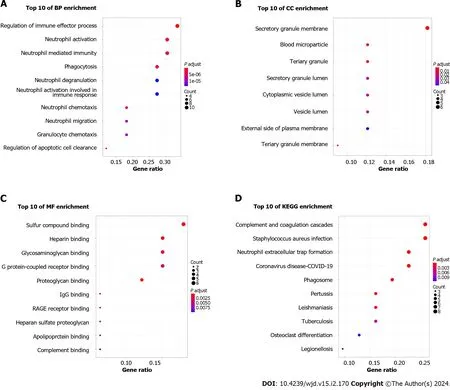
Figure 3 Functional enrichment analysis of common differentially expressed genes. A: Biological process analysis of differentially expressed genes (DEGs);B: Cellular component analysis of DEGs;C: Molecular function analysis of DEGs;D: Kyoto Encyclopedia of Genes and Genomes pathway analysis of DEGs.BP: Biological process;CC: Cellular component;MF: Molecular function;KEGG: Kyoto Encyclopedia of Genes and Genomes.
PPI network construction and hub gene selection
The PPI network of DEGs obtained from STRING was subjected to the MCODE plugin of Cytoscape to analyze significant modules.A total of 38 nodes and 84 edges were mapped in the PPI network (Figure 4A).From these modules,the top functional cluster of modules was selected based on the cutoff criteria of node > 3 and score > 3 (Figure 4B).
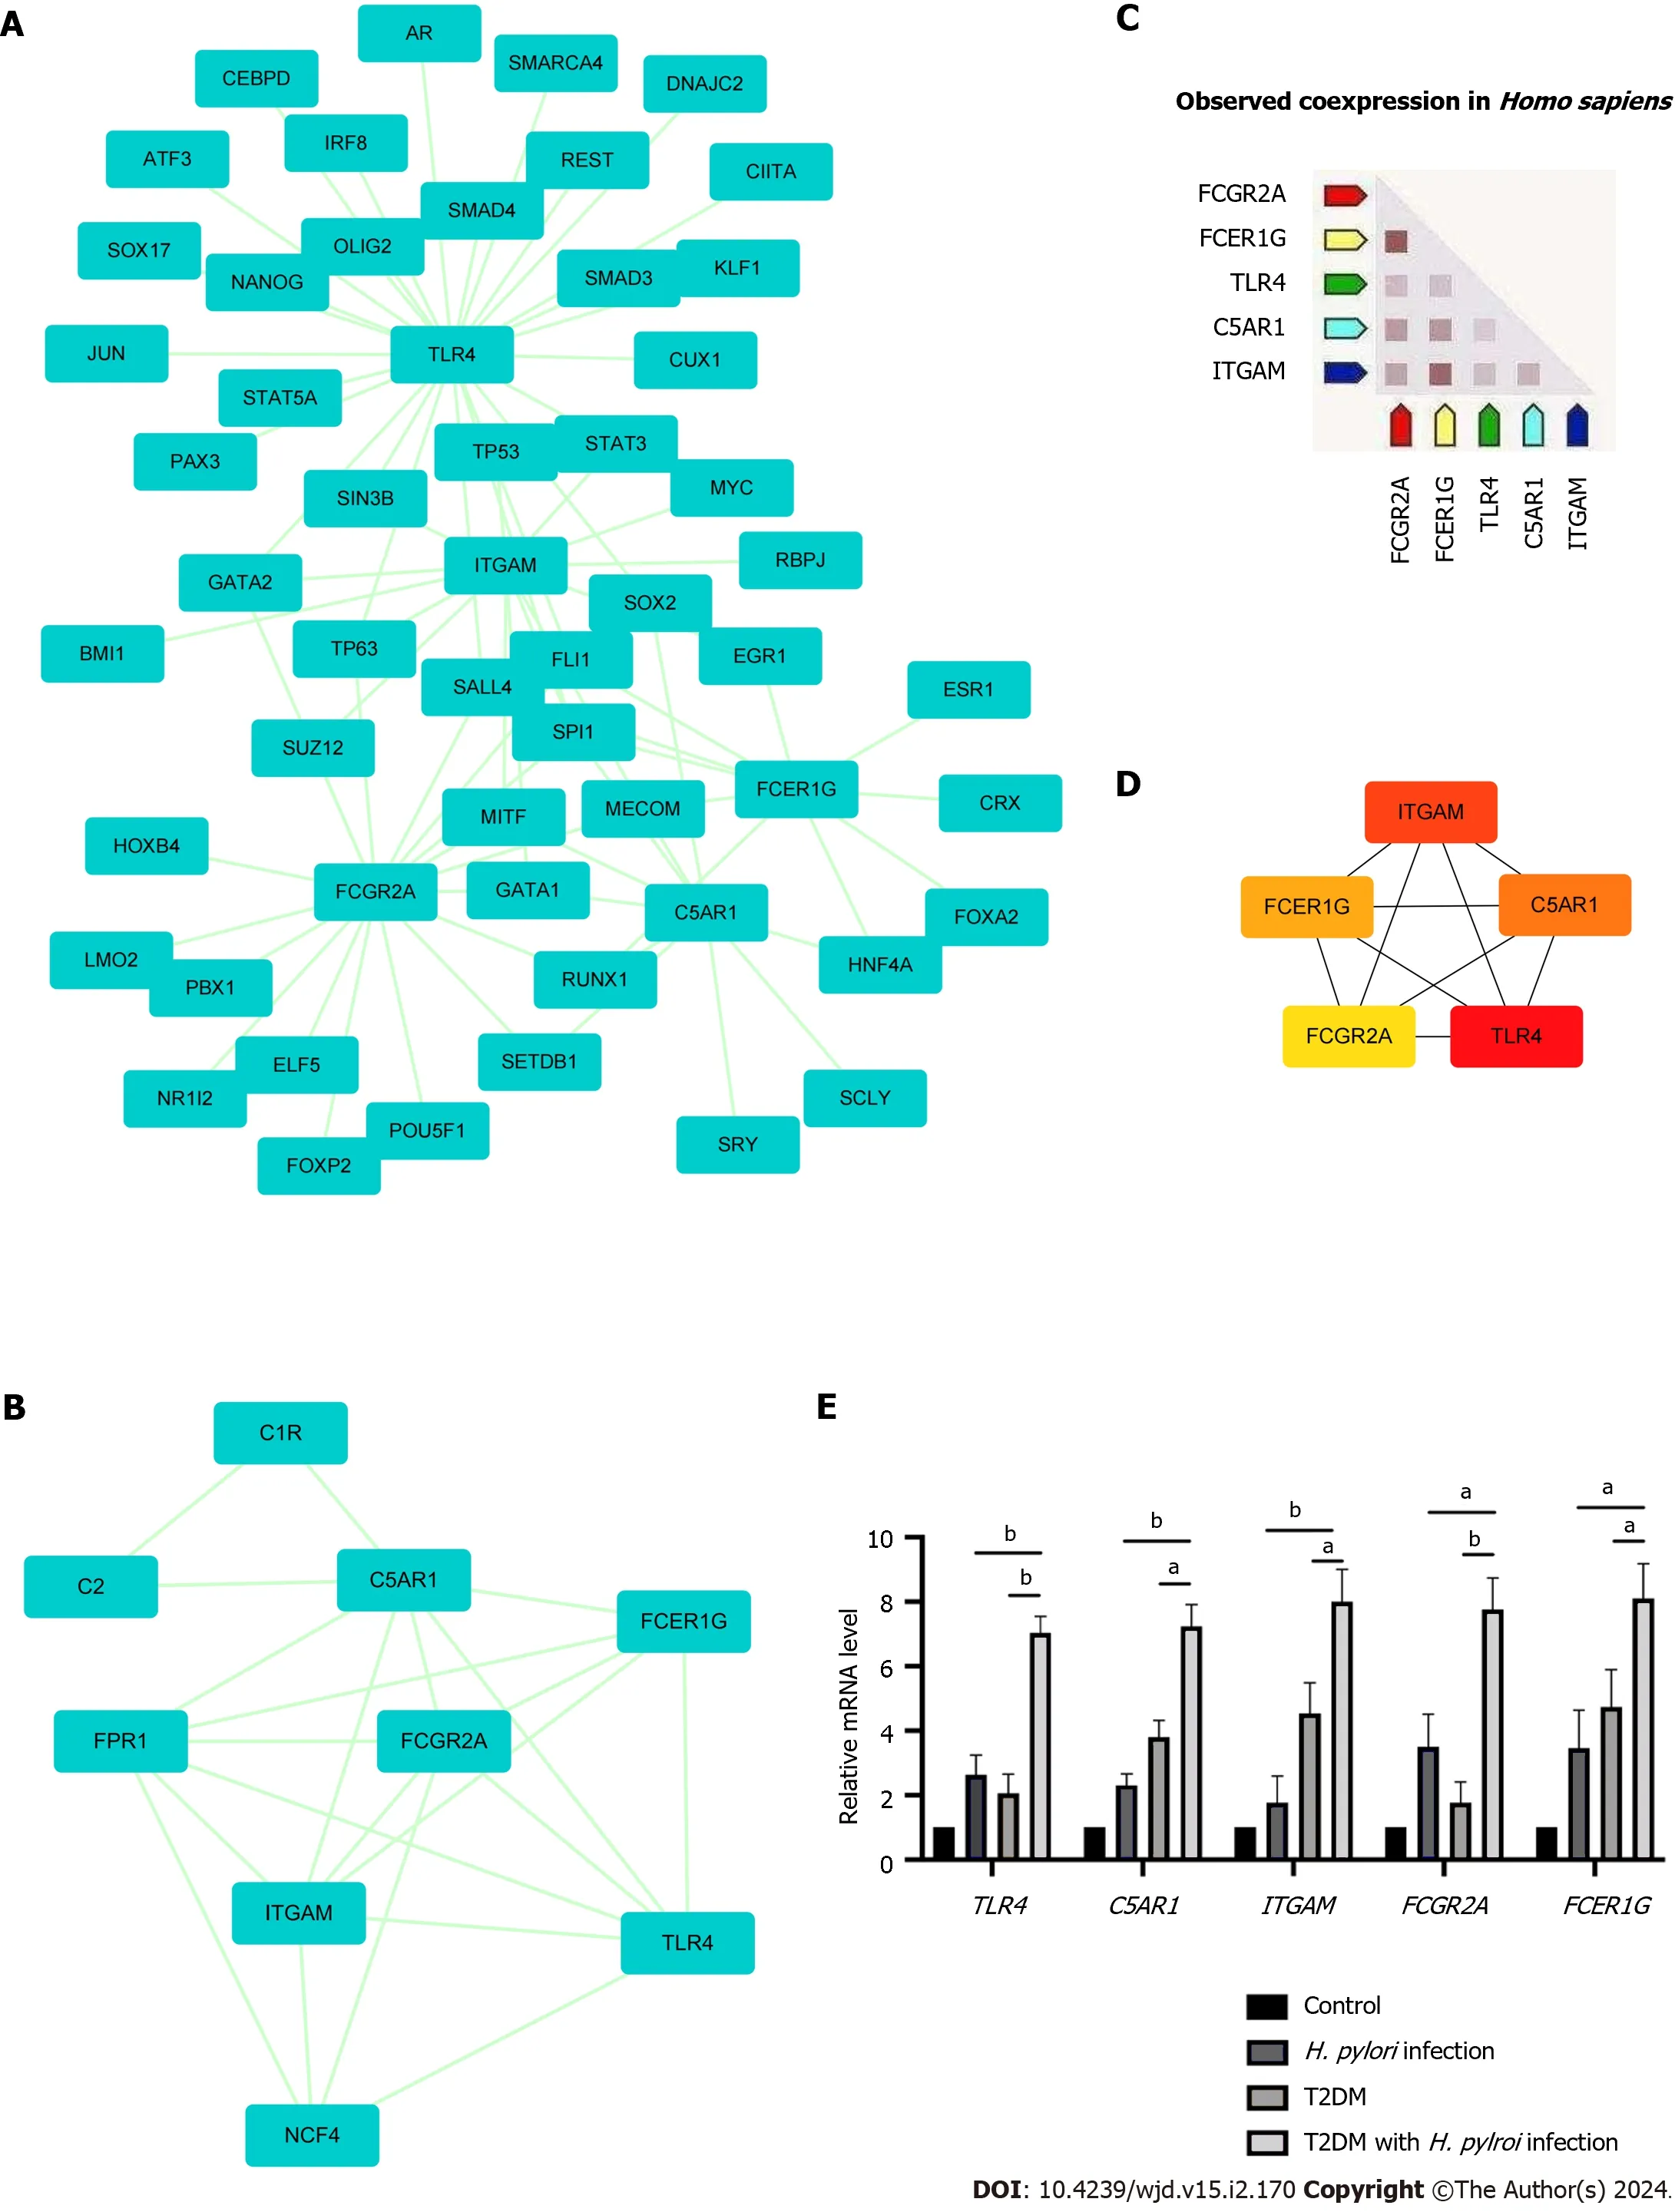
Figure 4 Protein-protein interaction network showing interactions between common genes and identification of differentially expressed genes from this network. A: The protein-protein interaction (PPI) network of differentially expressed genes was constructed by Cytoscape software.The criteria of the PPI network were as follows: Confidence score ≥ 0.4 and a maximum number of interactions ≤ 5;B: The top module of the PPI network.MCODE score ≥ 3,9 nodes and 21 edges;C: Construction of the PPI network among the 5 hub genes;D: Coexpression analysis of the 5 hub genes using STRING;E: The expression of 5 hub genes in clinical specimens by RT-qPCR analysis.aP < 0.05;bP < 0.01).T2DM: Type 2 diabetes mellitus;H. pylori: Helicobacter pylori.
Then,the key genes with degree connectivity were ranked by the CytoHubba plugin of Cytoscape.Finally,five intersecting genes (TLR4,ITGAM,C5AR1,FCER1GandFCGR2A) with the highest degree were considered hub genes for further analyses (Figure 4C and D).
Validation of hub genes in human gastric tissues
Expression levels of the five hub genes in the three datasets are shown in Supplementary Figure 2;and were significantly upregulated in patients with eitherH.pyloriinfection or T2DM alone compared to negative controls.Human gastric tissues from four groups were collected (control group,H.pyloriinfection alone group,T2DM alone group and T2DM withH.pyloriinfection group).All included patients underwent upper gastrointestinal endoscopy and were pathologically diagnosed with chronic superficial gastritis without acute inflammation or atrophy according to the Sydney System[26].The baseline characteristics of the groups are shown in Supplementary Table 4.Through RT-qPCR analysis,we found thatTLR4,ITGAM,C5AR1,FCER1GandFCGR2A were expressed at significantly higher levels in the T2DM withH.pyloriinfection group (P< 0.05) than in the T2DM group or theH.pyloriinfection group alone (Figure 4E).
Immune infiltration analysis
Using the CIBERSORT algorithm,we explored differences in immune infiltration betweenH.pylori-infected versus normal gastric tissues.Compared with normal tissues,H.pylori-infected gastric tissues generally contained a higher proportion of regulatory T cells,activated NK cells,eosinophils and neutrophils,whereas the proportions of plasma cells,activated mast cells and M2 macrophages were lower inH.pylori-infected gastric tissues (Figure 5A and B).
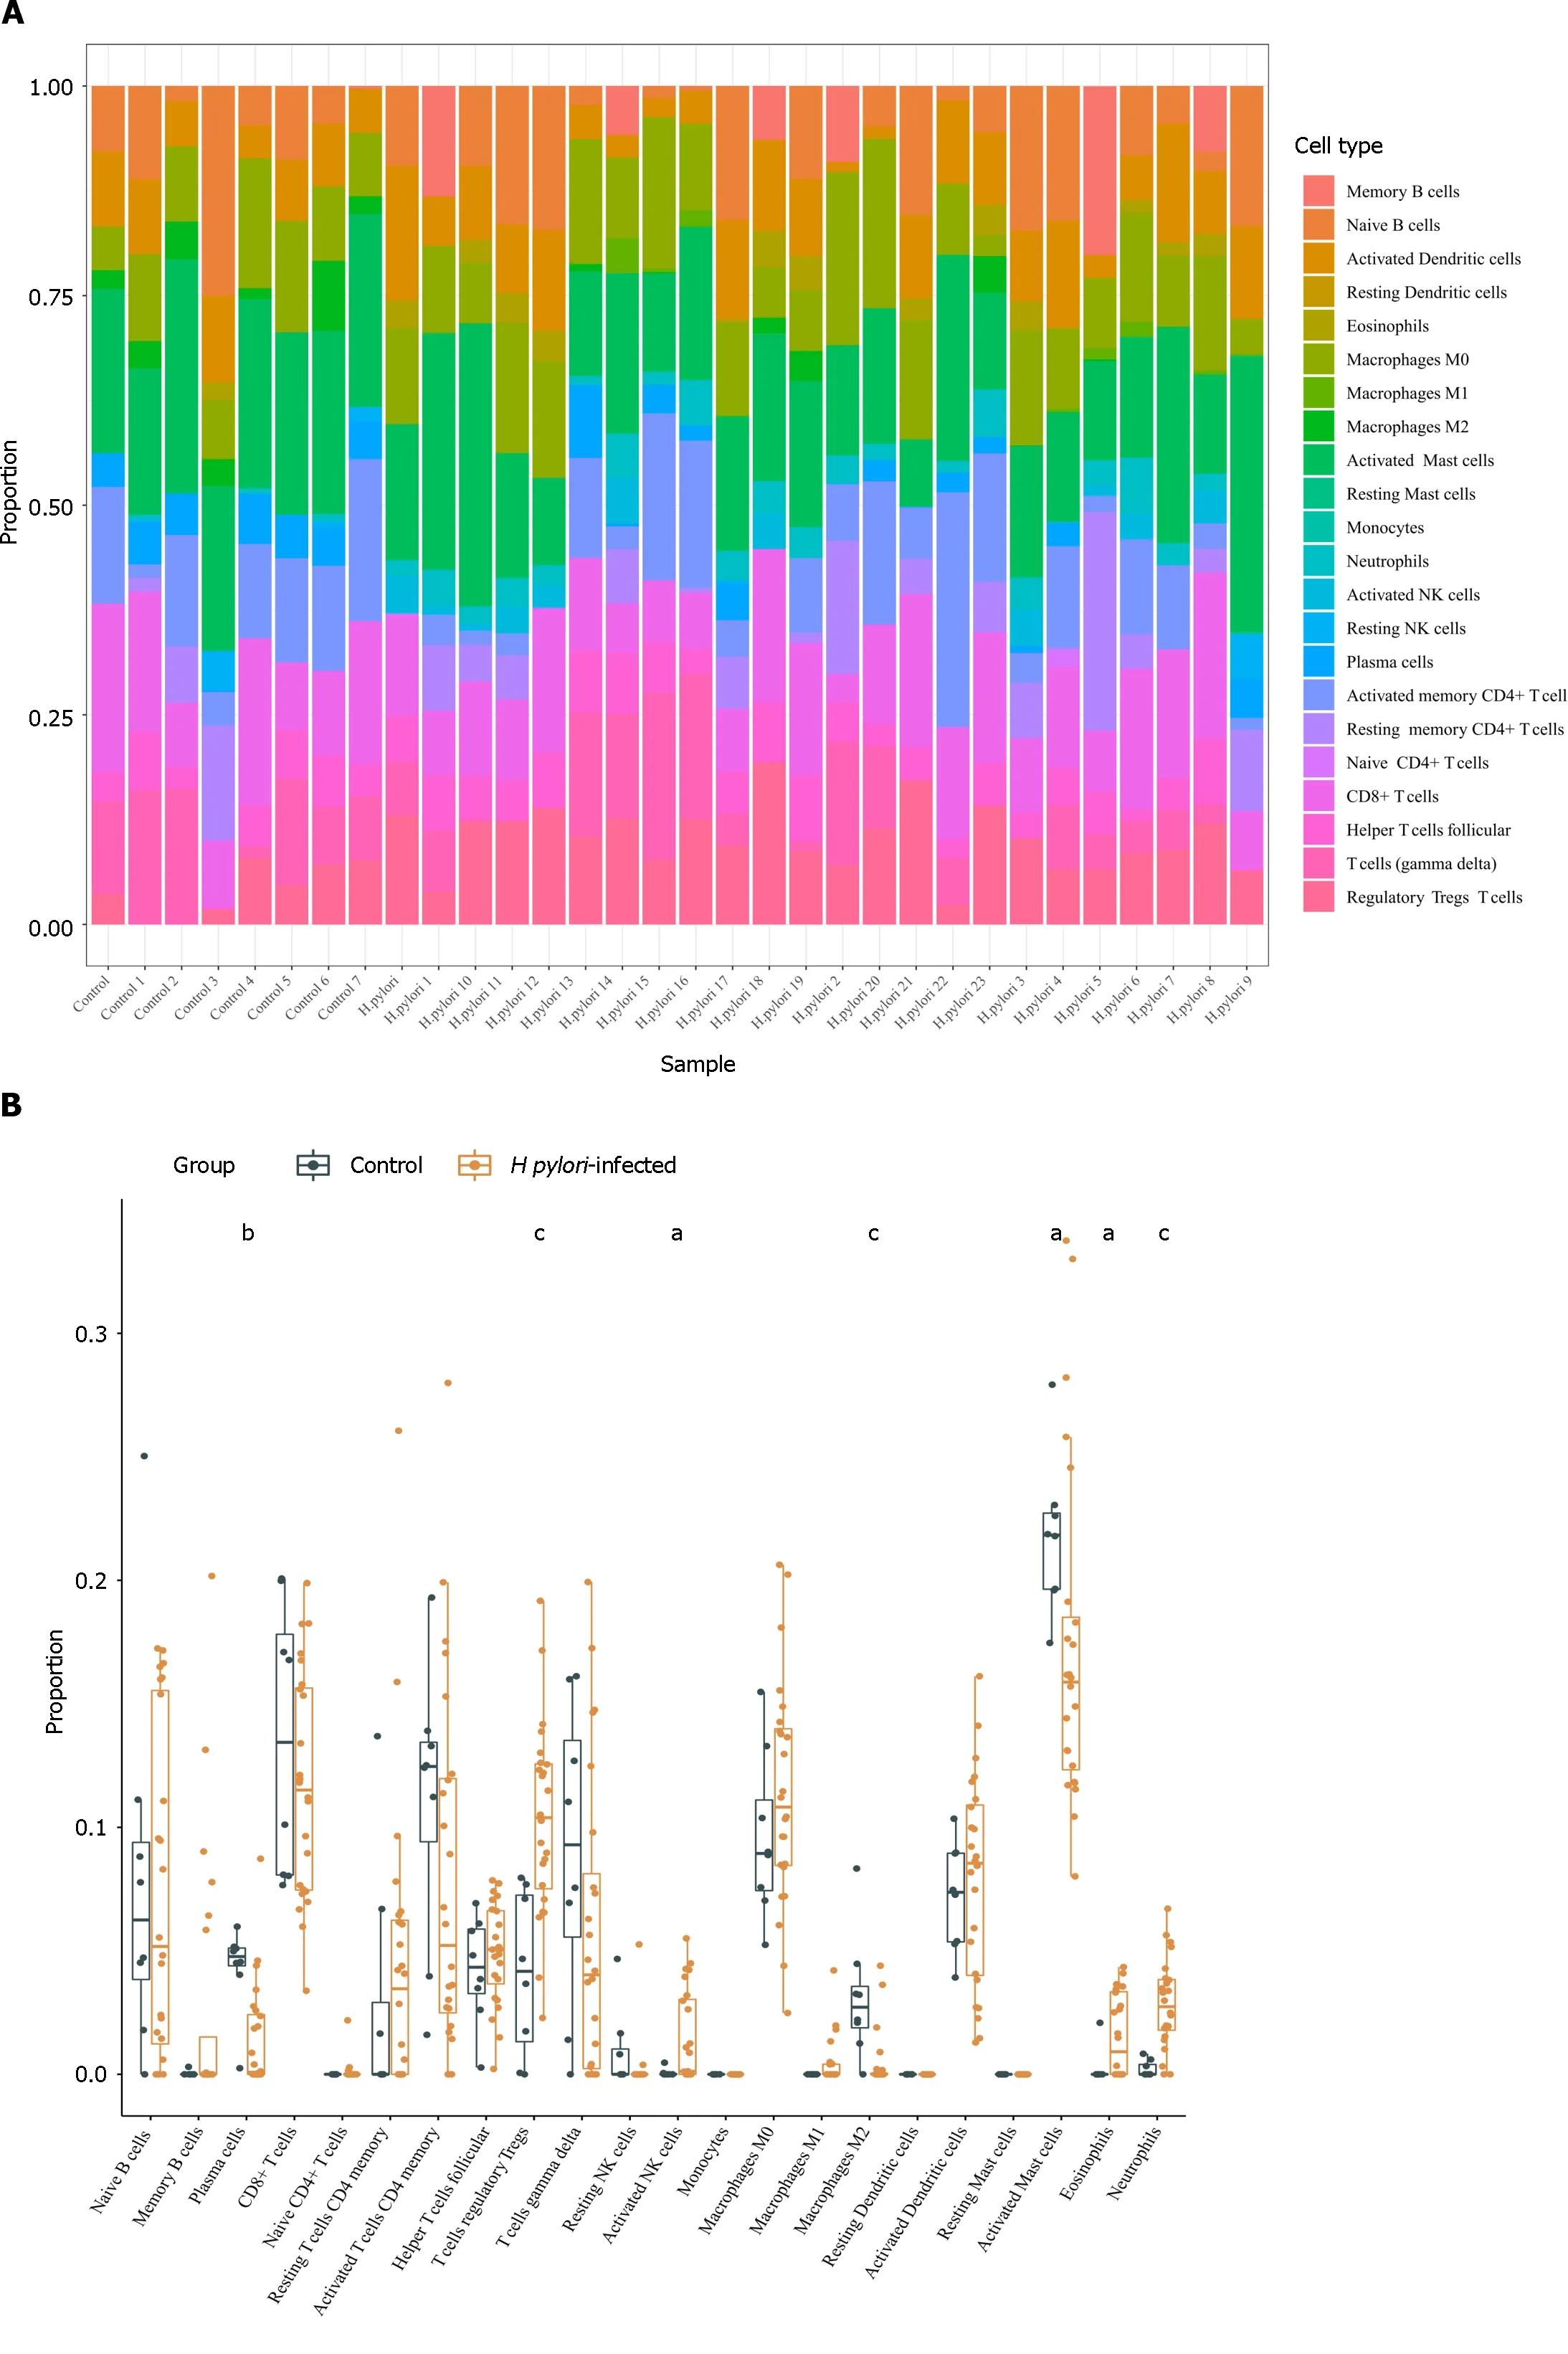
Figure 5 The relationship between hub genes and immune infiltration. A and B The differences in immune infiltration between Helicobacter pylori (H.pylori)-infected gastric tissues and normal gastric tissues;C: Correlation analysis between hub gene expression and immune cell infiltration levels in H. pylori infection.H. pylori: Helicobacter pylori.aP < 0.05,bP < 0.01,cP < 0.001.
The results obtained using TIMER showed thatTLR4andITGAMexpression correlated positively with CD8+T cells,CD4+T cells,macrophages,neutrophils,and DCs.C5AR1,FCER1GandFCGR2Aexpression was significantly associated with infiltration of B cells,CD8+T cells,macrophages,neutrophils,and DCs,among which their mRNA expression levels all correlated negatively with B cells (Figure 5C).
Prediction of further miRNA and analysis of gene-miRNA network
A total of 225 miRNAs was predicted after we uploading the 5 identified hub genes to the miRWalk database.The gene-miRNA interaction network is shown in Figure 6A.We detected 13 miRNAs (miR-6848-5p,miR-6796-5p,miR-6740-5p,miR-8060,miR-6730-5p,miR-5698,miR-12119,miR-6881-5p,miR-6846-5p,miR-7703,miR-6728-5p,miR-7107-5p and miR-1914-3p) associated with at least two gene cross-links,as shown in Supplementary Table 5.
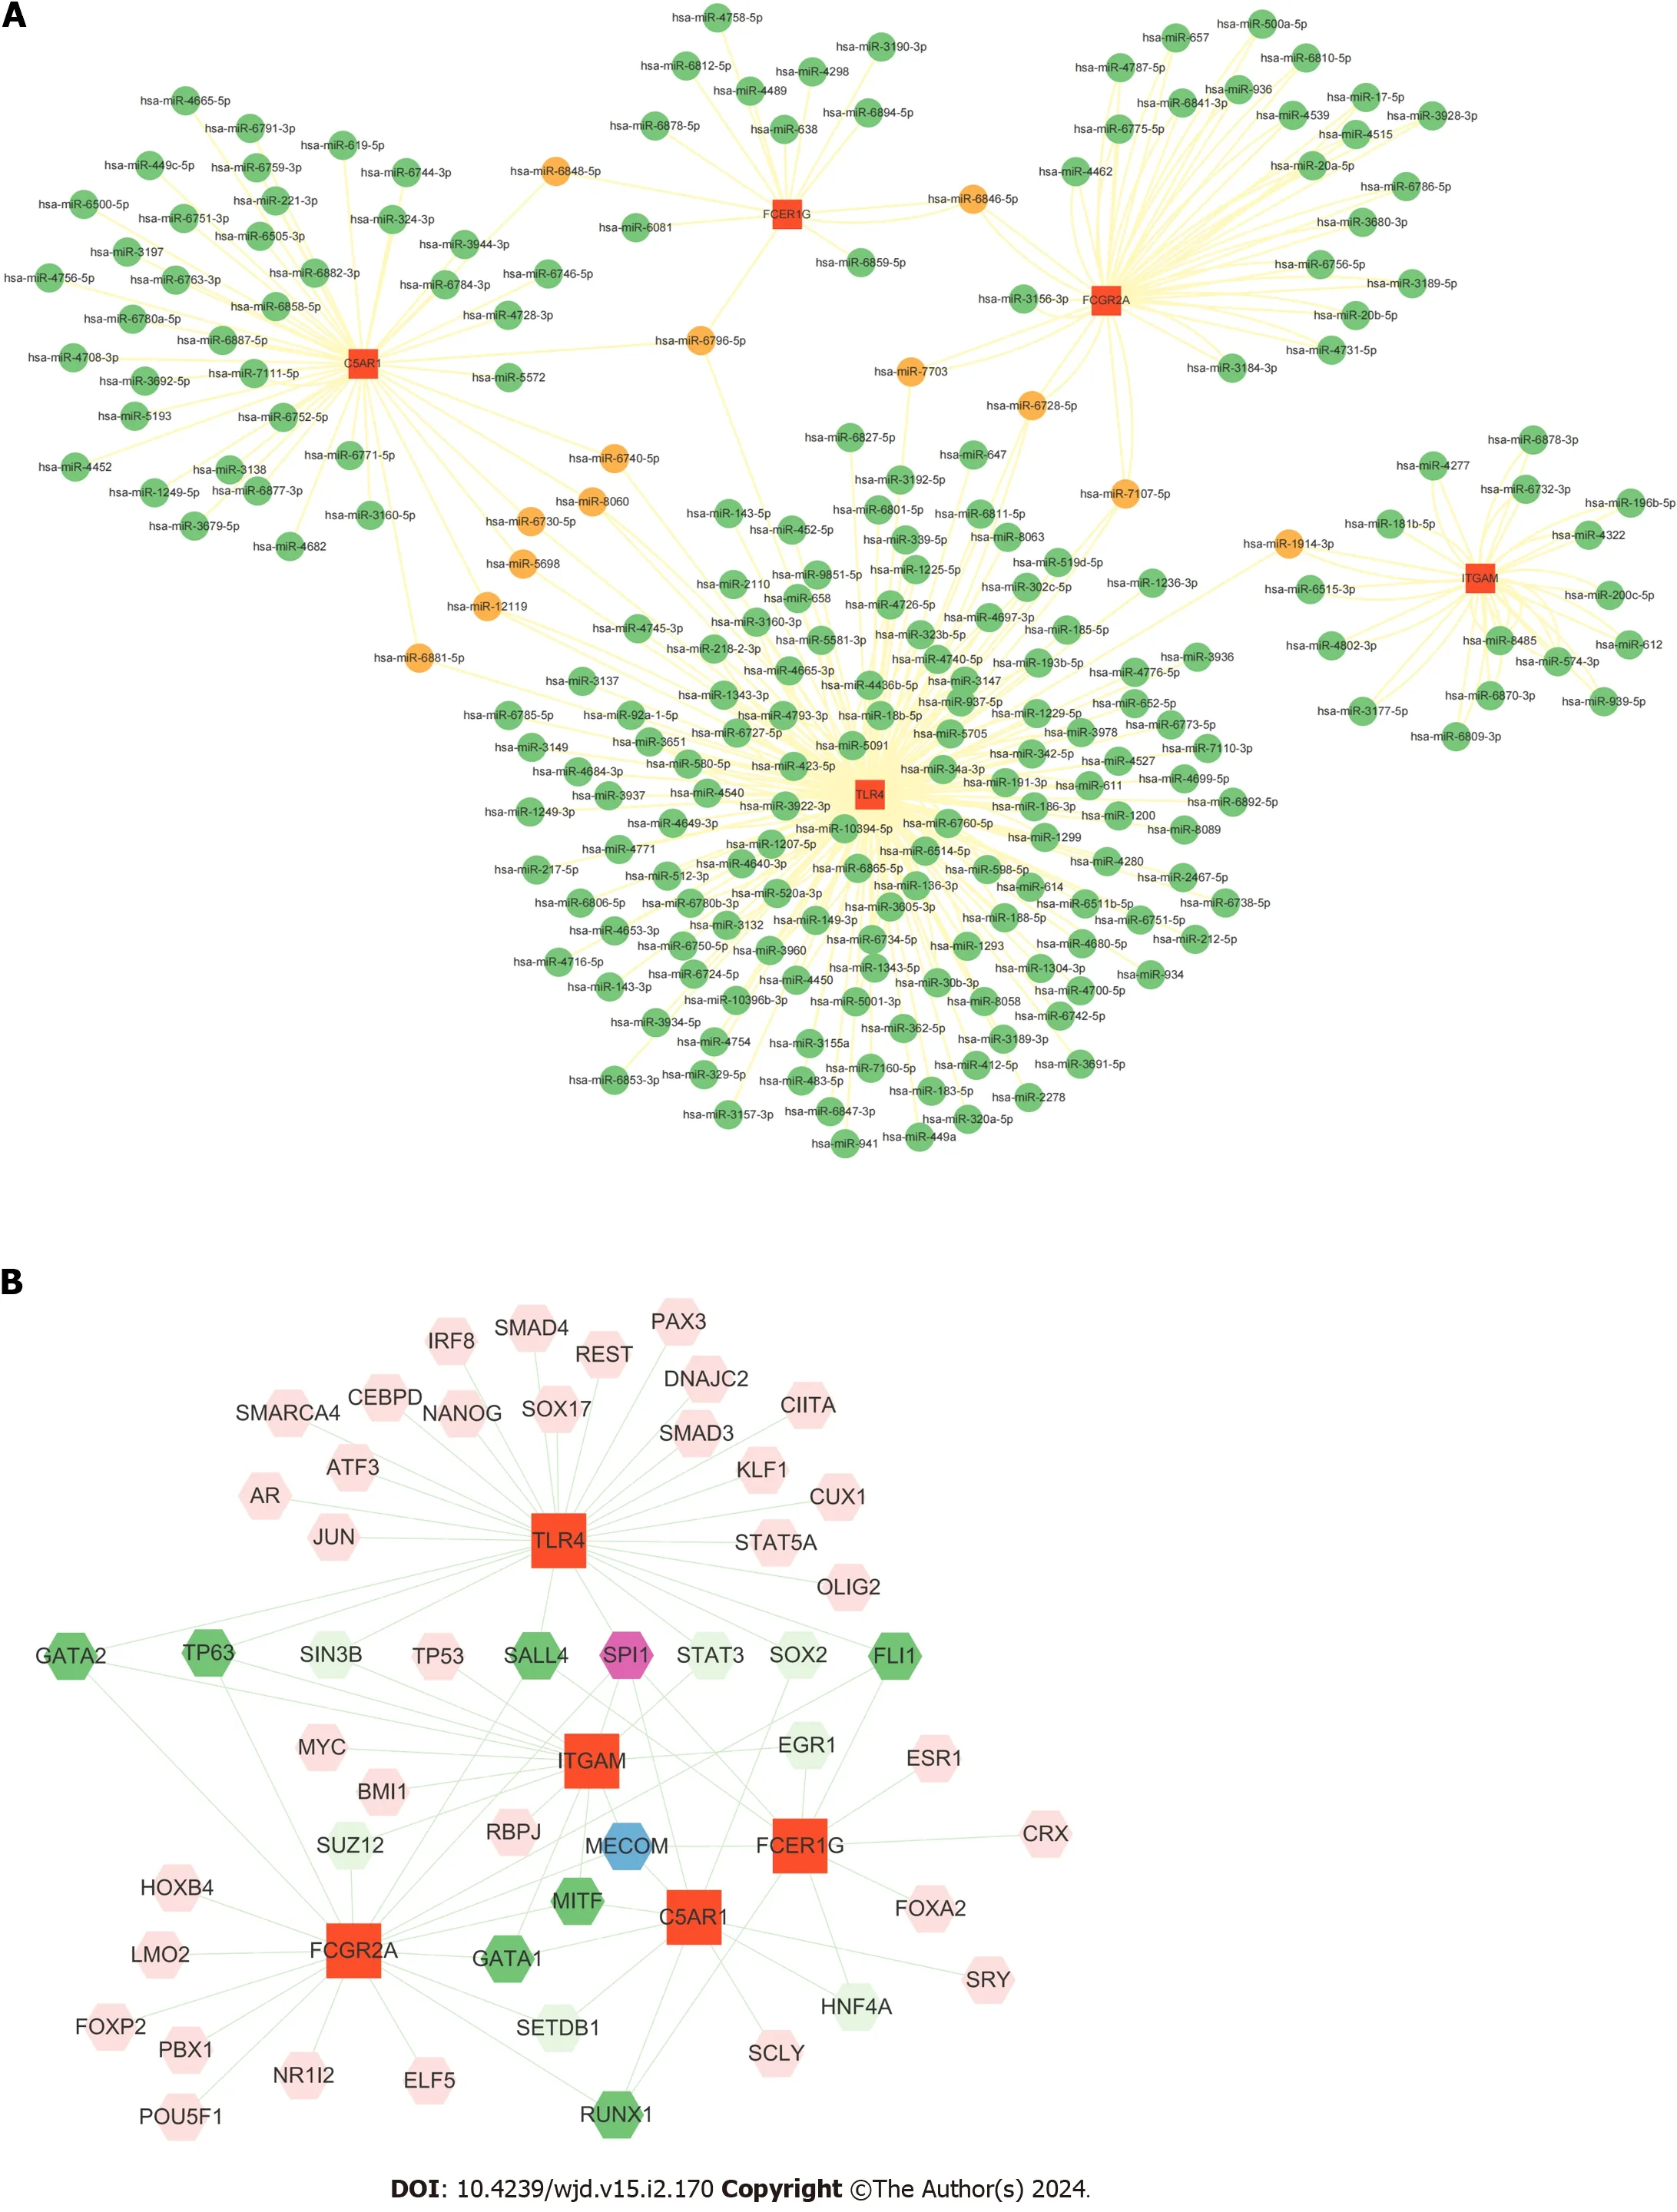
Figure 6 The interaction of hub genes with miRNA/transcriptional factors. A: Interaction network between the hub genes and their targeted miRNAs.Hub genes are presented in red squares,whereas miRNAs are shown in green circles.Orange circles represent miRNAs targeting two or more genes simultaneously;B: Construction of the transcriptional factor-gene interaction network from Cytoscape.
TF-gene interaction network
The top ranked TFs were SPI1,MECOM,GATA2,TP63,SALL4,GATA1,MITF,RUNX1 and FLI1 (Figure 6B).Based on the results,we found thatTLR4was coregulated by 26 TFs,the highest among the identified hub genes.
Functional analysis of hub genes by single-gene GSEA
We performed GSEA onTLR4,ITGAM,C5AR1,FCER1GandFCGR2Ato explore the role of these genes in the course ofH.pyloriinfection and T2DM and found the top 10 significant items (Figure 7).According to GSEA results,it suggested that all these five genes play a direct or indirect role in the pathogenesis ofH.pyloriinfection and T2DM.For example,FCG2Ais involved in the signaling pathway of “type 1 diabetes mellitus” and the “insulin signaling pathway”,C5AR1andFCER1Gare involved in the signaling pathway of “type 1 diabetes mellitus”,andITGAMis involved in the signaling pathway of “glycosaminoglycan biosynthesis chondroitin sulfate”.
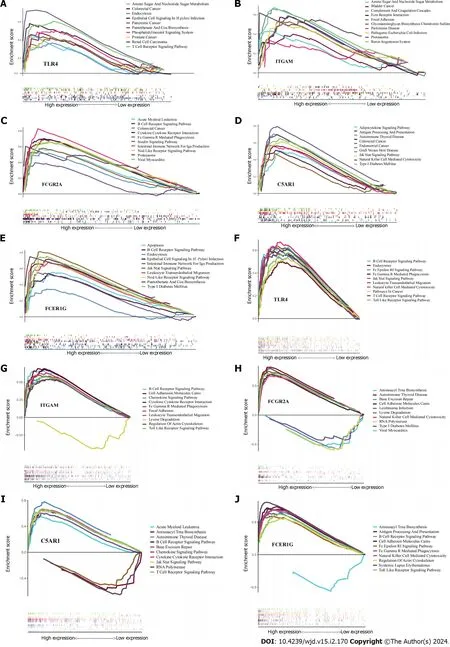
Figure 7 Results of single-gene gene set enrichment analysis. A-E: Helicobacter pylori infection;F-J: Type 2 diabetes mellitus.
DlSCUSSlON
Approximately 50% of the world’s population is infected withH.pylori,and the infection rate is even higher in patients with T2DM.Infected patients with T2DM have worse blood glucose control abilities,with great social and economic burdens[7,8].However,the detailed mechanism of the interaction between T2DM andH.pyloriinfection remains unknown.Therefore,it is necessary to increase our understanding of the underlying mechanisms leading to the risk ofH.pyloriinfection and T2DM to develop effective treatment approaches.
In this study,we investigated the biological functions,expression levels,and correlations with immune infiltrates of common genes with significantly altered expression in bothH.pylori-infected individuals and T2DM patients through integrated bioinformatics analyses.Our results showed that expression of 67 overlapping genes was altered in gastric samples from bothH.pylori-infected individuals and T2DM patients.Among these genes,48 were upregulated and 19 downregulated.Five hub genes were further identified through PPI analysis.However,regardless of the statistical probability,the causality between a candidate genotype and the phenotype of the host remains uncertain[27].To further identify the relationship between genotype (the 5 hub genes) and phenotype (H.pylori-associated T2DM),rigorous validation of mechanisms at the molecular,cellular,tissue,and whole-organism levels is needed.
Chronic low-grade inflammation has been definitively shown to correspond with obesity[28] and diabetes[29].However,whether obesity and diabetes drive the inflammation or vice versa remains to be elucidated.Gut microbiota play a critical role in the development of the host immune system,making it an important immune organ[30].Disturbance of the gut microbiota promotes inflammation within the lining of the intestines[31].The dysbiosis of the gut results in bacterial infiltration,allowing microbes to contact the epithelium and causing inflammation[32].Toll-like receptors (TLR) play a key role in host recognition of microbes[33].TLR4has been implicated in recognition of bacterial lipopolysaccharides,a key element of the cell walls of gram-negative bacteria.This triggers the expression of proinflammatory cytokines and chemokines,including tumor necrosis factor-alpha[34].This inflammatory response is strongly linked to insulin resistance,and bothTLR4and its coreceptor CD14 are needed to induce insulin resistance in mice[35].It is believed thatTLR4,one of the TLR family members,possesses the potential to trigger nuclear factor-κB when confronted with short-chain fatty acids.Consequently,this leads to subsequent stimulation of the immune system[36].Therefore,the inflammation caused byTLR4serves a crucial function in the development of T2DM related toH.pylori.The study conducted by Devarajetal[37] exhibited a notable rise in the level ofTLR4expression among individuals diagnosed with type 1 diabetes.This finding implies thatTLR4actively participates in the inflammatory state associated with diabetes.Moreover,knockout ofTLR4alleviated inflammation in rats with diabetes andTLR4antagonists attenuated atherogenesis in mice with diabetes[38].Based on our results,we speculated thatTLR4participates in the pathogenesis of H.pylori-associated T2DMviathe TLR signaling pathway.
Other hub genes,ITGAM[39],C5AR1[40],FCER1G[41] andFCGR2A[42],are also reported to be associated with diabetes.ITGAM,a monocyte/macrophage marker,is upregulated in T2DM patients[39].FCER1Gwas identified as a significant gene related to diabetic kidney disease.Gene Expression Omnibus validation using additional datasets showed that FCER1G is upregulated in diabetic glomerular lesions compared with normal tissues.This report also revealed that abnormal upregulation ofFCER1Gis related to diabetic glomerular lesions[41].
Clinical variability between individuals infected with any pathogen is enormous,ranging from silent to lethal.One of the main reasons is immunity differs among individuals[43].Tumor-infltrating immune cells function together to defend the body against invading factors,such as bacterial infection.Therefore,they can be used as important predictors for diagnosis and treatment of diseases[44].Based on KEGG pathway and immune cell infiltration analyses,we found thatH.pyloriinfection is associated with multiple immune cell changes,especially NK cells and regulatory T cells.Through single-gene GSEA,we found that high expression of the hub genesTLR4,FCGR2A,andFCER1Gwas associated with NK cell-mediated cytotoxicity in diabetes,which suggests thatH.pyloriinfection might change hub gene expression and downstream NK cells to induce T2DM.Further analysis suggested that these 5 hub genes all correlated with B cells,CD8+T cells,macrophages,neutrophils,and DCs.It has been shown that isolated NK cells from T2DM subjects show defects in the NK cell-activating receptors NKG2D and NKp46,in association with functional defects in NK degranulation capacity[45].Restrepoetal[46] demonstrated that chronic hyperglycaemia is significantly associated with defects in complement receptors and Fcγ receptors on isolated monocytes,resulting in phagocytosis impairment.Aninvitrostudy using macrophages derived from mouse bone marrow and treated with high glucose showed reduced antibacterial activity and phagocytosis for the treated macrophages[47].In the same study,reduced phagocytosis was shown in peritoneal macrophages from mice with T2DM.This might be related to the reduced glycolytic capacity and reserve of macrophages following long-term sensitization to high levels of glucose.Reactive oxygen species production was reportedly reduced in isolated neutrophils from T2DM tuberculosis patients following phorbol 12-myristate 13-acetate stimulation,and this defect in reactive oxygen species production was associated with increased levels of resistin in T2DM patient serum[48].In a comparable study,Perneretal[49] documented the inhibition of superoxide production in neutrophils isolated from healthy individuals when subjected to a high-glucose environment.This hindrance was observed to be a consequence of the suppression of glucose-6-phosphate dehydrogenase,which disrupted the generation of nicotinamide adenine dinucleotide phosphate.Thus,we speculate that these 5 hub genes are involved inH.pylori-associated T2DM through immune infiltration.We will validate their relationship through experiments in the future.
This study provides some new insights into the pathogenesis ofH.pylori-associated T2DM.However,several limitations should be mentioned.First of all,this study had a relatively small sample size and a larger sample size would be necessary for further investigations.Secondly,hub genes were identified using bioinformatics analysis and validated by a small clinical sample.Validation including RNA-seq from a larger clinical cohort is needed.It is necessary to investigate the potential underlying mechanisms involved in these findings in future large-scale prospective studies.Thirdly,despite statistical probability,the causality between a candidate genotype and the phenotype of the host is uncertain[27].To identify the relationship between genotype (the 5 hub genes) and phenotype (H.pylori-associated T2DM),rigorous validation of mechanisms at the molecular,cellular,tissue,and whole-organism levels is needed.
CONCLUSlON
We report 67 common DEGs and five hub genes (TLR4,ITGAM,C5AR1,FCER1GandFCGR2A) inH.pyloriinfection and T2DM.We validated expression of the five hub genes by RT-qPCR.All hub genes were significantly upregulated in T2DM patients withH.pyloriinfection compared with noninfected T2DM patients.Immune infiltration analysis showed thatH.pylori-infected gastric tissues generally contained a higher proportion of regulatory T cells,activated NK cells,eosinophils and neutrophils.Our gene-miRNA analysis detected 13 miRNAs with at least two gene cross-links,and TFgene interaction networks showed thatTLR4to be coregulated by 26 TFs,the largest number of TFs among the 5 hub genes.This study provides a new idea for elucidating the pathogenesis of H.pylori-associated T2DM at the genetic level.
ARTlCLE HlGHLlGHTS
Research background
This prevalence rate ofHelicobacterpylori(H.pylori) is high,especially in less developed countries.Its infection related to not only gastric diseases but also extragastric diseases such as type 2 diabetes mellitus (T2DM).However,the underlying mechanisms connectingH.pyloriinfection and T2DM remains unclear.
Research motivation
The potential molecular connections betweenH.pyloriinfection and T2DM are needed to be identified,in order to further elucidate the pathogenesis and the new treatment strategy ofH.pylori-infected T2DM.
Research objectives
We aimed to explore the potential molecular connections betweenH.pyloriinfection and T2DM using bioinformatics analysis.In the future research,we will investigating these identified genes and downstream signaling pathway to further understand their relationship.
Research methods
Differentially expressed genes from three datasets commonly present in patients withH.pyloriinfection and T2DM were identified.Hub genes were validated by RT-qPCR using human gastric biopsy samples.Correlations between hub genes and immune cell infiltration,miRNAs,and transcription factors were further analyzed.
Research results
This is the first study to identify the key genes and pathways associated withH.pyloriinfection and T2DM using integrated bioinformatics analysis.We identified five hub genes,all of which were closely related to immune cell infiltration.
Research conclusions
We were the first to find out that the 5 hub genes identified are playing important roles in the pathogenesis ofH.pyloriinfected T2DM.
Research perspectives
It is necessary to investigate the potential underlying mechanisms involved in these findings in future large-scale prospective studies.
FOOTNOTES
Co-corresponding authors:Guo-Xin Zhang and Xiao-Ying Zhou.
Author contributions:Zhou XY and Zhang GX concepted and designed the research study;Chen H and Zhou X developed methodology;Chen H acquired the data;Zhou XY analyzed and interpretated the data;Chen H wrote the first version of the manuscript;Zhang GX and Zhou XY revised the manuscript;all authors were involved in the critical review of the results and have contributed to,read,and approved the final manuscript.Zhou XY and Zhang GX contributed equally to this work as co-corresponding authors.The reasons for designating Zhou XY and Zhang GX as co-corresponding authors are threefold.First,the research was performed as a collaborative effort,and the designation of co-corresponding authorship accurately reflects the distribution of responsibilities and burdens associated with the time and effort required to complete the study and the resultant paper.This also ensures effective communication and management of post-submission matters,ultimately enhancing the paper's quality and reliability.Second,the overall research team encompassed authors with a variety of expertise and skills from different fields,and the designation of co-corresponding authors best reflects this diversity.This also promotes the most comprehensive and in-depth examination of the research topic,ultimately enriching readers' understanding by offering various expert perspectives.Third,Zhou XY and Zhang GX contributed to almost the same funding on this research.The choice of these researchers as co-corresponding authors acknowledges and respects this equal contribution,while recognizing the spirit of teamwork and collaboration of this study.In summary,we believe that designating Zhou XY and Zhang GX as co-corresponding authors of is fitting for our manuscript as it accurately reflects our team's collaborative spirit,equal contributions,and diversity.
Supported byNational Natural Science Foundation of China,No.82100594.
lnstitutional review board statement:The original data in this study were retrieved from the public GEO database with an open license for data use.This study was approved by the ethic committee of the First Affiliated Hospital of Nanjing Medical University (Approval No.2022-SR-406).
lnformed consent statement:All study participants or their legal guardian provided informed written consent about personal and medical data collection prior to study enrollment.
Conflict-of-interest statement:The authors declare no potential conflicts of interest with respect to the research,authorship,and/or publication of this article.
Data sharing statement:The datasets used and analyzed during the current study are available from the corresponding author on reasonable request.
Open-Access:This article is an open-access article that was selected by an in-house editor and fully peer-reviewed by external reviewers.It is distributed in accordance with the Creative Commons Attribution NonCommercial (CC BY-NC 4.0) license,which permits others to distribute,remix,adapt,build upon this work non-commercially,and license their derivative works on different terms,provided the original work is properly cited and the use is non-commercial.See: https://creativecommons.org/Licenses/by-nc/4.0/
Country/Territory of origin:China
ORClD number:Xiao-Ying Zhou 0000-0002-6529-0243.
S-Editor:Lin C
L-Editor:A
P-Editor:Chen YX
 World Journal of Diabetes2024年2期
- World Journal of Diabetes的其它文章
- Elucidating the cardioprotective mechanisms of sodium-glucose cotransporter-2 inhibitors beyond glycemic control
- Genotype-based precision nutrition strategies for the prediction and clinical management of type 2 diabetes mellitus
- Emerging and multifaceted potential contributions of polyphenols in the management of type 2 diabetes mellitus
- Experience of humanistic nursing in hemodialysis nursing for patients with diabetic kidney disease
- Analysis of the influencing factors and clinical related characteristics of pulmonary tuberculosis in patients with type 2 diabetes mellitus
- Vitamin D,selenium,and antidiabetic drugs in the treatment of type 2 diabetes mellitus with Hashimoto's thyroiditis
