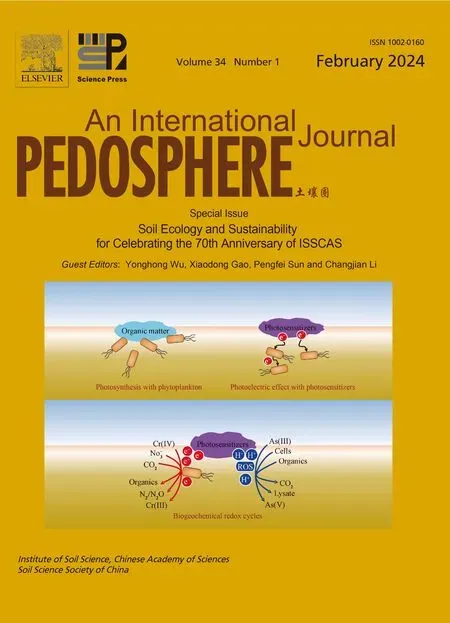
Effects of herbicide butachlor application on the growth of periphytic biofilms and nitrogen loss in paddy systems
Yanhui ZHAO ,Mingjun LEI ,Liandong JING ,Fan XIA ,Meixia YAN ,Jiantong LIU ,Yonghong WU,Yunli WU,* and Chenxi WU,*
1Ecology and Environment Monitoring and Scientific Research Center,Yangtze Basin Ecology and Environment Administration,Ministry of Ecological and Environment,Wuhan 430010(China)
2College of Chemistry and Environmental Protection Engineering,Southwest Minzu University,Chengdu 610041(China)
3State Key Laboratory of Freshwater Ecology and Biotechnology,Institute of Hydrobiology,Chinese Academy of Sciences,Wuhan 430072(China)
4State Key Laboratory of Soil and Sustainable Agriculture,Institute of Soil Sciences,Chinese Academy of Sciences,Nanjing 210008(China)
ABSTRACT The application of butachlor as an herbicide in paddy fields is widely practiced,aiming to increase rice yield by directly or indirectly influencing the paddy environment.Periphytic biofilms,which form at the soil-water interface in paddy fields,are complex bioaggregates that play an important role in nitrogen(N)cycling.The objective of this study was to investigate the effect of butachlor on periphytic biofilm growth and N cycling under both light and dark conditions in the laboratory.The results revealed that butachlor application hindered the growth of periphytic biofilms and led to the dominance of Cyanobacteria as the primary prokaryotes,while inhibiting the development of eukaryotic Trebouxiophyceae.Furthermore,the application of butachlor reduced the richness and diversity of prokaryotes,but increased those of eukaryotes in periphytic biofilms.The light treatments exhibited higher total N loss because light favored periphytic biofilm growth and enhanced ammoniumassimilation and nitrification.Additionally,butachlor application resulted in the increased retention of and nitrate and an increase in N loss via denitrification.The abundances of functional genes encoding enzymes such as ammonia monooxygenase,nitrite reductase,and nitrous oxide reductase were increased by butachlor application,favoring nitrification and denitrification processes.Overall,the results suggest that butachlor application leads to an increase in total N loss mainly through denitrification in paddy systems,particularly in the presence of periphytic biofilms.Thus,the results may provide valuable insights into the changes in periphytic biofilm growth and N cycling induced by butachlor,and future studies can further explore the potential implications of these changes in paddy soils.
Key Words: ammonia-oxidizing bacteria,amoA,denitrification,denitrifying bacteria,nirK,nitrification,nitrogen cycling,nosZ,volatilization
INTRODUCTION
Rice is a staple food for nearly half of the world’s population,but the low use efficiencies of nitrogen (N)fertilizers are a major limiting factor of rice yield increase in paddy systems (Chenet al.,2009;Shiet al.,2017).Nitrogen uptake by weeds and microorganisms,ammonia(NH3)volatilization,and denitrification are considered to be the main pathways of N fertilizer loss(Hussainet al.,2008;Singhet al.,2015).Butachlor,a widely used pre-emergence herbicide in China (Yuet al.,2003;Lianget al.,2005;Wanget al.,2015),demonstrates excellent weed-killing effectiveness and yield-increasing effect on rice (Segherset al.,2005;Koushiket al.,2012;Jianget al.,2014).However,it also affects the microbial community structure and enzymatic activities in rice paddy soils(Minet al.,2001;Kimet al.,2013).Studies found that butachlor can decrease the photosynthesis,chlorophylla(Chla) content,and N fixation of some cyanobacteria(Pandey and Rai,2002;Wuet al.,2004;Chenet al.,2007).Concerns have been raised regarding the potential impact of butachlor application on the non-target organisms in paddy soils(Yanget al.,2019).
Paddy fields are ideal niches for periphytic biofilms because of their unique ecological conditions (e.g.,light,water,temperature,and nutrients)(Kasai,1999;Zhaoet al.,2018).Periphytic biofilms are a ubiquitous“third phase”that develops at the interface of water and soil in paddy fields.They act as temporary nutrient sinks that facilitate nutrient“buffer”and“sustainable release”(Battinet al.,2003;McCormicket al.,2006) and play a vital role in N cycling by changing soil pH and redox conditions and promoting N conversion catalyzed by a variety of enzymes(Larned,2010;Ellwoodet al.,2012;Wuet al.,2016;Liuet al.,2017;Zhaoet al.,2018;Zhao J Yet al.,2021).However,limited studies have investigated the systematic variations in N cycling and the effects of periphytic biofilms in paddy soils following the application of butachlor.
Given the potential physiological toxicity of butachlor(Agrawalet al.,2014),we hypothesized that its application may negatively impact the growth of periphytic biofilms and subsequently affect the N cycle in paddy systems.Thus,the purposes of the present study were to:i) characterize the growth of periphytic biofilms with or without butachlor application in paddy soils,and ii)evaluate N loss and discuss the role of periphytic biofilms in N cycling with butachlor application.Our work will provide a scientific basis for improving N fertilizer utilization and protecting the paddy soil environment and ecology.
MATERIALS AND METHODS
Soil,fertilizer,and butachlor
The soil used was collected from the 0-20 cm layer of a butachlor-free paddy field of Hubei Academy of Agricultural Sciences,Wuhan,China.The soil was homogenized and sieved to<2 mm before use.Its physical and chemical properties were:pH 7.15,organic matter(OM)37.92 g kg-1,total N(TN)1.16 g kg-1,total phosphorus(TP)2.18 g kg-1,ammonium0.53 g kg-1,nitrate0.21 g kg-1,nitrite0.002 g kg-1,available phosphorus(AP) 1.53 g kg-1,and available potassium (AK) 0.41 g kg-1.
The fertilizer was purchased from Stanley Co.,Ltd.,China,and its nutrient contents are listed in Table SI(see Supplementary Material for Table SI).The butachlor(60%active ingredient)was purchased from Shandong Qiaochang Modern Agriculture Co.,Ltd.,China.
Experimental setup
Four treatments were set up in triplicates in the microcosm experiment:butachlor application and incubation with light(BL),incubation with light but no butachlor application(L),butachlor application and incubation in the dark(BD),and incubation in the dark and no butachlor application(D).A total of 36 beakers(4.6-cm diameter and 500-mL volume)were used.In each beaker,0.25 kg fresh soil was added to make a 5 cm-thick soil layer,and 340 mL of distilled water was added.In addition,0.1 g fertilizer was added.In 18 of the beakers,butachlor was added according to the manufacturer’s recommended rate,equivalent to 2.0 L ha-1(Jianget al.,2014).For the dark treatments(i.e.,D and BD),the beakers were wrapped with aluminum foils.All beakers were kept at 25°C and illuminated using fluorescent(40±5 μmol photons m-2s-1)with a 14 h/10 h light/dark cycle(Yanet al.,2018;Zhaoet al.,2020;Zhao Y Het al.,2021).The experiment lasted for 21 d.
Sampling and analysis
On days 7,14,and 21,three beakers from each treatment were retrieved.The overlying water in each beaker was siphoned into a conical flask.The dissolved oxygen(DO)concentration and pH of the overlying water were measured using a Hach HQ40d meter (Loveland,Co.,USA).The concentrations of TN,,and TP were determined according to the methods of MEPC(2002).
Samples were collected using a core sampler(4.6 cm in diameter).Each core sample was devided into a periphytic biofilm layer(0-0.2 cm)and a soil layer(0.2-5 cm)(Suet al.,2017;Zhaoet al.,2020).The samples were homogenized and freeze-dried.Total Kjeldahl N(TKN)content was determined with an automatic Kjeldahl N analyzer(S5,Behr,Germany),andcontents were determined spectrophotometrically(MEPC,2002).The sum of TKN,,andcontents was considered as soil TN.Soil TP was measured as described previously(Rubanet al.,1999).Soil AP was measured after extraction with 0.5 mol L-1NaHCO3,and AK was determined following extraction with 1 mol L-1ammonium acetate.The total N loss(TNL)of the system was determined by subtracting the remaining N from the TN present in the system.The N loss due to denitrification was calculated by subtracting the amount of NH3volatilization loss from the TNL(Zhaoet al.,2020).
The NH3volatilized was trapped with sponges according to Wanget al.(2002).Briefly,sponges(2-cm thickness and 4.6-cm diameter)were soaked in phosphoglycerine solution.In each beaker,two pre-treated sponges were placed one on top of the other,with a thin layer of air in between.In addition,the lower one was 4 cm above the overlying water.Sponges were collected and refreshed at 2-d intervals.The NH3concentrations were measured using a continuous flow analyzer(SAN++,Skalar,The Netherlands)after extraction with 200 mL 1 mol L-1KCl.
The OM content of periphytic biofilms was determined gravimetrically(Zhanget al.,2018).The Chlaof periphytic biofilms was extracted with 90% acetone and quantified spectrophotometrically(Songet al.,2017).
The nitrification potential(NP)of periphytic biofilms was determined using the chlorate inhibition method(Wanget al.,2014).Briefly,0.5 g fresh biofilm sample was incubated in a 50 mL centrifuge tube containing 1 mmol L-1(NH4)2SO4and 10 mmol L-1KClO3in 20 mL phosphate buffer at 25°C in the dark for 24 h.Then,was extracted with 2 mol L-1KCl and quantified spectrophotometrically usingN-(1-naphthyl)ethylenediamine dihydrochloride.The denitrification potential(DNP)of biofilms was determined using the acetylene inhibition method according to Zhaoet al.(2018).Briefly,1.0 g fresh biofilm sample was added to a 250-mL airtight jar containing 60 mL nutrient solution(40 mg L-1).The jar was flushed with dinitrogen(N2)gas,and acetylene was added at 10%(volume/volume).The,the jar was shaken gently at 120 r min-1and 25°C in the dark.Headspace sample was collected every 3 h for 24 h,and nitrous oxide(N2O)was measured using a 7890 A gas chromatograph with an electron capture detector(Agilent,USA).
For DNA extraction,periphytic biofilm sample was washed three times with phosphate-buffered saline to eliminate any superficial DNA and microbes,freeze-dried,and extracted using a soil DNA kit(Omega Bio-tek,USA)(Suet al.,2017;Faheemet al.,2020).The quality and concentration of DNA were determined by 1.0% agarose gel electrophoresis and a NanoDrop®ND-2000 spectrophotometer (Thermo Scientific Inc.,USA),respectively.The primer set 338F(5′-ACTCCTACGGGAGGCAGCAG-3′)and 806R (5′-GGACTACHVGGGTWTCTAAT-3′) was used to amplify the V3-V4 region of prokaryotes,and the primer set ITS1-F(5′-CTTGGTCATTTAGAGGAAGTAA-3′)and ITS2-R(5′-GCTGCGTTCTTCATCGATGC-3′)was used to amplify the ITS1 region of fungi(Gardes and Bruns,1993;Liuet al.,2016;Caiet al.,2017).Then,tagencoded high-throughput sequencing was performed on an Illumina MiSeq platform(Illumina,USA)according to the standard protocols of Majorbio Bio-Pharm Technology Co.,Ltd.,China.Sequences were clustered into operational taxonomic units(OTUs)at 97%similarity using the Usearch program.Taxonomic classification of bacterial and fungal OTUs was performed using the SILVA (version 138) and UNITE(version 8.0)databases,respectively,with the RDP Classifier(version 2.11)at 70%identity threshold(Wanget al.,2007).
The abundances of functional genes,including those encoding archaeal and bacterial ammonia monooxygenase(amoA),nitrite reductase(nirK),and nitrous oxide reductase(nosZ),were measured by real-time quantitative polymerase chain reaction(PCR)in three replications.The primer pairs Arch-amoA-F and Arch-amoA-R (Franciset al.,2005),amoA1Fand amoA2R(Rotthauweet al.,1997),nirK876 and nirK1040(Henryet al.,2004),and nosZ2Fand nosZ2R(Henryet al.,2006)were used for archaealamoA,bacterialamoA,nirK,andnosZ,respectively.The reaction system was 20 μL,including 10 μL of 2×RealMasterMix(Tiangen,China),1 μL of each primer (10 μmol L-1),7 μL of ddH2O,and 1 μL of template DNA.The standard was obtained by performing serial dilutions of the plasmid with the target gene.After the determination of fluorescence,melting curve analysis was also conducted to confirm PCR product specificity.In this study,the reaction efficiencies of quantitative PCR varied from 92.4%to 113.6%,withr2values>99%for all runs.The abundances of all functional genes were calculated as copy number per gram of dry sample.
Statistics
Data were analyzed using one-way analysis of variance followed by the least significant differencepost hoctest using the SPSS 18.0 software.The significance level was set atP <0.05.Redundancy analysis(RDA)was performed using the CANOCO 4.5 software to analyze the relationships between environmental parameters and biofilm properties.Data are expressed as mean±standard deviation.
RESULTS
Changes of DO and pH in overlying water
During the experiment,the light treatments (i.e.,L and BL) consistently exhibited higher DO and pH levels compared to the dark treatments(i.e.,D and BD)(Table I).The highest DO and pH values on day 7 were found in BL,whereas the highest values on day 21 were found in L.There was no significant difference in DO and pH on day 14 between L and BL.On day 21,both BL and L showed slight decreases in DO and pH.There was no significant difference in DO and pH on day 7 betweem D and BD,but BD had significantly higher DO and pH on days 14 and 21 compared to D.

TABLE IpH and dissolved oxygen(DO)concentrations of the overlying water of paddy systems in the different treatments during the laboratory microcosm experiment
Chl a and OM contents of periphytic biofilms
The Chlacontents in dark treatments were below the detection limit and therefore are not shown in Fig.1.In BL,both OM and Chlaincreased markedly on day 14 and then decreased on day 21.On day 7,L had significantly higher OM and Chlalevels compared to BL.However,on days 14 and 21,BL exhibited the highest levels of the two.The two dark treatments exhibited no significant difference in OM content except on day 21 when BD had significant lower OM than D.
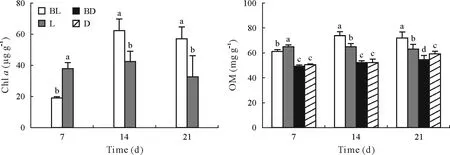
Fig.1 Changes in the chlorophyll a(Chl a)and organic matter(OM)contents in the periphytic biofilms at the paddy soil-water interface in the different treatments during the 21-d laboratory microcosm experiment.The error bars are standard deviations of the means(n=3).Different letters above the bars indicate significant difference between treatments for a given sampling time(P <0.05).BL=butachlor application and incubation with light;L=incubation with light but no butachlor application;BD=butachlor application and incubation in the dark;D=incubation in the dark and no butachlor application.
Microbial community composition in the periphytic biofilms
The rarefaction curves for both the prokaryotic and eukaryotic communities indicated that the sequencing depth used sufficiently captured the variation in OTU density within the periphytic biofilms(Fig.S1,see Supplementary Material for Fig.S1).Therefore,the data were suitable for analysis of the microbial communities.The bacterial 16S rRNA gene sequencing yielded 1 622 prokaryotic OTUs that were clustered into 56 phyla and 108 classes.The fungal 18S rRNA yielded 5 242 eukaryotic OTUs that were clustered into 50 phyla and 124 classes.At the beginning of the experiment,the soil had high richness of eukaryotes and prokaryotes(Fig.S2,see Supplementary Material for Fig.S2).The rankabundance curves showed lower richness of prokaryotes and eukaryotes in the light treatments.Butachlor application decreased the richness of prokaryotes but increased that of eukaryotes regardless of light condition.
The class-level distributions of prokaryotic and eukaryotic communities within the periphytic biofilms were found to vary significantly across different treatments,as reflected by changes in relative abundances(Fig.2).Cyanobacteria were the dominant prokaryotic class throughout the experiment in the light treatments,whereas Actinobacteria were the dominant prokaryotic class in the dark treatments(Fig.2a).Moreover,butachlor application increased the abundance of Cyanobacteria regardless of the light condition(Fig.S3a,see Supplementary Material for Fig.S3).In contrast,Actinobacteria exhibited no significant differences between treatments.Cyanobacteria were the key prokaryotic class in the light treatments.Norank_p_Cryptomycota were the dominant eukaryotes in BL,Trebouxiophyceae were the dominant class in L,and Imbricatea were the most abundant class in D(Fig.2b).Notably,a higher abundance of Trebouxiophyceae was detected in L than in BL(Fig.S3b).Moreover,the abundance of norank_p_Cryptomycota was significantly higher in BL than in L.These findings suggest that light promoted the growth of Trebouxiophyceae and butachlor application stimulated the growth of norank_p_Cryptomycota.
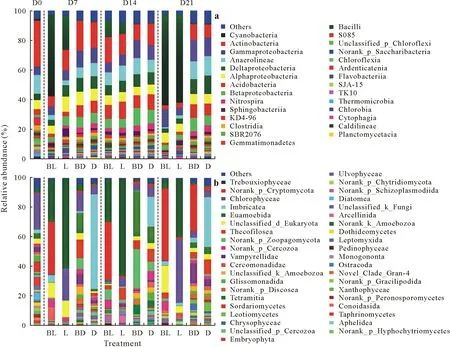
Fig.2 Changes in the relative abundances of prokaryotic(a)and eukaryotic classes(b)in the periphytic biofilms at the paddy soil-water interface in the four treatments during the 21-d laboratory microcosm experiment.BL=butachlor application and incubation with light;L=incubation with light but no butachlor application;BD=butachlor application and incubation in the dark;D=incubation in the dark and no butachlor application.D0=day 0;D7=day 7;D14=day 14;D21=day 21.
N in the overlying water
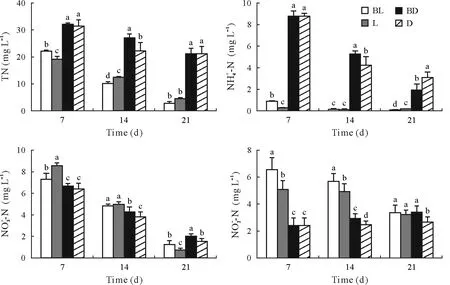
Fig.3 Changes of total N(TN),,,and concentrations in the overlying water of the paddy systems in the four treatments during the 21-d laboratory microcosm experiment.The error bars are standard deviations of the means(n=3).Different letters above the bars indicate significant difference between treatments for a given sampling time(P <0.05).BL=butachlor application and incubation with light;L=incubation with light but no butachlor application;BD=butachlor application and incubation in the dark;D=incubation in the dark and no butachlor application.
N in the periphytic biofilms
The TN concentration in periphytic biofilms increased with time in the dark conditions,but it first increased and then decreased in BL and decreased continuously in L(Fig.4).The TN concentration was significantly higher in the light treatments than in the corresponding dark treatments throughout the experiment.The TN concentration in D was higher than that in BD.In contrast,the TN in L was significant higher than that in BL on day 7 but significantly lower on days 14 and 21.Theconcentration in periphytic biofilms was much higher in the dark treatments compared to the light treatments.For the first 14 d,theconcentration in periphytic biofilms was significantly higher in BL than in L but not significantly different between BD and D.TheN concentration was higher in the light treatments compared to the corresponding dark treatments,and the treatments with butachlor application exhibited higherconcentration on days 14 and 21 compared to the corresponding treatments without butachlor application.Theconcentration increased on day 14 and then decreased in all treatments,and it was higher in the treatments with butachlor application compared to the treatments without butachlor application for the same light condiction.The BL treatment had the highestconcentration at all times.

Fig.4 Changes of total N(TN),,,and contents in the periphytic biofilms at the paddy soil-water interface in the four treatments during the 21-d laboratory microcosm experiment.The error bars are standard deviations of the means(n=3).Different letters above the bars indicate significant difference between treatments for a given sampling time(P <0.05).BL=butachlor application and incubation with light;L=incubation with light but no butachlor application;BD=butachlor application and incubation in the dark;D=incubation in the dark and no butachlor application.
NH3 volatilization losses from the paddy systems
The changes in NH3volatilization loss are presented in Fig.5.Initially,NH3volatilization loss was higher in L compared to BL,and there was no significant difference between BD and D.Subsequently,NH3volatilization loss in L decreased rapidly until day 10,when it was very close to that in BL.On day 8,the NH3volatilization loss in BD reached a peak and then decreased gradually.There was no significant difference in NH3volatilization loss between BD and D during days 12-20.
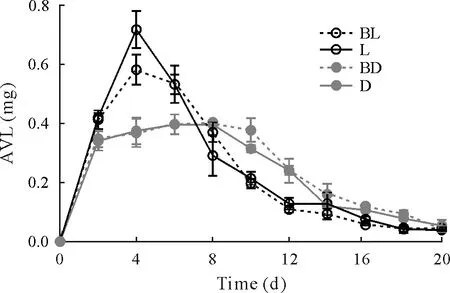
Fig.5 Changes in ammonia volatilization loss (AVL) from the paddy systems of the four treatments during the 21-d laboratory microcosm experiment.The error bars are standard deviations of the means(n=3).BL=butachlor application and incubation with light;L=incubation with light but no butachlor application;BD=butachlor application and incubation in the dark;D=incubation in the dark and no butachlor application.
NP,DNP,and N cycling-associated gene abundances
During the experiment,the NP values in all treatments displayed initial increases followed by subsequent decreases except that the NP in BD increased continuously(Fig.6).Furthermore,NP was higher in the light treatments compared to the corresponding dark treatments and higher in the butachlor application treatments compared to the no butachlor application treatments.Similarly,the DNP values in all treatments displayed initial increases followed by subsequent decreases except that the DNP in L increased continuously.Furthermore,DNP was higher in the light treatments compared to the corresponding dark treatments.There was no significant difference in DNP between BL and L on days 7 and 21,and there was no significant difference between BD and D on day 7.
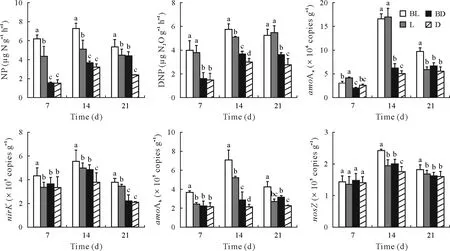
Fig.6 Changes in the nitrification potential(NP),denitrification potential(DNP),and the abundances of genes encoding archaeal(amoAa)and bacterial ammonia monooxygenase(amoAb),nitrite reductase(nirK),and nitrous oxide reductase(nosZ)in the periphytic biofilms at the paddy soil-water interface in the four treatments of the 21-d laboratory microcosm experiment.The error bars are standard deviations of the means(n=3).Different letters above the bars indicate significant difference between treatments for a given sampling time(P <0.05).BL=butachlor application and incubation with light;L=incubation with light but no butachlor application;BD=butachlor application and incubation in the dark;D=incubation in the dark and no butachlor application.
The abundance of archaealamoAincreased and then stabilized with time in the dark treatments,whereas it first increased and then decreased in the light treatments(Fig.6).The abundance of archaealamoAwas higher in the light treatments than in the corresponding dark treatments.Furthermore,the treatments with butachlor application had a higher archaealamoAabundance towards the end of the experiment.The abundances of bacterialamoAwere lower than those of archaealamoA.The abundance of bacterialamoAwas higher in BL than in the other treatments.The abundances ofnirKandnosZfirst increased and then decreased.The abundance ofnirKwas higher than that ofnosZ.ThenirKabundance in BL was significantly higher than those in the other treatments.Similarly,thenirZabundance in BL was significantly higher than those in the other treatments except on day 7.
N losses from the paddy systems
The TNL ranged from 25.55%to 38.27%for the four treatments(Table II).Notably,butachlor application resulted in higher denitrification losses compared to the treatments without butachlor.Furthermore,the light treatments induced higher TNL than the dark treatments.The BL treatment exhibited the highest TNL and denitrification loss among all treatments.There was no significant difference in NH3volatilization loss between the treatments.Denitrification loss was the primary N loss pathway for the light treatments,whereas NH3volatilization loss was the predominant N loss pathway for the dark treatments.

TABLE IIPercentages of N lossa) from the paddy systems of the four treatments in the 21-d laboratory microcosm experiment
Influences of periphytic biofilm properties and N loss on the microbial community
To evaluate the effects of periphytic biofilm properties and N loss on the abundance and diversity of microbial community in the butachlor-applied paddy soils,RDA was conducted(Fig.7).The eigenvalues for axes 1 and 2 were 0.719 and 0.019,respectively,which together explained 73.8%of the total variance.The results indicate that light and butachlor as environment factors had positive correlations with OM,Chla,NP,DNP,and the abundances of functional genes.In contrast,strong negative correlations were found between light and the Shannon and Chao 1 indices of prokaryotes and eukaryotes(Table SII,see Supplementary Material for Table SII),suggesting that light reduces the richness and diversity of prokaryotes and eukaryotes.However,strong positive correlations were present between butachlor and the Shannon and Chao 1 indices of eukaryotes,suggesting that butachlor application increases the richness and diversity of eukaryotes.Additionally,light and butachlor had positive correlations with TNL and denitrification loss but had no positive correlations with NH3loss.
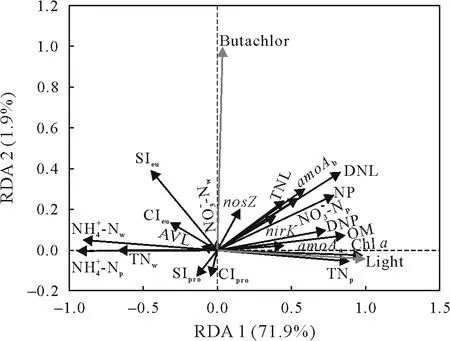
Fig.7 Redundancy analysis(RDA)results showing the correlations between light and butachlor application (grey lines) and periphytic biofilm properties(black lines)in the 21-d laboratory microcosm experiment.AVL=ammonia volatilization loss;TNL=total N loss;DNL=denitrification loss;NP=nitrification potential;DNP=denitrification potential;OM=organic matter;Chl a=chlorophyll a;TN=total N;nosZ=nitrous oxide reductase gene;amoA=ammonium monooxygenase gene;nirK=nitrite reductase gene;SI=Shannon index;CI=Chao 1 index.For the subscripts:w=overlying water;p=periphytic biofilm;pro=prokaryote;eu=eukaryote;a=archaea;b=bacteria.
The Spearman correlation heatmap analysis was used to investigate the relationships of periphytic biofilm properties and N loss with the relative abundances of dominant prokaryotic(Fig.S4,see Supplementary Material for Fig.S4)and eukaryotic classes(Fig.S5,see Supplementary Material for Fig.S5).Almost each of the microbial classes exhibited a certain degree of correlation with the periphytic biofilm properties.Compared to NH3volatilization,denitrification was more affected by microorganisms,and the microorganisms that affected denitrification also affected nitrification.The abundance of Trebouxiophyceae,a dominant green algal class,was significantly positively correlated with the pH,DO,OM,Chla,and TN of periphytic biofilms,as well as DNP,but was significantly negatively correlated with thecontents in overlying water and periphytic biofilms.The abundance of Cyanobacteria,a dominant prokaryotic class,was significantly positively correlated with NP,but significantly negatively correlated with theand TN contents in overlying water and thecontent in periphytic biofilms.
DISCUSSION
Periphytic biofilm development was observed in all paddy microcosms,with or without butachlor application.However,the growth of periphytic biofilms was considerably impeded by butachlor application.The Chlaand OM contents of periphytic biofilms are reported to be closely related to soil microbial biomass (Haoet al.,2008).Under dark condition,OM content increased slowly,and at the end of the experiment,the OM content was significantly lower in BD than in D(Fig.1).The biomass of Cyanobacteria,which was inferred based on Chla,was lower on day 7 but higher on days 14 and 21 in BL than in L.Hiseq sequencing revealed that the microbial structures in periphytic biofilms changed during the experiment and were different between the treatments with and without butachlor application(Fig.2).The application of butachlor resulted in Cyanobacteria becoming the dominant prokaryotic group,but inhibited the development of eukaryotic Trebouxiophyceae in the light treatments.Furthermore,butachlor application reduced the richness and diversity of prokaryotes but increased those of eukaryotes in the periphytic biofilms(Table SII).
For the first 14 d in BL,the growth of periphytic biofilm biomass (Fig.1) coincided with an increase in the TN of biofilms(Fig.4)and a decrease in the TN of overlying water(Fig.3).The growth of algae led to the rapid decreases incontent due to algae uptake(Fig.3)(Bermanet al.,1984;Axler and Reuter,1996).However,the application of butachlor inhibited the initial development of algae,resulting in elevatedlevels(Fig.4)(O’Callaghanet al.,2010).Additionally,the nitrification process can also be influenced by DO level,and the BL treatment exhibited a significantly higher NP due to the lower DO consumption by microbial respiration(Huanget al.,2011).
Nitrogen lossviaNH3volatilization during the initial few days was higher in the treatments without butachlor application than those with butachlor application for a same light condition,and the difference between L and BL was significant (Fig.5),attributable to the higherconcentrations in the water(Soareset al.,2012).However,NH3volatilization loss declined rapidly thereafter,despite the light treatments having a higher pH.These changes could be related toassimilation and nitrification by the periphytic biofilms in BL and L(Sheet al.,2018),resulting inconcentration reduction in the water.The Spearman correlation heatmap analysis revealed a low degree of direct correlation between the abundances of microbial communities and NH3volatilization loss,suggesting that microorganisms played a limited role in the process of NH3volatilization.
Butachlor affects lipid biosynthesis,in addition to various other metabolic processes and redox homeostasis(Agrawalet al.,2014).Xiaet al.(2011)reported that butachlor application stimulated urease activity at early exposure but inhibited with progressive exposure,and butachlor at all tested doses slightly stimulated the rate of nitrification.Our results showed that butachlor application increasedcontent,and the stimulatory effect of butachlor on nitrification led to the highercontents in periphytic biofilms.The NP values in the butachlor treatments were higher compared to the treatments without butachlor(Fig.6),which is consistent with previous studies(Xiaet al.,2011;Jianget al.,2014).Under light condition,algae photosynthesis increased oxygen level and penetration depth,which resulted in higher abundances of archaeal and bacterialamoAgenes in periphytic biofilms and promoted the conversion ofin the systems(Höfferleet al.,2010;Shenet al.,2013).In addition,Cyanobacteria and Trebouxiophyceae,the dominant classes under light condition(Fig.2),increased the nitrification and denitrification rates of biofilms by facilitating the conversion of.
Denitrification is related to the concentration ofin paddy fields(Ishiiet al.,2011;Liet al.,2014).A higher level ofat the soil-water interface under light condition results in a higher DNP in periphytic biofilms(Wanget al.,2013).In addition,the development of periphytic biofilms under light condition can release organic carbon that is utilized by denitrifying microorganisms(Kalscheuret al.,2012).Butachlor has been observed to directly increase the abundances ofnirKandnosZgenes,which affect nitrification andproduction rates,ultimately leading to an increase in denitrification activity(Zhanget al.,2016).
The highest TNL was observed in BL of all treatments(Table II).Butachlor application resulted in significantly higher TNL compared to the treatment without butachlor under the same light condition.In contrast,the dark treatment resulted in lower TNL compared to the light treatment under the same butachlor condition.The application of butachlor led to higher denitrification loss by producing highandconcentrations in the microcosms and increasing the abundances of NH3-oxidizing and denitrifying bacteria,which favored the nitrification and denitrification processes(Minet al.,2001).Denitrification was the major N loss process in the light treatments,whereas NH3volatilization was the major N loss process in the dark treatments,which may be attributed to the proliferation of photosynthetic autotrophic microorganisms,such as Cyanobacteria and Trebouxiophyceae,within the periphytic biofilms under light condition.The presence of these microorganisms promoted nitrification through photosynthetic oxygen production,thereby increasing denitrification loss (Xiaet al.,2018).However,dark condition inhibited the development of Cyanobacteria and Trebouxiophyceae within the periphytic biofilms,weakened the nitrification and biological assimilation of,and thereby increased theconcentration in overlying water,which resulted in higher NH3volatilization loss.
CONCLUSIONS
In this work,the effects of herbicide butachlor on periphytic biofilm growth and its subsequent effects on N cycling in paddy soils were investigated.The results showed that butachlor application retarded the development of periphytic biofilms.In the butachlor application treatments,Cyanobacteria were the dominant prokaryotes,and eukaryotic Trebouxiophyceae were inhibited.Furthermore,butachlor application increased the abundances of NH3-oxidizing and denitrifying bacteria,which in turn led to a substantial increase in TNL due to enhanced denitrification.The light condition promoted the development of periphytic biofilms and enhancedassimilation and nitrification,ultimately leading to a further increase in TNL through denitrification.Overall,butachlor application can have a significant impact on N lossviadenitrification in paddy systems,particularly in the presence of periphytic biofilms.Therefore,the role of butachlor in denitrification process should be considered in future nutrient management practices.
ACKNOWLEDGEMENT
This work was supported by the State Key Development Program for Basic Research of China(No.2015CB158200).
SUPPLEMENTARY MATERIAL
Supplementary material for this article can be found in the online version.
- Pedosphere的其它文章
- Developing the new soil science-Advice for early-career soil scientists
- Biophotoelectrochemistry:An emerging frontier for channeling photoelectric effect into darkness zone of soils and sediments
- Balancing machine learning and artificial intelligence in soil science with human perspective and experience
- Soils in extraterrestrial space:Need for studies under microgravity
- Role of biochar in raising blue carbon stock capacity of salt marshes
- Long-term fertilizer nitrogen management-Soil health conundrum

