
Effect of coral sand on the mechanical properties and hydration mechanism of magnesium potassium phosphate cement mortar
2024-02-05 01:05HaoLIUHuameiYANGHouzhenWEIJiningYUQingshanMENGRongtaoYAN
HaoLIU,HuameiYANG,HouzhenWEI,JiningYU,QingshanMENG,RongtaoYAN
Research Article
Effect of coral sand on the mechanical properties and hydration mechanism of magnesium potassium phosphate cement mortar

1College of Civil Engineering and Architecture, Guilin University of Technology, Guilin 541004, China2Guangxi Key Laboratory of Geomechanics and Geotechnical Engineering, Guilin University of Technology, Guilin 541004, China3State Key Laboratory of Geomechanics and Geotechnical Engineering, Institute of Rock and Soil Mechanics, Chinese Academy of Sciences, Wuhan 430071, China4School of Intelligent Construction, Wuchang University of Technology, Wuhan 430002, China5Hydraulic Concrete Institute, China Three Gorges Corporation, Beijing 100038, China6The First Railway Survey and Design Institute Group Corporation, Xi’an 710043, China
Damaged structures on coral islands have been spalling and cracking due to the dual corrosion of tides and waves. To ensure easy access to aggregate materials, magnesium potassium phosphate cement (MKPC) and coral sand (CS) are mixed to repair damaged structures on coral islands. However, CS is significantly different from land-sourced sand in mineral composition, particle morphology, and strength. This has a substantial impact on the hydration characteristics and macroscopic properties of MKPC mortar. Therefore, in this study we investigated the compressive strength, interfacial mechanical properties, and corrosion resistance of MKPC CS mortar. Changes in the morphology, microstructure, and relative contents of hydration products were revealed by scanning electron microscope-energy dispersive spectrometer (SEM-EDS) and X-ray diffraction (XRD). The results indicated that the compressive strength increased linearly with the interfacial micro-hardness, and then stabilized after long-term immersion in pure water and Na2SO4solution, showing excellent corrosion resistance. Compared with MKPC river sand (RS) mortar, the hydration products of CS mortar were an intermediate product 6KPO2·8H2O with a relative content of 3.9% at 1 h and 4.1% at 12 h. The hydration product MgKPO4·6H2O increased rapidly after 7-d curing, with an increased growth rate of 1100%. Our results showed that CS promoted the nucleation and formation of hydration products of MKPC, resulting in better crystallinity, tighter overlapping, and a denser interfacial transition zone. The results of this study provide technical support for applying MKPC mortar as a rapid repair material for damaged structures on coral islands.
Magnesium potassium phosphate cement (MKPC); Coral sand (CS); Mechanical properties; Corrosion resistance; Hydration mechanism
1 Introduction
Coral islands are distributed mainly in the tropical marine area between the north and south latitudes of 30°. This area has complex climatic conditions with high temperatures, humidity, and salinity all year round. Therefore, structures that have been in service for many years on coral islands suffer from large-scale cracking, spalling, corrosion, and collapse (Qin et al., 2021; Meng et al., 2022). The damaged structures need to be repaired to ensure construction safety. However, structures such as damaged breakwaters on coral islands are susceptible to tides and waves during the repair process, which puts extra demands on the setting time of the repairing materials. Magnesium potassium phosphate cement (MKPC) mortar is an environmentally friendly and rapid repair material, whose initial setting and hardening process can be completed within 10 min (Qiao et al., 2010; Qian and Yang, 2011; Xu et al., 2018a). Due to its high early compressive strength (7–45 MPa after 1 h) (Zhang et al., 2017), long durability (Chong et al., 2019; Li et al., 2019), and excellent bonding performance in damaged concrete structures (Xu et al., 2015; Li et al., 2017; Qin et al., 2018; Xie et al., 2020), MKPC mortar has been widely used for the rapid repair of damaged roads, bridges, and runways, and for the solidification of heavy metals (You et al., 2015). Therefore, MKPC mortar is a good choice for repairing damaged structures on coral islands in harsh aquatic environments.
MKPC features high crystallinity, which is commonly produced by a chemical reaction between dead burned magnesium oxide (MgO) powder, potassium dihydrogen phosphate (KH2PO4), retarder, and water (Viani et al., 2016; Xu et al., 2020; Peng et al., 2022). Its properties and microstructure are affected mainly by the mass ratio of MgO to KH2PO4(M/P), mass ratio of water to MKPC (w/b), and types and dosage of retarder. M/P is a primary factor in influencing the hydration process and properties of MKPC. With increasing M/P, the phase appearance of hydration products presents a development sequence of needle shapes, platelet shapes, prismatic shapes, and amorphous shapes (le Rouzic et al., 2017). In addition, as M/P increases, the total porosity first decreases and then increases (Ma et al., 2014; Hou et al., 2016), while the mechanical strength first increases and then decreases (Yang and Wu, 1999; Xu et al., 2018b). MKPC can set quickly, in tens of seconds, without retarders, which presents challenges in practical construction applications. Therefore, it is usually necessary to add retarders to prolong the setting time of MKPC. The main types of commonly used retarders are borax (Yang and Qian, 2010), aluminum nitrate (Cau Dit Coumes et al., 2021), rice husk ash (Liu et al., 2020), boric acid (Formosa et al., 2012; Lahalle et al., 2018), sodium acetate anhydrous (Dai et al., 2020), and sodium alginate (Yang et al., 2022). Among these, borax is widely used due to its high efficiency and low required dosage. Its retarding effect on MKPC can be attributed to hydration temperature reduction, solution pH control, and protective film generation. A very low borax content has little impact on setting time, but an excessive borax content has adverse effects on the later strength and durability of MKPC (Yang and Qian, 2010).
The fine aggregates used to prepare MKPC mortar comprise mainly river sand (RS) and quartz sand (Yang et al., 2000). Some researchers have also tried using limestone sand, granite, slag, magnesium sand, and aluminum sand (Ding and Li, 2005; Yang et al., 2017). Research shows that MKPC mortar formulated with these fine aggregates has excellent compressive strength. In addition, the rough surfaces of magnesium sand and aluminum sand can combine better with MKPC paste so that the fine aggregates bind more closely with hydration products and have higher compressive strength. However, the coral islands are far from the mainland, and terrigenous sand and gravel materials have to be transported over long distances from the continent. The transportation costs of building materials on a coral island in China are incredibly high and can account for up to 72% of the total construction project budget (Meng et al., 2021). Therefore, based on the premise that pristine reef environments will not be damaged, local coral sand (CS) is used as a fine aggregate for MKPC mortar to reduce transportation costs, which is of great engineering significance for repairing damaged structures on coral islands.
CS is a specific geotechnical material with a porosity of up to 50%. Its mineral composition is mainly aragonite and calcite (≥96%). Due to the preservation of the original biological skeletal structures during its formation, CS has porous structures and serrated surfaces with high water absorption capacity. On the one hand, the porous structure of CS gives it a brittle texture and lower strength (Wang et al., 2017; Wei et al., 2018, 2023), but on the other hand, the rough serrated surface of CS can make the interfacial transition zone between CS and cement more compact (Wang et al., 2016; Qin et al., 2021). In addition, the internal curing affected by the water absorption and release properties of CS causes significant changes in the microstructure and properties of the cement paste (Castro et al., 2011; Cheng et al., 2018).
Since CS differs significantly from land-sourced RS in mineral composition, particle morphology, and particle strength, it is bound to have a substantial impact on the hydration characteristics and macroscopic properties of MKPC mortar. However, there have been few studies on CS as a fine aggregate for MKPC mortar. In this study, we analyzed the primary factors affecting the compressive strength of MKPC CS mortar. The mechanical properties of the interface between CS and MKPC paste were studied by conducting micro-hardness tests. The changing patterns of mechanical properties of MKPC CS mortar after long-term exposure to water or corrosion solution were investigated. The morphological and microstructural characteristics of hydration product phases after different curing times were revealed by scanning electron microscope-energy dispersive spectrometer (SEM-EDS). In addition, the patterns of variation in the relative contents of the hydration product phases were quantified using X-ray diffraction (XRD).
2 Materials and methods
2.1 Materials and specimens
2.1.1Materials
The MKPC was composed of dead burned MgO powder, KH2PO4, retarder, and water. The dead burned MgO powder was formed through the industrial-scale magnesite calcination process (at >1500 ℃) at the Tinghu Refractory Factory located in Yancheng, China. The bulk density was 3.18 g/cm3and the average particle size was 74 μm. The percentages by weight of the main chemical components of dead burned MgO powder are shown in Table 1. KH2PO4with a purity of 98% and solution pH of 4.3–4.7 was provided by the Yingkou House Material Factory, China. The retarder was borax (Na2B4O7·10H2O) with a purity of 99.5%, provided by the Bodi Chemical Company, China.
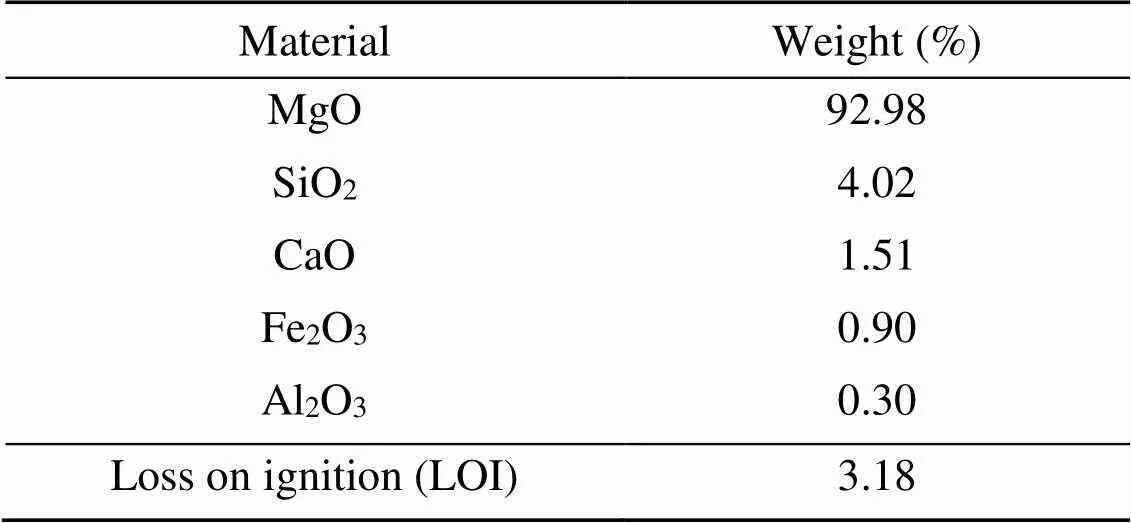
Table 1 Chemical compositions of dead burned MgO powder
The fine aggregate CS was taken from an island in the South China Sea, China. The particle-size range was 0.075–4.750 mm, and the fineness modulus was 2.70. The particle-size distribution of the RS was almost the same as that of the CS, and the fineness modulus was 2.58. The particle-size distributions of the CS and RS are shown in Fig. 1. The physical properties of fine aggregates were tested according to (AQSIQ, 2010), and the results are shown in Table 2.
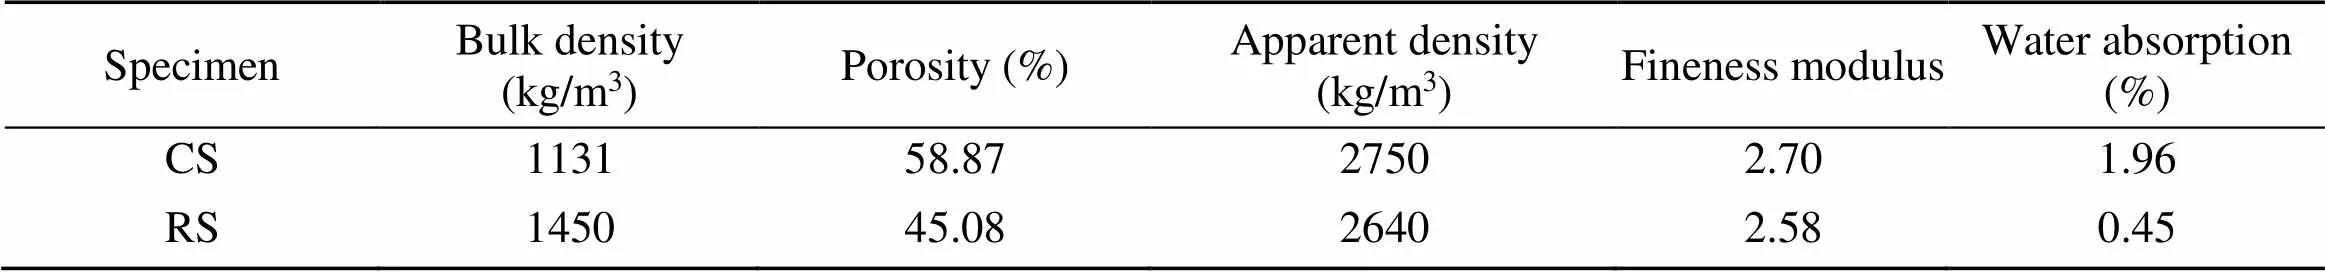
Table 2 Physical properties of fine aggregates

Table 3 Mix proportions of compressive strength tests
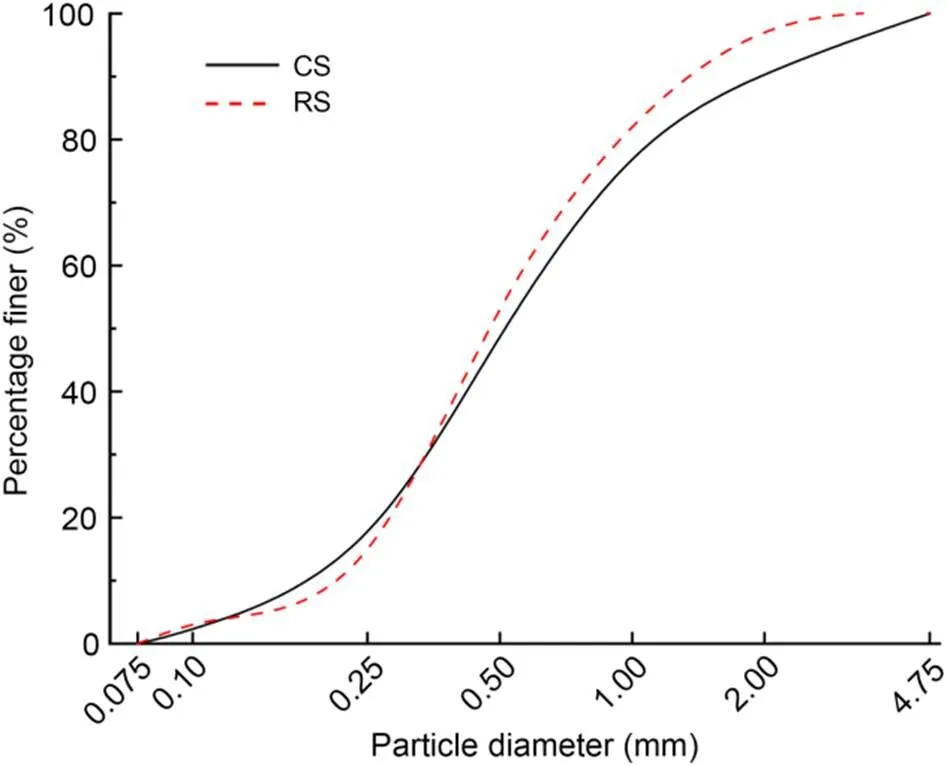
Fig. 1 Particle-size distributions of aggregates
2.1.2Mixture proportions
(1)Compressive strength test
The compressive strength of MKPC CS mortar was tested after 1-, 3-, and 7-d curing times. In addition, the influence of primary factors on compressive strength was analyzed. These factors included mainly: M/P, w/b, mass ratio of aggregates to MKPC (s/b), and mass ratio of borax to MgO (NB). The mix proportion design is shown in Table 3.
(2) Micro-hardness, corrosion resistance, and microscopic structure
The CS and RS were used as fine aggregates of MKPC mortar for testing mechanical properties, corrosion resistance, and microscopic structure. According to the compressive strength test, the optimum ratio of the main factors was chosen for the mechanical properties, corrosion resistance, and microscopic structure tests. The mix proportions of MKPC CS mortar and RS mortar are shown in Table 4.
2.1.3Specimen preparation
(1)Compressive strength and corrosion resistance tests
The dry aggregates and 20% of the total required water were poured slowly into a mixing pot for 1 min to pre-wet the aggregates, then the MgO, KH2PO4, and borax were slowly added. After gentle mixing for 2 min, the remaining water was poured slowly into the mixing pot for 2 min and then mixed vigorously for 2 min. The prepared mortar was loaded into a 40 mm×40 mm×40 mm cube mold in layers and vibrated on a shaking table for 1 min. The surface was scraped flat and demolded after 30 min at room temperature ((20±2) ℃). Three similar specimens were taken as one group and placed in a curing box at constant temperature ((20±2) ℃) and humidity (relative humidity of ≥95%).
(2)Micro-hardness
The MKPC CS and RS mortar specimens were cured for 1 h, 12 h, 7 d, or 28 d. After immersing in ethanol for 24 h, the samples were put into an oven at 40 ℃ and dried to a constant weight to stop hydration of the specimens. From each sample, a natural section containing a distinct interface area between the aggregate and the MKPC mortar was taken for testing. The selected specimens were wrapped with epoxy resin and cut into cylindrical samples with a diameter of 30 mm and a height of 20 mm. The surface of the sample was then polished sequentially with 600, 800, 1000, and 2000 grit sandpaper.
(3)SEM-EDS and XRD
The MKPC CS and RS mortar specimens were cured for 1 h, 12 h, 7 d, or 28 d. After immersing in ethanol for 24 h, the samples were put into a 40-℃ oven drying to constant weight to stop the hydration of specimens. Then SEM-EDS tests were conducted, and powders grounded to less than 75 μm were subjected to XRD tests.
2.2 Experimental procedure
2.2.1Compressive strength test
An INSTRON 3369 universal testing machine was used to test the compressive strength of the samples at a loading rate of 1 mm/min. The average compressive strength of three similar specimens was recorded as the test result. If, for any specimen, the difference between the maximum or minimum value and the average value in the test results was greater than 15%, the data were discarded, and the average value of the remaining specimens was taken as the test result.
The compressive strength growth rateindicated the development of the compressive strength of MKPC mortar. A larger value ofmeans faster development of compressive strength with increasing curing time. The equation used for calculatingis shown in Eq. (1).
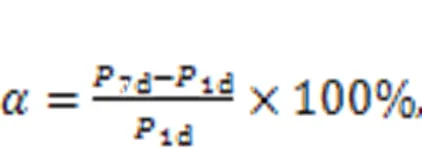
where1dand7ddenote the compressive strengths of the specimen at 1 d and 7 d, respectively, in MPa.
2.2.2Corrosion resistance test
A corrosion resistance test was conducted according to (MIIT, 2021). The specimens were placed in a curing box at constant temperature ((20±2) ℃) and humidity (relative humidity of ≥95%) for 12 h and then saturated in pure water at 20 ℃ for 7 d. After immersing the saturated specimens in pure water and Na2SO4solution with a mass fraction of 15% for 28 d, 56 d, or 90 d, the compressive strength was tested.
The corrosion resistance coefficientcharacterized the corrosion resistance of each specimen to sulfate solution. A large value ofindicates a strong resistance. The equation used for calculatingis shown in Eq. (2).

whereCdenotes the compressive strength of the specimen after immersing in 15% Na2SO4solution for the pre-designed curing time, andWdenotes the compressive strength of the sample after immersion in pure water for the pre-designed curing time.
2.2.3Microstructural characterization
(1)Micro-hardness test
A DHV-1000 digital display micro-Vickers hardness tester produced by the Suzhou Nanguang Electronic Technology Company, China was used for testing. The interface between fine aggregate and MKPC mortar was defined as point 0, and a series of points were struck every 20 μm in the direction of the mortar, three times at each position (each penetration point was at the same distance, but not in the same place). Schematic diagrams of the interfacial transition zone between aggregate and mortar are shown in the electronic supplementary materials (ESM). The test result is the average of the three micro-hardness values at the same location. If the difference between the maximum or minimum value and the average value in the test result was greater than 15%, the value was discarded, and the average of the remaining values was taken as the test result. The test load was 0.5 N, and the load retention time was 15 s.
(2)SEM-EDS
A Quanta 250 SEM produced by Thermo Fisher Scientific, USA, was used. A natural section of 10 mm×10 mm specimens was taken to analyze the characteristics of the hydration products in terms of phase morphology and microstructure at 5000× magnification by SEM. The elemental composition of the crystalline products was analyzed by a point sweep using the EDS energy spectrometer.
(3)XRD
A D8 Advance X-ray diffractometer manufactured by Bruker-AXS, Germany, with an operating voltage of 40 V, current of 40 mA, continuous scanning mode, scanning speed of 2 (°)/min, and scanning range of 5°–90° was used. The phase composition of hydration products after different curing times was analyzed, and the variation in the relative content of the contained phases was quantified by the adiabatic method.
The adiabatic method regards the sample as an isolated environment without adding a reference substance to the sample. Only the diffraction data of the phase contained in the sample were used to calculate the content of the phases. Since there was no amorphous phase in the MKPC system, and each phase had avalue, the conditions for using the adiabatic method were satisfied. If a sample containsphases and no amorphous phase, and a phaseis selected as the reference medium, the mass fractionwof phasecan be expressed by Eqs. (3) and (4).


All phases of the sample were first searched and matched. By comparing the pattern of diffraction peaks and PDF cards, the position of the strongest diffraction peak of each phase was determined. The 2value of the strongest diffraction peak of each phase is shown in Table 5. After deducting the background, the fit was performed on the strongest peak of each phase in the spectra. The fitting effect was judged by the magnitude of, with a smaller-value indicating a better fit. The definition ofis shown in Eq. (5).
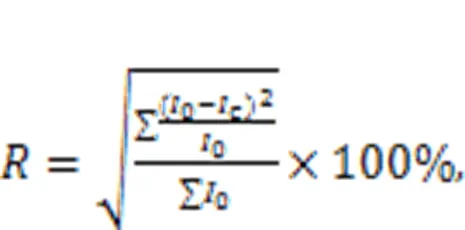
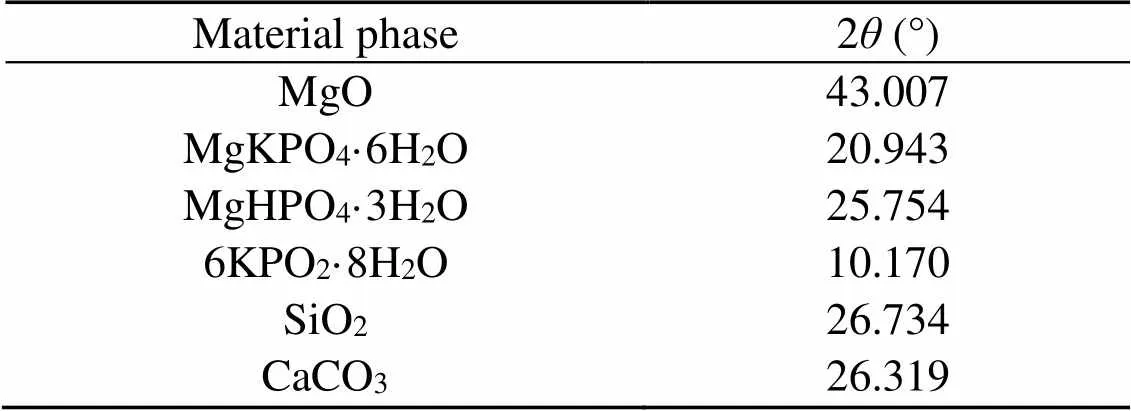
Table 5 Values of 2θ of the strongest diffraction peak of the material phases
3 Results and discussion
3.1 Mechanical properties
3.1.1Compressive strength
The effects of additional proportion on the compressive strength of MKPC CS mortar are shown in Fig. 2. The compressive strength of MKPC CS mortar increased with increasing curing time. The compressive strength at different curing times showed a trend of increasing and decreasing under different additional proportions of M/P, w/b, and NB, and gradually reduced with the addition of s/b content. The compressive strength performance was the best when M/P was 2.0, w/b was 0.18, s/b was 0.5, and NB was 0.09, reaching 34.8 MPa at 7 d.
The effects of additional proportions on the compressive strength growth rate of MKPC CS mortar are shown in Fig. 3. The growth rate of compressive strength tended to first increase and then decrease with increasing curing time (Fig. 3a). The growth rate of compressive strength peaked when the M/P ratio was 2.0, with a growth rate of 95.2%, and was the lowest when the M/P ratio was 1.5, with a growth rate of only 12.0%. Fig. 3b shows that the growth rate of compressive strength gradually decreased with increasing w/b. The growth rate of compressive strength reached a peak of 189.2% when w/b was 0.15, and fell to a low point of 23.5% when w/b was 0.30, indicating that a higher w/b was detrimental to the growth of compressive strength. Fig. 3c shows that the compressive strength grew at the fastest rate of 45.0% when s/b was 1.5, and at the slowest rate of 5.1% when s/b was 1.0. Fig. 3d shows that with increasing borax admixture, the growth rate of compressive strength first decreased and then increased. The growth rate was the fastest at 45.1% when NB was 0.03, and the lowest at 12.6% when NB was 0.05.
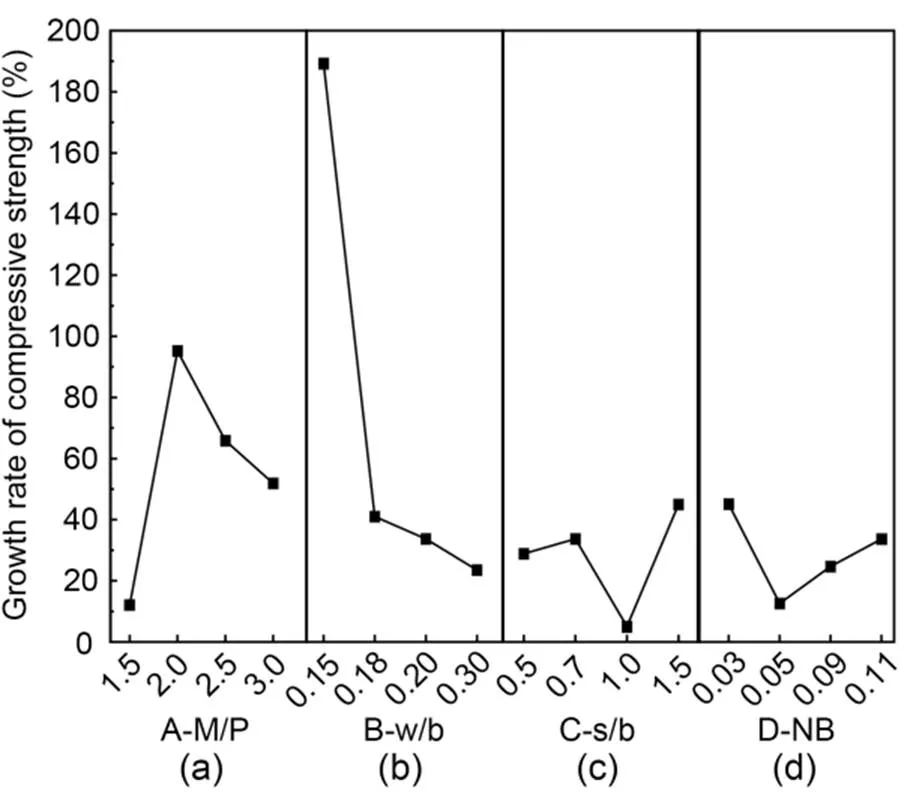
Fig. 3 Compressive strength growth rates of MKPC CS mortar: (a) A-M/P; (b) B-w/b; (c) C-s/b; (d) D-NB
Fig. 4 shows the compressive strengths of MKPC CS mortar and RS mortar at the optimal proportioning after curing for 1 h–90 d. The compressive strength of MKPC CS mortar rose with the period of curing, while that of MKPC RS mortar showed a reduction after 28 d. In general, the addition of borax prolongs the setting time of MKPC mortar from several to tens of minutes (Xu et al., 2020). However, excessive addition of borax will cause an endothermal effect in the MKPC paste, which decreases its early hydration rate. Thus, the strength and micro-morphology of hardened MKPC are affected (Qiao et al., 2009; Yang and Qian, 2010). The sudden drop in compressive strength for the sample of RS mortar was caused mainly by excessive addition of borax. The compressive strength of CS mortar remained stable after 3-d curing time when the w/b was 0.20, and increased rapidly during three times (by 32.5% at 2–6 h, 14.8% at 12 h–1 d, and 23.5% at 7–28 d) when the w/b was 0.18. Compared with RS mortar, MKPC CS mortar had higher compressive strength at 1 h–3 d. However, the growth rate of compressive strength at 3–28 d was less than that of RS mortar. We conclude that, compared with MKPC RS mortar, MKPC CS mortar had a stable late-stage compressive strength. In addition, the appropriate w/b dosage played a critical role in the increase of the compressive strength of MKPC CS mortar.
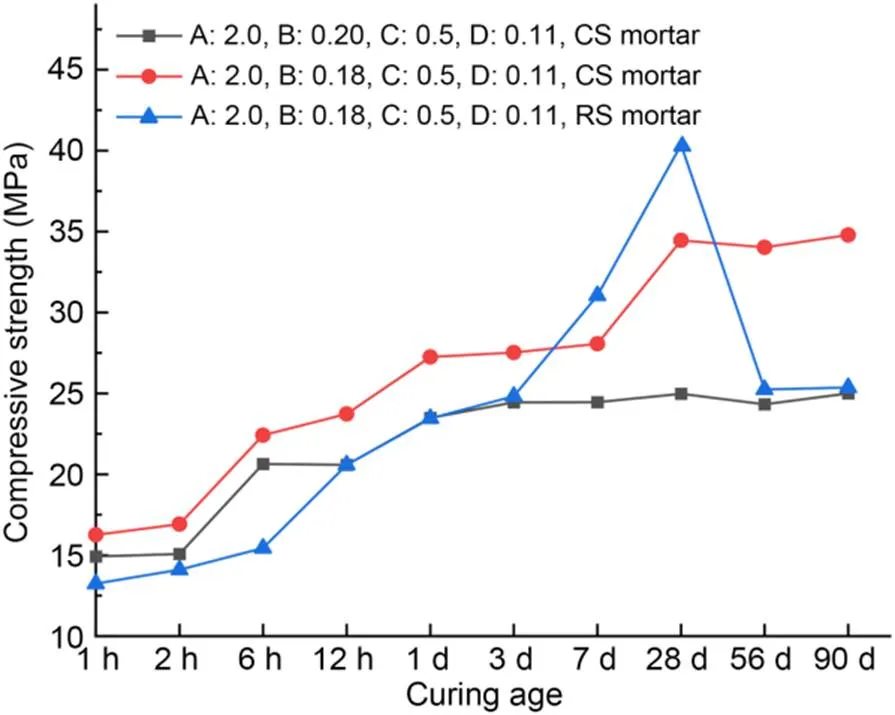
Fig. 4 Compressive strengths of optimal proportions of MKPC CS mortar and RS mortar
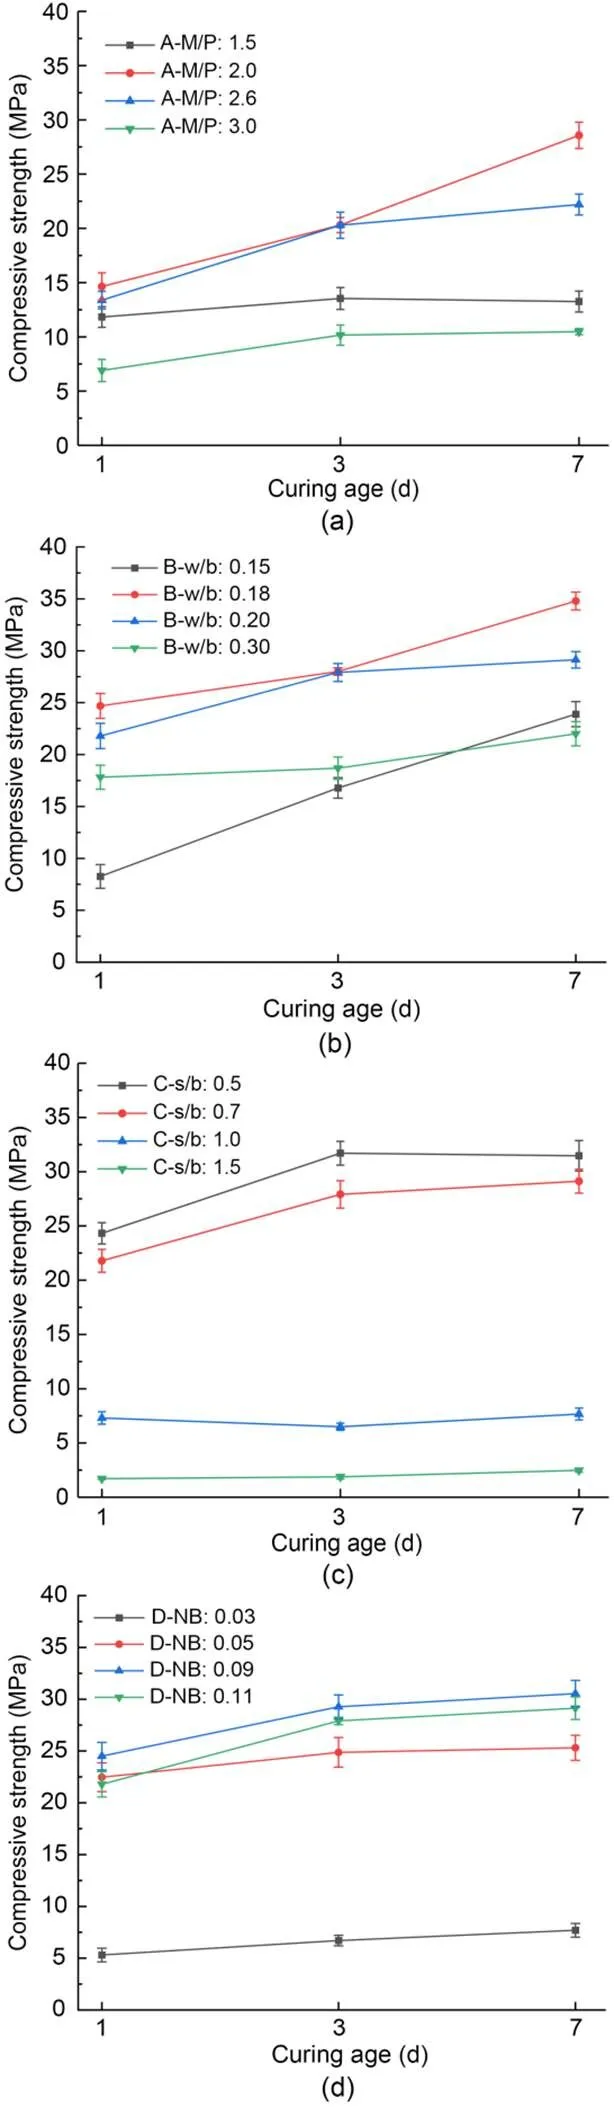
Fig. 2 Compressive strengths of MKPC CS mortar under different mix proportions: (a) A-M/P; (b) B-w/b; (c) C-s/b; (d) D-NB
3.1.2Micro-hardness of the interfacial transition zone
The interfacial micro-hardness values of MKPC CS mortar and RS mortar after 1-h, 12-h, 7-d, and 28-d curing times are shown in Figs. 5 and 6, respectively. The micro-hardness values in the 0–40 μm interfacial transition zone were lower than those in aggregates and MKPC mortar, indicating that the interfacial transition zone of the MKPC mortar had a weak interfacial micro-hardness in the range of 0–40 μm. This phenomenon is due to the wall effect and the micro-zone bleeding effect between the cement paste and fine aggregates (Scrivener et al., 2004).
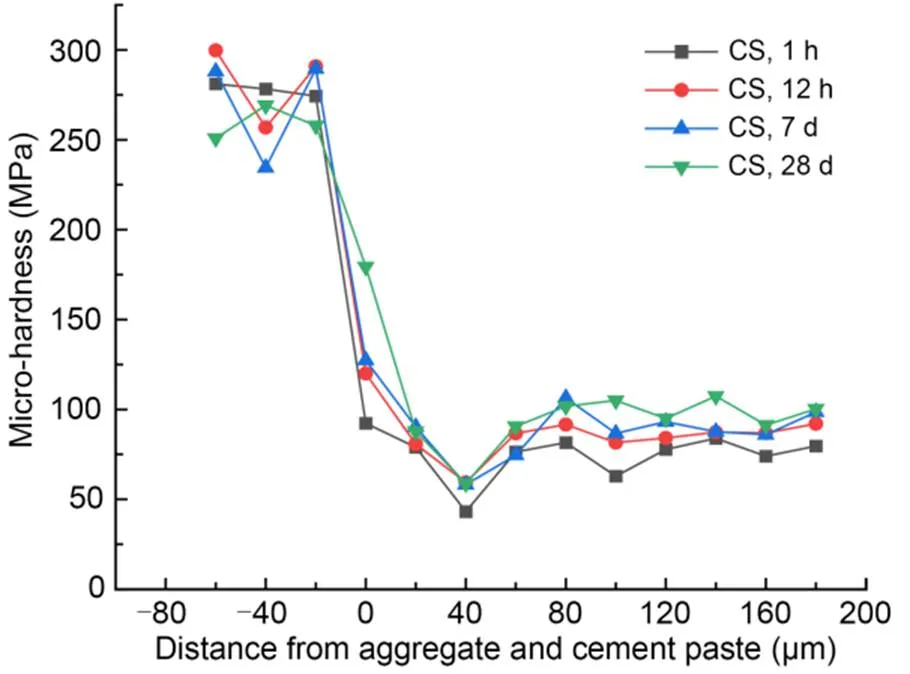
Fig. 5 Micro-hardness values in the interfacial transition zone of MKPC CS mortar
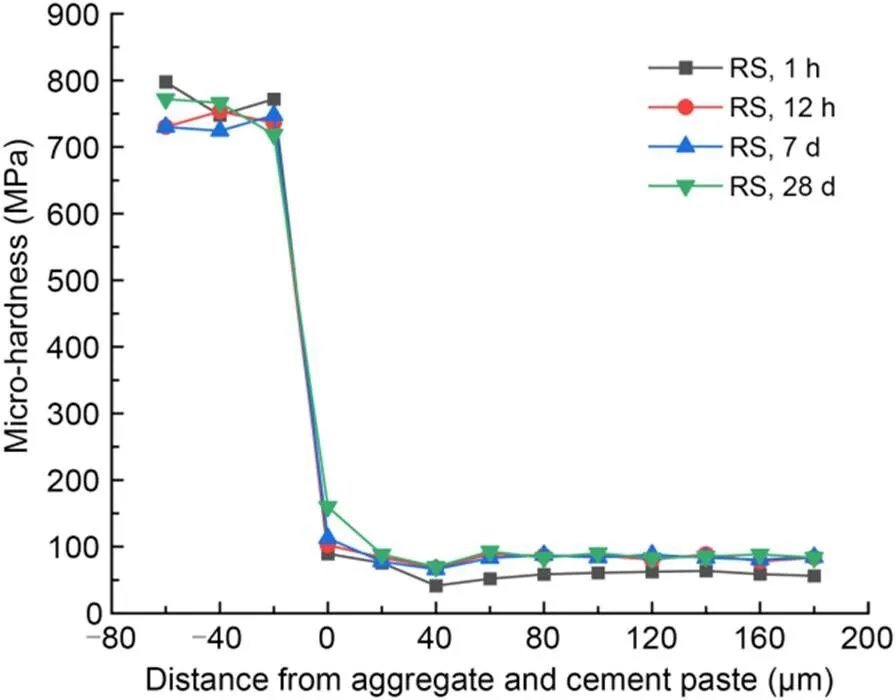
Fig. 6 Micro-hardness values in the interfacial transition zone of MKPC RS mortar
Micro-hardness values at the interface between fine aggregates and MKPC mortar (at 0 μm) increased with the curing period. In addition, the interfacial micro-hardness values (at 0 μm) of the CS mortar were higher than those of the RS mortar at the same curing time. The rough and porous surface of CS made it easier for the cement paste to fill the internal pores of the particles, which contributed to more compact microstructures. Therefore, the interfacial micro-hardness value was excellent, which in turn improves the mechanical properties of MKPC CS mortar (Wang et al., 2016; Qin et al., 2021; Zhang et al., 2021).
3.1.3Relationship between compressive strength and average micro-hardness

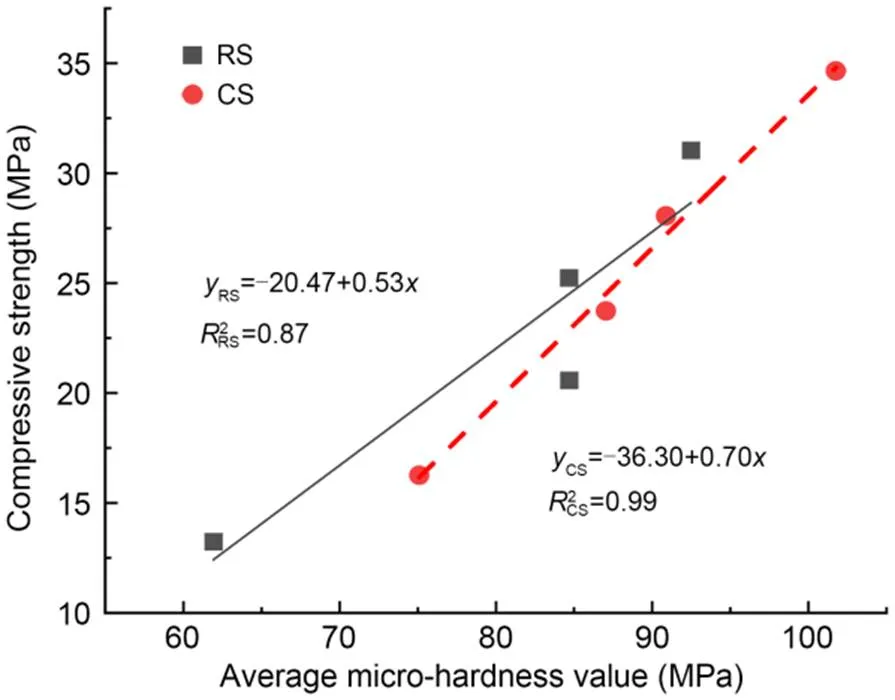
Fig. 7 Relationship between compressive strength and average micro-hardness value
3.2 Corrosion resistance
The compressive strengths of MKPC CS mortar and MKPC RS mortar immersed in different concentrations of Na2SO4solution are shown in Fig. 8, and the corrosion resistance coefficientsare shown in Table 6. The compressive strength of MKPC CS mortar and RS mortar first decreased and then increased with the curing time. Meanwhile, the compressive strength of MKPC CS mortar was significantly lower than that of RS mortar at all curing times. However, MKPC CS mortar had higher corrosion resistance coefficients. Long-term immersion in Na2SO4solution reduced the compressive strength of RS mortar by 16.7% at 28 d, 18.7% at 56 d, and 17.5% at 90 d, while that of CS mortar decreased slightly at 28 d, but increased by 12.5% at 56 d and 10.6% at 90 d.
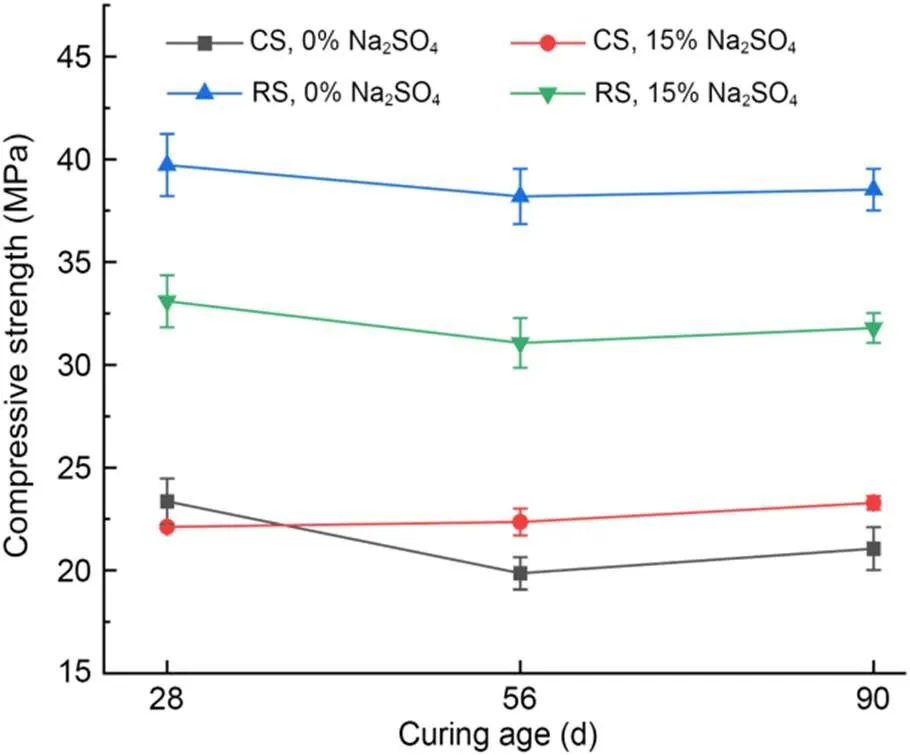
Fig. 8 Compressive strengths after immersion in the solution
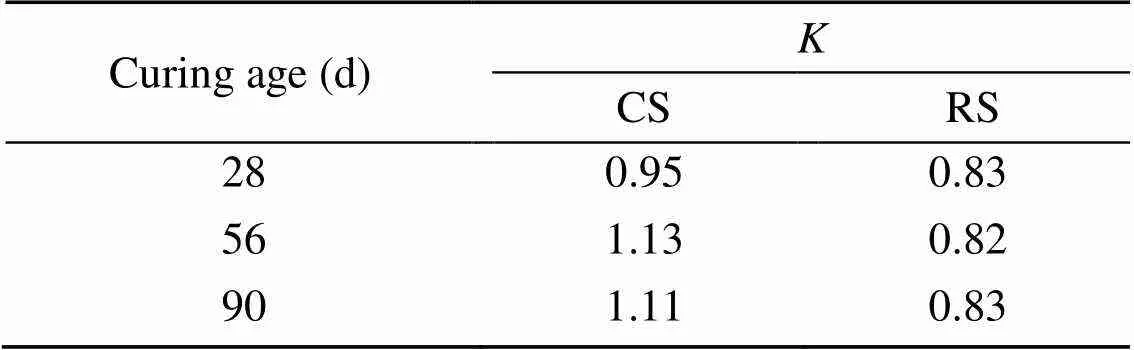
Table 6 Corrosion resistance coefficients of MKPC CS mortar and RS mortar
Although the compressive strength of MKPC CS mortar was lower than that of RS mortar, its corrosion resistance coefficients were higher. When the MKPC paste was immersed in the solution, the dissolution of unreacted anhydrous phosphate resulted in more open pores, which increased the effect of the corroding solution on the compressive strength of the specimens (le Rouzic et al., 2017). The addition of CS delayed the dissolution of KH2PO4in the MKPC system. On the one hand, the phosphate not yet involved in the reaction led to more open pores in the specimens, making the compressive strength of CS mortar immersed in the corrosion solution lower than that of RS mortar. On the other hand, the reaction rate of MKPC was reduced, and the crystallization of the hydration hardening products had better performance, making MKPC CS mortar more resistant to corrosion by sulfate solution.
3.3 Hydration product phase
3.3.1XRD analysis

MgO+KH
2
PO
4
+5H
2
O→MgKPO
4
·6H
2
O. (6)
The crystallization products and states of MKPC CS mortar and RS mortar at different hydration periods were analyzed from the XRD patterns (Fig. 9). The main crystallization products of the MKPC RS mortar XRD patterns were MgKPO4·6H2O and MgHPO4·3H2O (Fig. 9a). In contrast, for CS mortar diffraction peaks of 6KPO2·8H2O were detected at 1 h and 12 h, in addition to the diffraction peaks of MgKPO4·6H2O and MgHPO4·3H2O. Moreover, the diffraction peaks of MgHPO4·3H2O were not detected at 1 h.
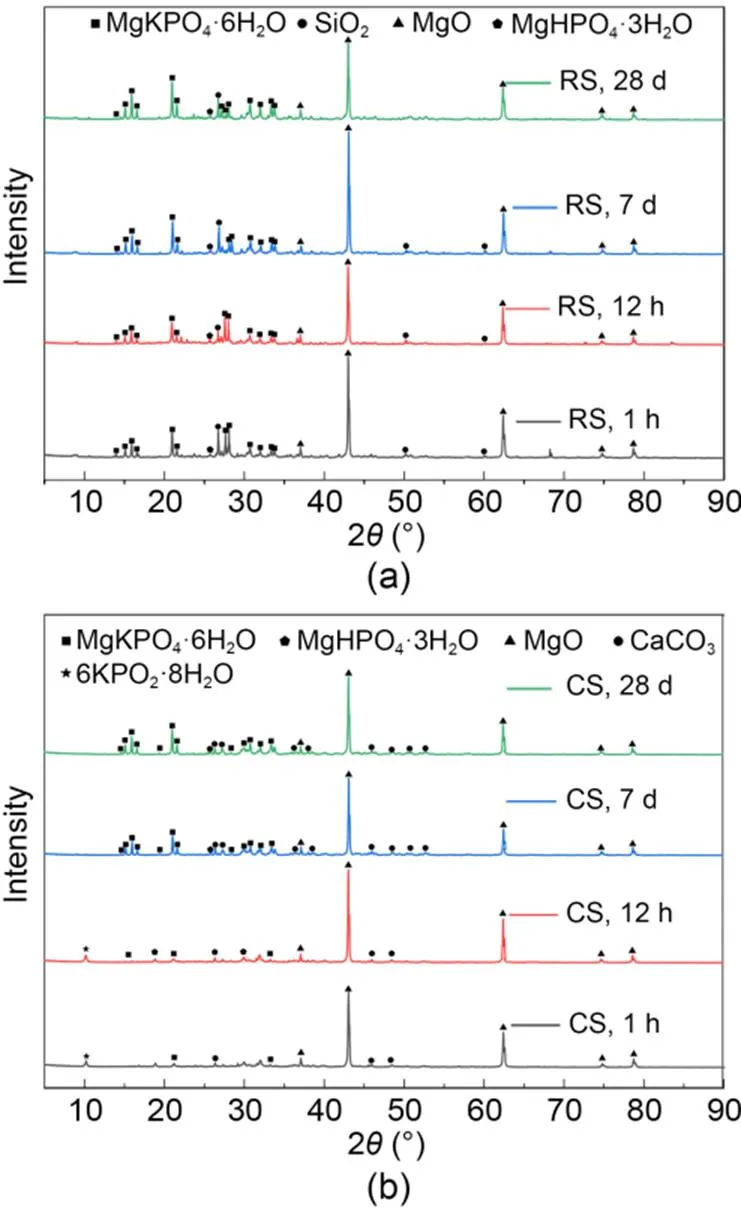
Fig. 9 XRD patterns for MKPC mortars: (a) RS mortar; (b) CS mortar
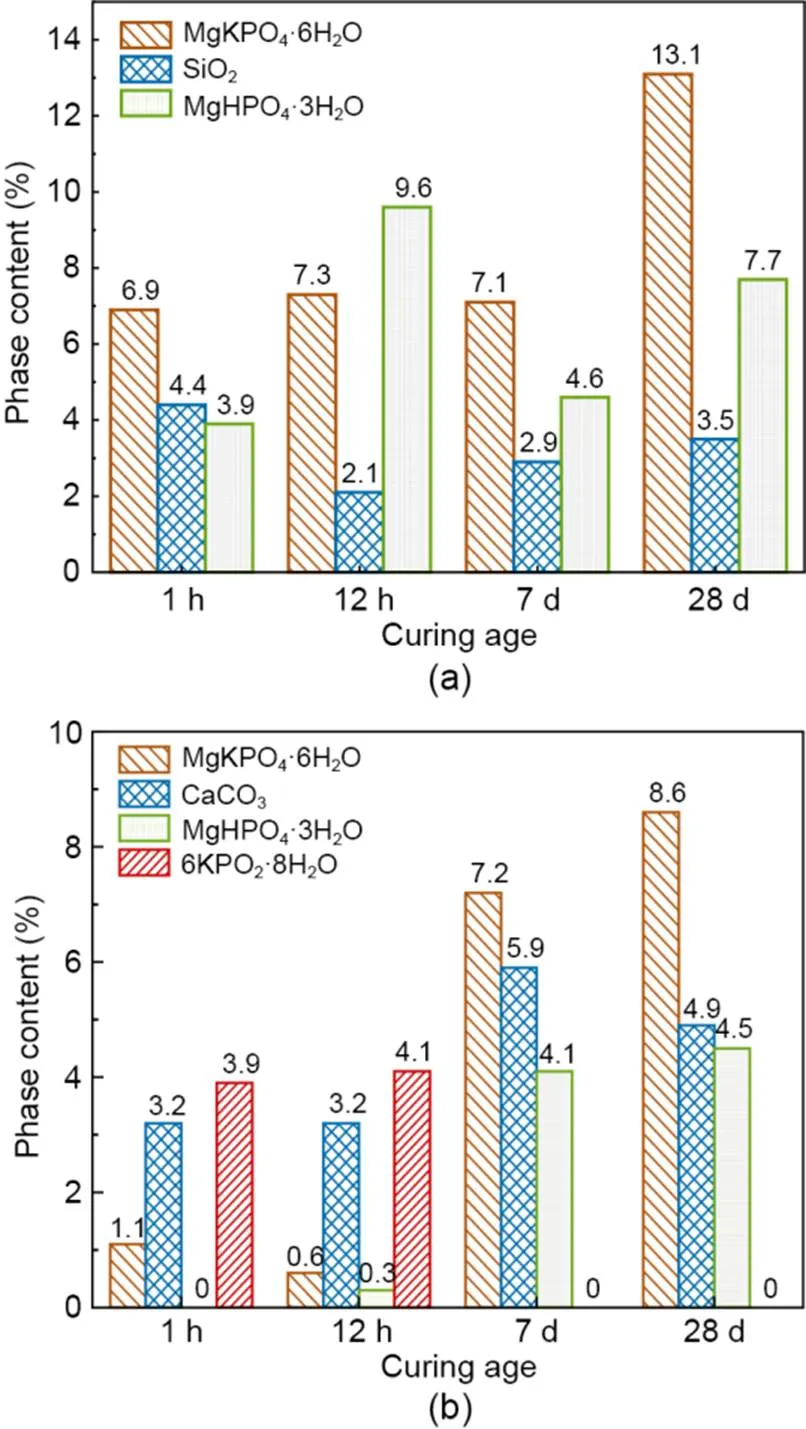
Fig. 10 XRD quantitative analysis of phase content for MKPC mortars: (a) RS mortar; (b) CS mortar
The relative contents of hydration product phases of MKPC CS mortar and RS mortar at different hydration periods are shown in Fig. 10. With the increasing curing time, the MgKPO4·6H2O content gradually increased. The fastest growth rates were 1100% at 7 d for CS mortar and 84.5% at 28 d for RS mortar. Fig. 10a shows that the 6KPO2·8H2O phase did not exist in RS mortar. Moreover, the content of the hydration hardening product MgKPO4·6H2O reached 6.9% at 1 h and 7.3% at 12 h. In addition, the relative content of the intermediate hydration product MgHPO4·3H2O was up to 9.6% at 12 h. Fig. 10b shows that the relative content of 6KPO2·8H2O in the CS mortar was 3.9% at 1 h and 4.1% at 12 h. Furthermore, the relative content of the hydration hardening product MgKPO4·6H2O was only 1.1% at 1 h and 0.6% at 12 h, and the relative content of the intermediate hydration product MgHPO4·3H2O was only 0.3% at 12 h. The relative contents of CS mortar and RS mortar phases demonstrated that the MKPC mortar with CS as fine aggregate generated 6KPO2·8H2O at 1 h and 12 h. In addition, the formation rates of the intermediate hydration product MgHPO4·3H2O and hydration hardening product MgKPO4·6H2O were delayed, which reduced the hydration rate.
3.3.2SEM-EDS analysis
The SEM photographs and EDS spectra of MKPC mortar after 1 h and 28 d are shown in Figs. 11 and 12. SEM photographs of MKPC mortar after 12 h and 7 d are shown in the ESM. The main product of MKPC mortar was prismatic MgKPO4·6H2O. With the growth of hydration time, the generation of MgKPO4·6H2O crystals increased and they overlapped each other to form a dense network structure. The network structure of CS mortar (Fig. 11) was more compact than that of RS mortar (Fig. 12) due to the rough surface of the CS promoting mutual overlap between the MgKPO4·6H2O crystals.
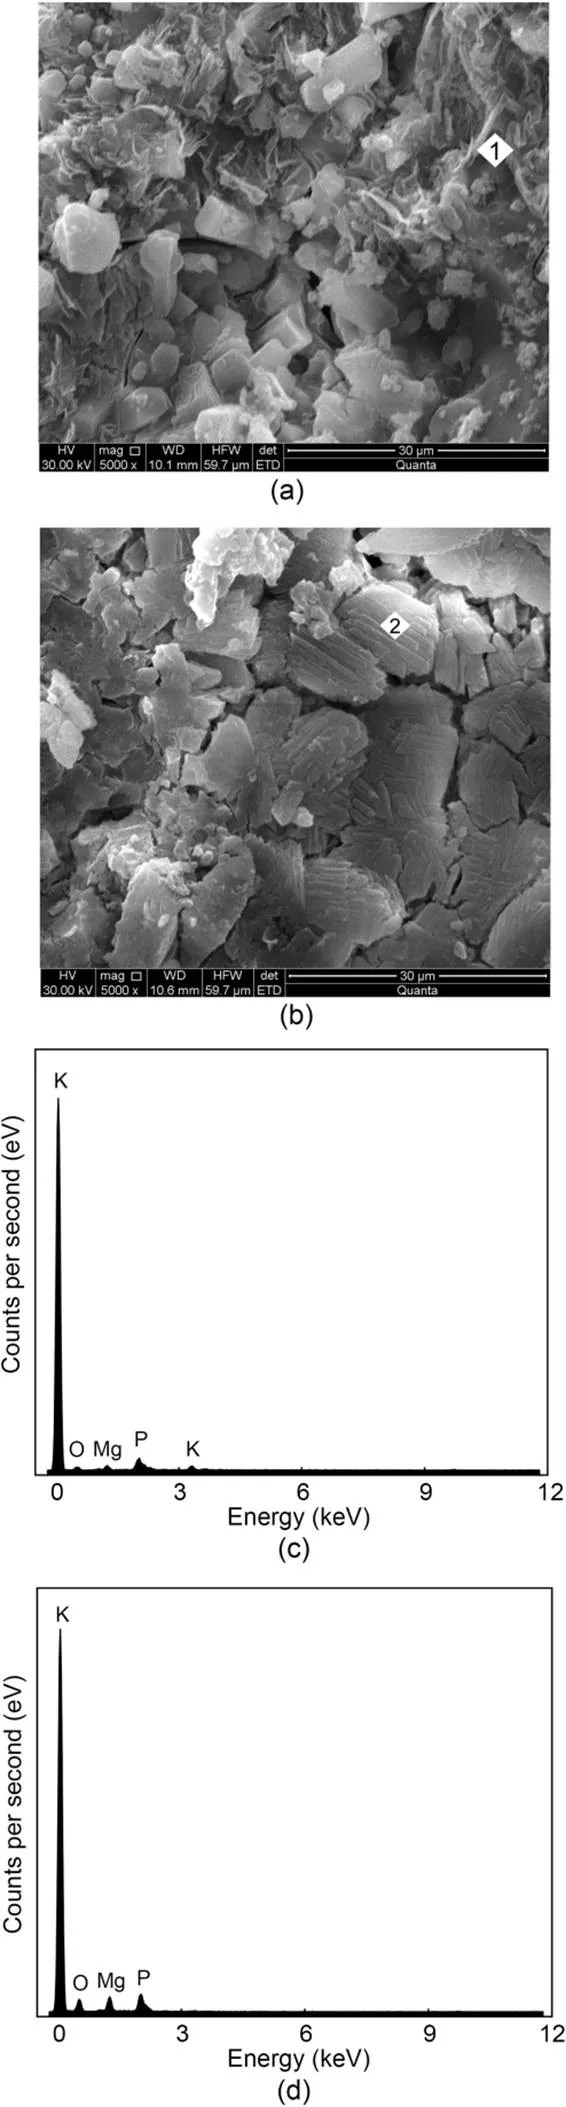
Fig. 11 SEM photographs (5000×) of MKPC CS mortar after 1-h (a) and 28-d (b) curing times; EDS energy spectra of MKPC CS mortar after 1-h (c) and 28-d (d) curing times
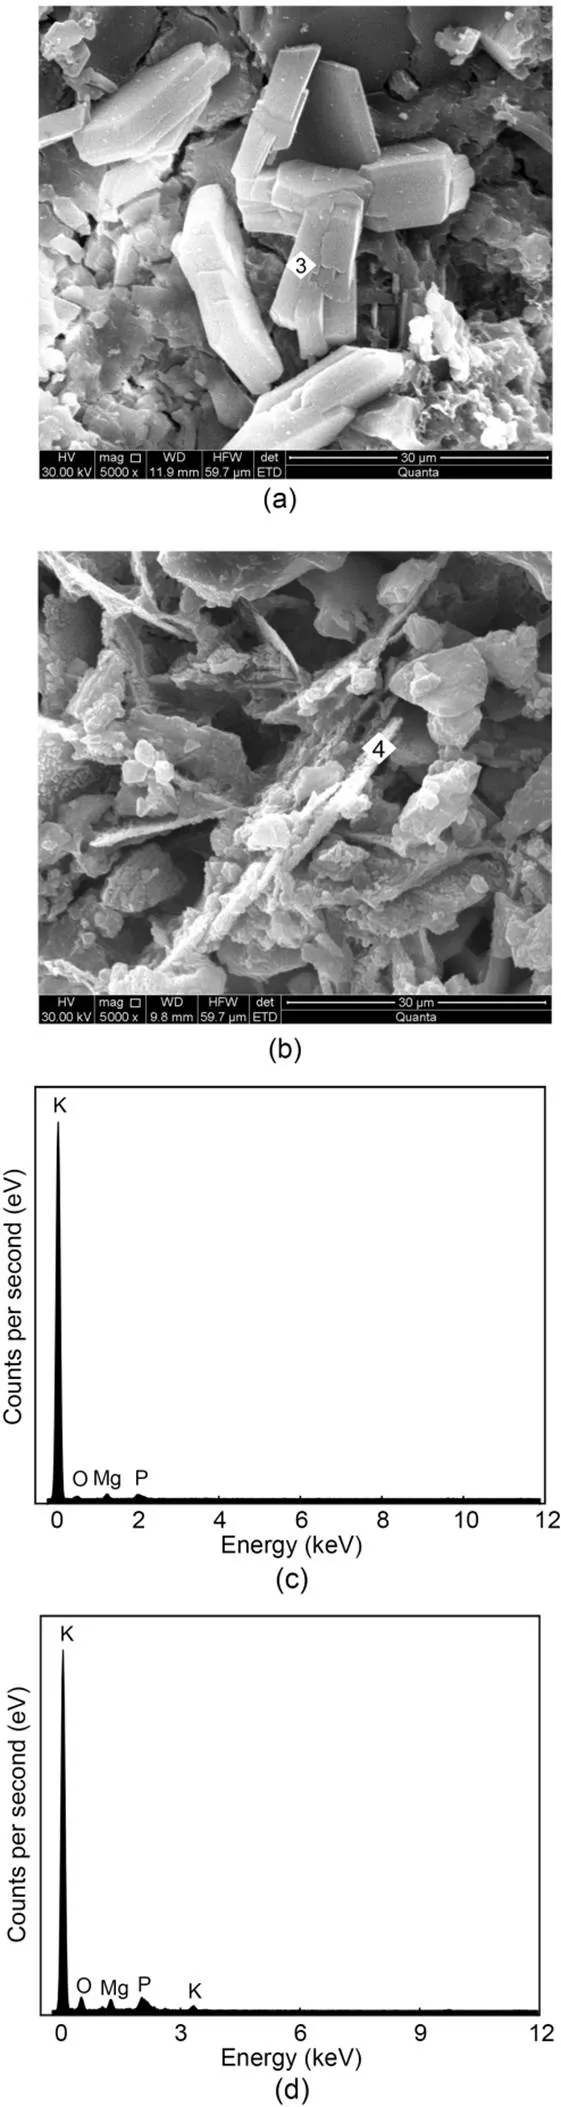
Fig. 12 SEM photographs (5000×) of MKPC RS mortar after 1-h (a) and 28-d (b) curing times; EDS energy spectra of MKPC RS mortar after 1-h (c) and 28-d (d) curing times
The results of EDS analysis of the hydration products of MKPC mortar at 1 h and 28 d are shown in Table 7. The Mg, K, P, and O atomic ratios of MKPC CS mortar were 1׃0.29׃1.12׃4.14 at 1 h and 1׃0.24׃1.54׃2.78 at 28 d, respectively, while those of MKPC RS mortar were 1׃0.35׃0.23׃1.43 at 1 h and 1׃0.85׃0.99׃6.44 at 28 d, respectively. The results indicated that the prismatic products were MgKPO4·6H2O.
3.4 Effect of CS on mechanical properties and hydration behavior of MKPC
The water absorption and release properties of CS aggregate significantly influenced the hydration behavior of MKPC paste. The water absorption characteristic of CS reduced the reaction water in the system. This accelerated KH2PO4to saturation, promoting generation of the intermediate hydration product 6KPO2·8H2O at 1 h and 12 h and postponing the formation of the hydration product MgKPO4·6H2O of MKPC CS mortar. With the water released from CS, the intermediate hydration product 6KPO2·8H2O gradually dissolved and participated in the subsequent hydration reaction, followed by the gradual generation of more MgKPO4·6H2O. Therefore, the addition of CS ensured that the hydration product MgKPO4·6H2O of MKPC mortar had enough time for crystallization to nucleate and generate, giving the interfacial transition zone of the cement paste a more compact structure and improving crystal development.
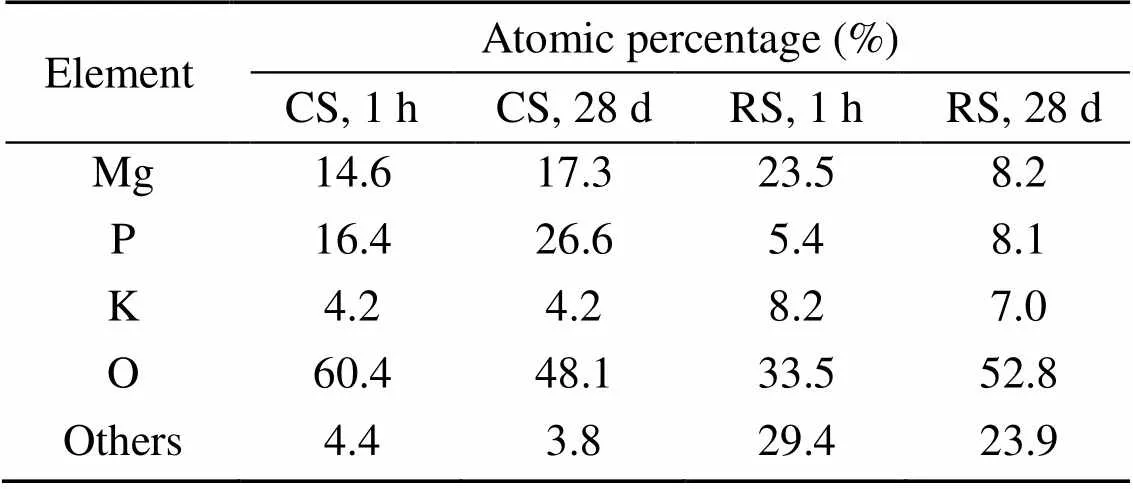
Table 7 Atomic percentages of selected elements in EDS
There was a significant correlation between the micro-hardness and compressive strength of the MKPC CS mortar. In addition, the CS retarded the hydration process of the MKPC system, which made the hydration products overlap more closely, thereby increasing the micro-hardness, which improved the mechanical properties and corrosion resistance of MKPC CS mortar.
4 Conclusions
In this study, we investigated the mechanical properties and corrosion resistance of MKPC-based CS mortar and RS mortar, to provide a theoretical basis and technical support for prolonging the service life of damaged structures on coral islands. The factors affecting compressive strength were analyzed. The effects of CS on the phase morphology of hydration products and the variation in their relative content were revealed. Based on the experimental results, the main conclusions are as follows:
1. With increasing M/P, w/b, and NB content, the compressive strength of MKPC CS mortar at different curing times first increased and then decreased. The compressive strength gradually reduced with the addition of s/b content. The compressive strength performance was the best when M/P was 2.0, w/b was 0.18, s/b was 0.5, and NB was 0.09, reaching 34.8 MPa at 7 d. The results demonstrated that the mechanical properties of MKPC CS mortar were much better than those of MKPC RS mortar.
2. The interfacial micro-hardness of the CS mortar and MKPC was higher than that of RS mortar and MKPC. The average micro-hardness of the interfacial transition zone showed an apparent linear relationship with the compressive strength. This suggests that the rough and porous surface of CS may contribute to the filling of MKPC between the internal pores of particles, resulting in higher micro-hardness of MKPC CS mortar than that of MKPC RS mortar.
3. The compressive strength of MKPC CS mortar remained stable after long-term immersion in water and Na2SO4solution. In addition, after long-term immersion in Na2SO4solution, the compressive strength increased by 12.5% after 56 d and 10.6% after 90 d. Compared with RS, CS promoted better resistance of MKPC mortar to sulfate solution.
4. At 1 h and 12 h, the MKPC CS mortar generated the intermediate hydration product 6KPO2·8H2O, and the hydration products MgHPO4·3H2O and MgKPO4·6H2O were developed at low levels. At 7 d, 6KPO2·8H2O was dissolved, and the relative content of the hydration product MgKPO4·6H2O increased by 1100%. The results indicate that CS postponed the hydration of MgKPO4·6H2O before 12 h. Subsequently, the formation of MgKPO4·6H2O was accelerated. In addition, CS gave the hydration product of MKPC mortar a more compact and overlapping structure and more regular morphology.
This work is supported by the Key Technologies R&D Program of Guangxi Zhuang Autonomous Region (No. GUIKE AB22080073) and the Open Research Program of State Key Laboratory of Geomechanics and Geotechnical Engineering (No. SKLGME021026), China.
Hao LIU designed the research. Hao LIU and Huamei YANG processed the data. Hao LIU and Houzhen WEI wrote the first draft of the manuscript. Jining YU and Rongtao YAN helped to organize the manuscript. Qingshan MENG and Houzhen WEI revised and edited the final version.
Hao LIU, Huamei YANG, Houzhen WEI, Jining YU, Qingshan MENG, and Rongtao YAN declare that they have no conflict of interest.
AQSIQ (General Administration of Quality Supervision, Inspection and Quarantine of the People’s Republic of China), 2010. Lightweight Aggregates and Its Test Methods Part 2: Test Methods for Lightweight Aggregates, GB/T 17431.2-2010. National Standards of the People’s Republic of China (in Chinese).
Castro J, Keiser L, Golias M, et al., 2011. Absorption and desorption properties of fine lightweight aggregate for application to internally cured concrete mixtures., 33(10):1001-1008. https://doi.org/10.1016/j.cemconcomp.2011.07.006
Cau Dit Coumes C, Rousselet A, Xu BW, et al., 2021. Investigation of aluminum nitrate as a set retarder of magnesium potassium phosphate cement: mechanisms involved in diluted suspension., 150:106608. https://doi.org/10.1016/j.cemconres.2021.106608
Cheng SK, Shui ZH, Sun T, et al., 2018. Durability and microstructure of coral sand concrete incorporating supplementary cementitious materials., 171:44-53. https://doi.org/10.1016/j.conbuildmat.2018.03.082
Chong LL, Yang JM, Xu ZZ, et al., 2019. Freezing and thawing resistance of MKPC paste under different corrosion solutions., 212:663-674. https://doi.org/10.1016/j.conbuildmat.2019.03.269
Dai J, Qian CX, Chen J, et al., 2020. Effect of sodium acetate anhydrous on hydration and microstructure of potassium magnesium phosphate cement., 34(3):6066-6074 (in Chinese). https://doi.org/10.11896/cldb.19030122
Ding Z, Li ZJ, 2005. Effect of aggregates and water contents on the properties of magnesium phospho-silicate cement., 27(1):11-18. https://doi.org/10.1016/j.cemconcomp.2004.03.003
Formosa J, Chimenos JM, Lacasta AM, et al., 2012. Interaction between low-grade magnesium oxide and boric acid in chemically bonded phosphate ceramics formulation., 38(3):2483-2493. https://doi.org/10.1016/j.ceramint.2011.11.017
Graeser S, Postl W, Bojar HP, et al., 2008. Struvite-(K), KMgPO4·6H2O, the potassium equivalent of struvite–a new mineral., 20(4):629- 633. https://doi.org/10.1127/0935-1221/2008/0020-1810
Hou DS, Yan HD, Zhang JR, et al., 2016. Experimental and computational investigation of magnesium phosphate cement mortar., 112:331-342. https://doi.org/10.1016/j.conbuildmat.2016.02.200
Lahalle H, Cau Dit Coumes C, Mercier C, et al., 2018. Influence of the w/c ratio on the hydration process of a magnesium phosphate cement and on its retardation by boric acid., 109:159-174. https://doi.org/10.1016/j.cemconres.2018.04.010
Le Rouzic M, Chaussadent T, Stefan L, et al., 2017. On the influence of Mg/P ratio on the properties and durability of magnesium potassium phosphate cement pastes., 96:27-41. https://doi.org/10.1016/j.cemconres.2017.02.033
Li Y, Bai WL, Shi TF, 2017. A study of the bonding performance of magnesium phosphate cement on mortar and concrete., 142:459-468. https://doi.org/10.1016/j.conbuildmat.2017.03.090
Li Y, Shi TF, Li YQ, et al., 2019. Damage of magnesium potassium phosphate cement under dry and wet cycles and sulfate attack., 210:111-117. https://doi.org/10.1016/j.conbuildmat.2019.03.213
Liu RQ, Pang B, Zhao XK, et al., 2020. Effect of rice husk ash on early hydration behavior of magnesium phosphate cement., 263:120180. https://doi.org/10.1016/j.conbuildmat.2020.120180
Ma HY, Xu BW, Li ZJ, 2014. Magnesium potassium phosphate cement paste: degree of reaction, porosity and pore structure., 65:96-104. https://doi.org/10.1016/j.cemconres.2014.07.012
Meng QS, Wu WJ, Yang HM, et al., 2021. Damage Mechanism and Durability Evaluation of Coral Reef Sand Concrete Structures. Science Press, Beijing, China (in Chinese).
Meng QS, Qin QL, Yang HM, et al., 2022. Effects of high-low temperature cycles on the performance of coral aggregate concrete based on field specimens and laboratory accelerated tests., 325:126596. https://doi.org/10.1016/j.conbuildmat.2022.126596
MIIT (Ministry of Industry and Information Technology), 2021. Environmental Corrosion-Resistance Admixtures for Concrete, JC/T 1011-2021. National Standards of the People’s Republic of China (in Chinese).
Peng YX, Tang SW, Huang JS, et al., 2022. Fractal analysis on pore structure and modeling of hydration of magnesium phosphate cement paste., 6(6):337. https://doi.org/10.3390/fractalfract6060337
Qian CX, Yang JM, 2011. Effect of disodium hydrogen phosphate on hydration and hardening of magnesium potassium phosphate cement., 23(10):1405-1411. https://doi.org/10.1061/(asce)mt.1943-5533.0000305
Qiao F, Chau CK, Li Z, 2009. Setting and strength development of magnesium phosphate cement paste., 21(4):175-180. https://doi.org/10.1680/adcr.9.00003
Qiao F, Chau CK, Li ZJ, 2010. Property evaluation of magnesium phosphate cement mortar as patch repair material., 24(5):695-700. https://doi.org/10.1016/j.conbuildmat.2009.10.039
Qin JH, Qian JS, You C, et al., 2018. Bond behavior and interfacial micro-characteristics of magnesium phosphate cement onto old concrete substrate., 167:166-176. https://doi.org/10.1016/j.conbuildmat.2018.02.018
Qin QL, Meng QS, Yang HM, et al., 2021. Study of the anti-abrasion performance and mechanism of coral reef sand concrete., 291:123263. https://doi.org/10.1016/j.conbuildmat.2021.123263
Scrivener KL, Crumbie AK, Laugesen P, 2004. The interfacial transition zone (ITZ) between cement paste and aggregate in concrete., 12(4):411-421. https://doi.org/10.1023/B:INTS.0000042339.92990.4c
Viani A, Peréz-Estébanez M, Pollastri S, et al., 2016. In situ synchrotron powder diffraction study of the setting reaction kinetics of magnesium-potassium phosphate cements., 79:344-352. https://doi.org/10.1016/j.cemconres.2015.10.007
Wagh AS, Jeong SY, 2003. Chemically bonded phosphate ceramics: I, a dissolution model of formation., 86(11):1838-1844. https://doi.org/10.1111/j.1151-2916.2003.tb03569.x
Wang QK, Li P, Tian YP, et al., 2016. Mechanical properties and microstructure of portland cement concrete prepared with coral reef sand., 31(5):996-1001. https://doi.org/10.1007/s11595-016-1481-x
Wang XZ, Wang X, Jin ZC, et al., 2017. Shear characteristics of calcareous gravelly soil., 76(2):561-573. https://doi.org/10.1007/s10064-016-0978-z
Wei HZ, Zhao T, He JQ, et al., 2018. Evolution of particle breakage for calcareous sands during ring shear tests., 18(2):195-256. https://doi.org/10.1061/(asce)gm.1943-5622.0001073
Wei HZ, Liu H, Li XX, et al., 2023. Effect of stress path on the mechanical properties of calcareous sand., 9:20-30. https://doi.org/10.1016/j.undsp.2022.06.003
Xie YD, Lin XJ, Li HF, et al., 2020. Effect of polyvinyl alcohol powder on the bonding mechanism of a new magnesium phosphate cement mortar., 239:117871. https://doi.org/10.1016/j.conbuildmat.2019.117871
Xu BW, Ma HY, Li ZJ, 2015. Influence of magnesia-to-phosphate molar ratio on microstructures, mechanical properties and thermal conductivity of magnesium potassium phosphate cement paste with large water-to-solid ratio., 68:1-9. https://doi.org/10.1016/j.cemconres.2014.10.019
Xu BW, Lothenbach B, Ma HY, 2018a. Properties of fly ash blended magnesium potassium phosphate mortars: effect of the ratio between fly ash and magnesia., 90:169-177. https://doi.org/10.1016/j.cemconcomp.2018.04.002
Xu BW, Lothenbach B, Leemann A, et al., 2018b. Reaction mechanism of magnesium potassium phosphate cement with high magnesium-to-phosphate ratio., 108:140-151. https://doi.org/10.1016/j.cemconres.2018.03.013
Xu BW, Lothenbach B, Winnefeld F, 2020. Influence of wollastonite on hydration and properties of magnesium potassium phosphate cements., 131:106012. https://doi.org/10.1016/j.cemconres.2020.106012
Yang JM, Qian CX, 2010. Effect of borax on hydration and hardening properties of magnesium and pottassium phosphate cement pastes., 25(4):613-618. https://doi.org/10.1007/s11595-010-0055-6
Yang JM, Li T, Xu XC, 2017. Effect of fine aggregates on properties of magnesium potassium phosphate cement mortar., 29(10):195-252. https://doi.org/10.1061/(asce)mt.1943-5533.0001991
Yang QB, Wu XL, 1999. Factors influencing properties of phosphate cement-based binder for rapid repair of concrete., 29(3):389-396. https://doi.org/10.1016/s0008-8846(98)00230-0
Yang QB, Zhu BR, Zhang SQ, et al., 2000. Properties and applications of magnesia–phosphate cement mortar for rapid repair of concrete., 30(11):1807-1813. https://doi.org/10.1016/S0008-8846(00)00419-1
Yang YQ, Fang BD, Zhang GH, et al., 2022. Hydration performance of magnesium potassium phosphate cement using sodium alginate as a candidate retarder., 15(3):943. https://doi.org/10.3390/ma15030943
You C, Qian JS, Qin JH, et al., 2015. Effect of early hydration temperature on hydration product and strength development of magnesium phosphate cement (MPC)., 78:179-189. https://doi.org/10.1016/j.cemconres.2015.07.005
Zhang G, Li GX, He TS, 2017. Effects of sulphoaluminate cement on the strength and water stability of magnesium potassium phosphate cement., 132:335-342. https://doi.org/10.1016/j.conbuildmat.2016.12.011
Zhang ZQ, Li YL, Zhu XY, et al., 2021. Meso-scale corrosion expansion cracking of ribbed reinforced concrete based on a 3D random aggregate model., 22(11):924-940. https://doi.org/10.1631/jzus.A2100304
Electronic supplementary materials
Figs. S1–S4
珊瑚砂对磷酸钾镁水泥砂浆力学特性与水化机理的影响
刘昊1,2,3,杨华美4,5,魏厚振3,于基宁6,孟庆山3,颜荣涛1,2
1桂林理工大学,土木与建筑工程学院,中国桂林,541004;2桂林理工大学,广西岩土力学与工程重点实验室,中国桂林,541004;3中国科学院武汉岩土力学研究所,岩土力学与工程国家重点实验室,中国武汉,430071;4武昌理工学院,智能建造学院,中国武汉,430223;5中国长江三峡集团有限公司,水工混凝土工程技术研究室,中国北京,100038;6中铁第一勘察设计院集团有限公司,中国西安,710043
在珊瑚岛礁上,构筑物因为潮汐和风浪的双重侵蚀作用而损伤严重。为确保修补有效和取材便利,人们采用磷酸钾镁水泥和珊瑚砂配制成砂浆对珊瑚岛礁构筑物进行修补。本文旨在探讨珊瑚砂对磷酸钾镁水泥砂浆的宏细观力学特性、抗侵蚀性及水化行为的影响规律,为磷酸钾镁水泥作为快速修补材料在珊瑚岛礁损伤构筑物中应用提供理论基础和技术支撑。
1. 揭示珊瑚砂对磷酸钾镁水泥砂浆宏细观力学特性和抗侵蚀性能的影响规律;2. 采用定量分析的方法阐明珊瑚砂对磷酸钾镁水泥水化产物相组成和相对含量的影响规律。
1. 利用抗压强度测试和显微硬度测试手段分析不同养护龄期下关键因素掺量对磷酸钾镁水泥-珊瑚砂浆宏细观力学特性的影响;2. 将磷酸钾镁水泥砂浆暴露于Na2SO4溶液中,分析其在长期浸泡条件下抗压强度的劣化机制及抗盐溶液侵蚀的行为规律;3. 利用扫描电子显微镜-能谱仪,揭示不同养护龄期下水化产物相形貌及微结构特征,结合X射线衍射,利用绝热法定量分析水化产物相相对含量随养护龄期的变化规律。
1. 与磷酸钾镁水泥-河砂浆相比,磷酸钾镁水泥-珊瑚砂浆体的界面显微硬度值更高,且其界面过渡区平均显微硬度值与抗压强度呈明显的线性关系。2. 磷酸钾镁水泥-珊瑚砂浆在清水和Na2SO4溶液长期浸泡下的抗压强度保持稳定,表现出较好的抗Na2SO4溶液侵蚀能力。3. 珊瑚砂可以在水化初期(1~12 h)改善浆体内溶液环境,抑制KH2PO4的溶解,并生成絮状络合物6KPO2·8H2O;在7~28 d阶段,6KPO2·8H2O逐渐溶解并参与反应,保障MgKPO4·6H2O有足够的时间结晶成核,使得晶体相互搭接,形成了致密的板状结构,进而保障了磷酸钾镁水泥-珊瑚砂浆优异的力学性能和抗侵蚀能力。
磷酸钾镁水泥;珊瑚砂;力学性能;抗侵蚀性;水化机理
https://doi.org/10.1631/jzus.A2200389
https://doi.org/10.1631/jzus.A2200389
Houzhen WEI, https://orcid.org/0000-0002-9397-6066
Received Aug. 15, 2022;
Revision accepted Jan. 23, 2023;
Crosschecked Apr. 3, 2023;
Online first June 12, 2023
© Zhejiang University Press 2023
猜你喜欢
硅酸盐通报(2023年9期)2023-09-22
土壤(2022年3期)2022-07-22
建材与装饰(2022年3期)2022-01-19
铁道建筑技术(2021年4期)2021-07-21
肥料与健康(2020年6期)2020-03-10
科普童话·神秘大侦探(2018年9期)2018-10-25
江西建材(2018年2期)2018-04-14
儿童故事画报·发现号趣味百科(2017年4期)2017-06-30
江西理工大学学报(2015年3期)2015-12-22
当代音乐(下旬刊)(2015年6期)2015-05-30
 Journal of Zhejiang University-Science A(Applied Physics & Engineering)2024年2期
- Journal of Zhejiang University-Science A(Applied Physics & Engineering)的其它文章
- Transfer relation between subgrade frost heave and slab track deformation and vehicle dynamic response in seasonally frozen ground
- Influence of ground effect on flow field structure and aerodynamic noise of high-speed trains
- Constitutive modelling of concrete material subjected to low-velocity projectile impact: insights into damage mechanism and target resistance
- Stress relaxation properties of calcium silicate hydrate: a molecular dynamics study