Piperine regulates the circadian rhythms of hepatic clock gene expressions and gut microbiota in high-fat diet-induced obese rats
Weiyun Zhng, Chi-Tng Ho, Wenlin Wei, Jie Xio, Muwen Lu,
a Guangdong Provincial Key Laboratory of Nutraceuticals and Functional Foods, College of Food Science, South China Agricultural University, Guangzhou 510642, China
b Department of Food Science, Rutgers University, New Brunswick 08901, USA
Keywords: Piperine Circadian clock Obesity Gut microbiota
ABSTRACT The interplay between the host circadian clock and microbiota has signif icant inf luences on host metabolism processes, and circadian desynchrony triggered by high-fat diet (HFD) is closely related to metabolic disorders. In this study, the modulatory effects of piperine (PIP) on lipid metabolism homeostasis, gut microbiota community and circadian rhythm of hepatic clock gene expressions in obese rats were investigated.The Sprague-Dawley (SD) rats were fed with normal diet (ND), HFD and HFD supplemented with PIP,respectively. After 9 weeks, rats were sacrificed with tissue and fecal samples collected for circadian analysis. Results showed that chronic PIP administration ameliorated the obesity-induced alterations in lipid metabolism and dysregulation of hepatic clock gene expressions in obese rats. The gut microbial communities studied through 16S rRNA sequencing showed that PIP ameliorated the imbalanced microbiota and recovered the circadian rhythm of Lactobacillaceae, Desulfovibrionaceae, Paraprevotellaceae, and Lachnospiraceae.The fecal metabolic prof iles indicated that 3-dehydroshikimate, cytidine and lithocholyltaurine were altered,which were involved in the amino acid and fatty acid metabolism process. These findings could provide theoretical basis for PIP to work as functional food to alleviate the lipid metabolism disorder, circadian rhythm misalignment, and gut microbiota dysbiosis with wide applications in the food and pharmaceutic industries.
1. Introduction
Circadian rhythms are oscillations in behavior and physiological functions controlled by internal biological clock, which is modulated by a central clock system located in the hypothalamic suprachiasmatic nucleus (SCN) and peripheral clock systems in the tissues[1-3]. The central clock system receives direct photic input from the retina and synchronizes the peripheral clocks via various nerves, humoral, and other signal factors. The cell-autonomous molecular oscillator relies on an autoregulatory transcriptional/translational feedback loop(TTFL) composed of a series of clock proteins, including circadian locomotor output cycles protein kaput (CLOCK), brain and muscle Arnt-like protein 1 (BMAL1), period protein (PER), cryptochrome protein (CRY), retinoid-related orphan receptors (RORs) and reverse erythroblastosis virus α/β (REVERBS)[4-5].
Mounting evidence indicates that disorders of circadian rhythm might play a pivotal role in lipid metabolic disturbances[6-7]. The food intake has been reported to have a modulating effect on mammalian circadian clocks by influencing the metabolism process in liver and adipose tissue, as well as the oscillation rhythm of the gut microbiota[8]. Many phytochemicals have been revealed to maintain the lipid metabolism homeostasis by regulating hepatic circadian clock gene expressions and gut microbiota[6,9]. Hu et al.[10-11]f ind that ripened Pu-erh tea alleviates circadian rhythm disorders by improving the bile acid-mediated enterohepatic circulation and reshaping of gut microbiota and their metabolites, thus improving the host microecology and health. According to Han et al.[12], oat fiber could reverse high-fat diet (HFD)-induced hepatic clock gene disturbances by targeting the circadian rhythm oscillations of gut microbiota and gut microbiota-derived short chain fatty acids (SCFAs). Therefore, the gut-liver axis plays key roles in the maintenance of circadian rhythms and lipid homeostasis, which could be regulated by food-derived bioactive compounds[13-14].
Piperine (1-piperoylpiperidine, PIP), a naturally occurring alkaloid distributed abundantly in black peppers, has been reported to possess various physiological benefits, including anti-obesity,anti-inflammatory, hepatoprotective and bioavailability-enhancing effects[15]. In our previous studies, it was observed that PIP regulated lipid metabolism in aBmal1/Clock-dependent manner in HepG2 cells,suggesting that the circadian clock genes play important roles in lipid metabolism process regulated by PIP[16]. However, whether PIP could modulate the composition and diurnal oscillation of gut microbiota and hepatic circadian clock gene expressions in obese rats remains unclear. In this study, the influence of PIP on lipid metabolism disorder in liver triggered by HFD in Sprague-Dawley (SD) rats was investigated. The effects of PIP intervention on gut microbiota and the daily oscillations of liver clock gene transcriptions were also evaluated.
2. Materials and methods
2.1 Materials and reagents
PIP (purity 98%) was purchased from Xi’an Tianfeng Biotechnology Co., Ltd. (Xi’an, Shannxi, China). Total cholesterol(TC), total triglyceride (TG), HDL cholesterol (HDL-C), and LDL cholesterol (LDL-C), aspartate aminotransferase (AST) and alanine aminotransferase (ALT) assay kits were purchased from Nanjing Jiancheng Bioengineering Institute (Nanjing, Jiangsu, China). Milli-Q water (18.3 MΩ) was used in all experiments.
2.2 Animals and treatment
This animal study was conducted according to regulations of the Animal Center of China and the protocol was approved by the Animal Committee of South China Agricultural University (protocol number: 2021b182). Seventy-two male specific-pathogen-free SD rats (100−150 g) were purchased from the Guangdong Medical Laboratory Animal Center (Guangzhou, Guangdong, China) at 4 weeks of age. The rats were housed in an autoregulated environment(temperature, (25 ± 2) °C; relative humidity, (65 ± 5)%) in a 12 h light-dark cycle (zeitgeber time (ZT), ZT0 = 8:00 AM, lights on;ZT12 = 8:00 PM, lights off). After 1-week acclimation period, all rats were randomly divided into 3 groups (24 rats per treatment group): the normal diet (ND) group, in which rats were fed a standard diet (23.6% kcal from fat, XTCON50H, Jiangsu Xietong Medicine Bioengineering Co., Jiangsu, China); the HFD group, in which rats were fed with a HFD (45% kcal from fat, XTHF45, Jiangsu Xietong Medicine Bioengineering Co., Jiangsu, China); the PIP-treated HFD group (PIP group), in which rats were fed with a HFD and PIP(30 mg/(kg·day)). All rats were allowed free access to sterile water. Body weight, food, and water consumption were measured every week. After 9-week treatment, rats in all three groups were anesthetized with sodium pentobarbital (45 mg/kg body weight)and sacrificed at 6-h intervals throughout the daily light-dark cycle starting at ZT0 (n= 6 per group at each time point) after fasting for 12 h. Fecal samples were collected at ZT0, ZT6, ZT12, and ZT18.The blood was collected from the abdominal aorta and centrifuged at 6 000 ×gfor 20 min at 4 °C to get supernatant serum samples. Liver and epididymal fat were weighed, and a part of biopsy samples (liver,epididymal) were collected and fixed directly in 4% paraformaldehyde for histological analyses. All samples were rapidly frozen in liquid nitrogen and stored at −80 °C for further analysis.
2.3 Hematoxylin and eosin (H&E) staining
The liver and epididymal fat were processed to paraffin wax then stained with H&E. Analysis was performed using National Institutes of Health ImageJ software to quantify the adipocyte area. Histological sections were observed under an Olympus CX41 light microscope(Olympus Optical Co., Ltd., Tokyo, Japan).
2.4 RNA isolation and real-time qPCR (RT-qPCR)
Total mRNA was extracted from the liver using the TRIzol reagent (TransGen Biotech, Beijing, China). cDNA was synthesized using a reverse transcriptase kit (TransGen Biotech, Beijing, China).The relative mRNA expression was quantified by using an SYBR green PCR kit (TransGen Biotech, Beijing, China) and the CFX96 real-time system (Bio-Rad, Hercules, CA, USA). The RT-qPCR primer sequences used for this experiment are listed in Table 1.Glyceraldehyde 3-phosphate dehydrogenase (GAPDH) was used as an internal control for gene expression normalization for RT-qPCR.
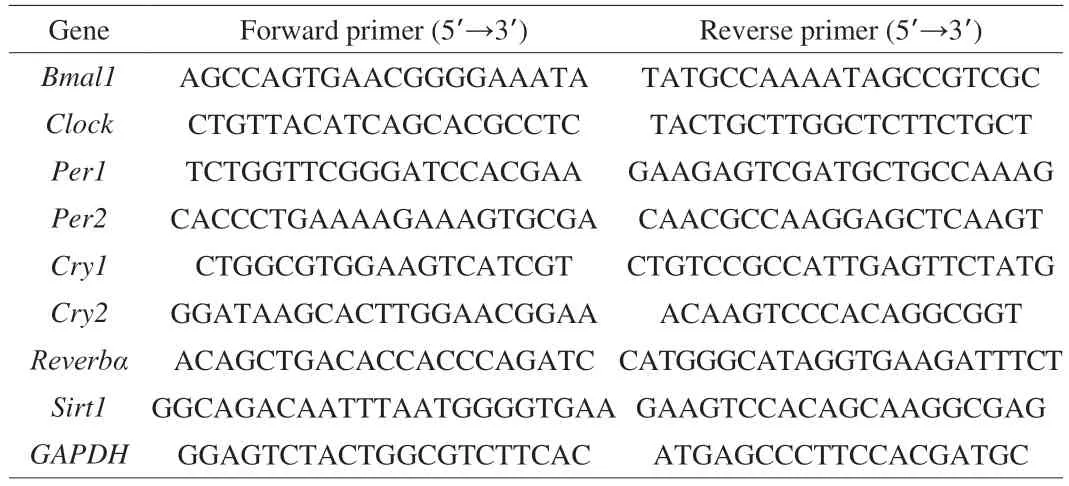
Table 1 Primer sequences used for RT-qPCR analysis.
2.5 Gut microbiota analysis
Microbial community genomic DNA was extracted from the fecal samples using the DNA Extraction Kit (Qiagen, Inc., Shanghai,China) according to the manufacturer’s instructions. The DNA extract was quantitatively analyzed by NanoDrop 2000 UV-vis spectrophotometer (Thermo Scientific, Wilmington, Delaware,USA) and qualitatively examined by 1% agarose gel electrophoresis.338F (5’-ACTCCTACGGGAGGCAGCAG-3’) and 806R(5’-GGACTACHVGGGTWTCTAAT-3’) were used as primers to amplify the V3-V4 variable region of the bacterial 16S rRNA gene.The PCR amplicons were purified by VAHTSTM DNA Clean Beads(Vazyme, Nanjing, Jiangsu, China) and quantified with Quant-iT PicoGreen dsDNA Assay Kit (Invitrogen, Carlsbad, CA, USA) on a microplate reader (FLx800; BioTek, Winooski, VT, USA). The sequencing library was established by using TruSeq Nano DNA LT Library Prep Kit (Illumina, San Diego, CA, USA) and then sequenced on an Illumina MiSeq platform (Illumina, San Diego, CA, USA).
2.6 Metabolic pathway analysis
Fecal samples were immersed in methyl alcohol, then the mixture was vortexed for 30 s, grounded for 90 s, and centrifuged at 12 000 r/min for 10 min at 4 °C. The supernatant was filtered through a 0.22 μm ultrafiltration membrane and subjected to LC-MS detection. The LC analysis was performed using Vanquish UHPLC System (Thermo Fisher Scientific, Waltham, MA, USA) equipped with ACQUITY UPLC®HSS T3 column (150 mm × 2.1 mm, 1.8 μm)(Waters, Milford, MA, USA). The flow rate was set at 0.25 mL/min.The injection volume was 2 μL. For liquid chromatographyelectrospray ionization-mass spectrometry (LC-ESI+-MS) analysis, the mobile phases consisted of (C) 0.1% formic acid in acetonitrile (V/V)and (D) 0.1% formic acid in water (V/V). Separation was conducted under the following gradient: 0−1 min, 2% C; 1−9 min, 2%−50% C;9−12 min, 50%−98% C; 12−13.5 min, 98% C; 13.5−14 min,98%−2% C; 14−20 min, 2% C. For LC-ESI--MS analysis, the analytes were extracted with a combination of (A) acetonitrile and (B) ammonium formate. Separation was conducted under the following gradient: 0−1 min, 2% A; 1−9 min, 2%−50% A;9−12 min, 50%−98% A; 12−13.5 min, 98% A; 13.5−14 min,98%−2% A; 14−17 min, 2% A. Mass spectrometric detection of metabolites was performed on Orbitrap Exploris 120 (Thermo Fisher Scientific, Waltham, MA, USA) with ESI ion source. Simultaneous MS1 and MS/MS (Full MS-ddMS2 mode, data-dependent MS/MS)acquisition was used. The parameters were as follows: sheath gas pressure, 206.84 kPa; aux gas flow, 3.33 L/min; spray voltage,3.50 kV and −2.50 kV for ESI+and ESI-, respectively; capillary temperature, 325 °C; MS1 range,m/z100−1 000; MS1 resolving power, 60 000 full width at half maximum (FWHM); the number of data dependent scans per cycle, 4; MS/MS resolving power,15 000 FWHM; normalized collision energy, 30%; dynamic exclusion time, automatic.
The metabolites were identified based on accurate mass with a maximum deviation of 30 × 10-6by searching the HMDB (http://www.hmdb.ca), massbank (http://www.massbank.jp/), LipidMaps(http://www.lipidmaps.org), mzclound (https://www.mzcloud.org)and KEGG (http://www.genome.jp/kegg/). ThePvalue, variable importance projection (VIP) generated by orthogonal projections to latent structures discriminant analysis (OPLS-DA), and fold change (FC) were applied to discover the contributable variable for classification.P-values < 0.05 and VIP values > 1 were considered statistically significant metabolites. Finally, differential metabolites were subjected to pathway analysis by MetaboAnalyst, which combines results from powerful pathway enrichment analysis with the pathway topology analysis. The identified metabolites in metabolomics were then mapped to the KEGG pathway for biological interpretation of higher-level systemic functions. This work was performed at Suzhou PANOMIX Biomedical Tech Co., Ltd. (Suzhou,Jiangsu, China).
2.7 Statistical analysis
All data were presented as the mean ± standard error of the mean(SEM). The statistical significance of differences (P< 0.05, 0.01, and 0.001) between the groups was determined by one-way ANOVA with Tukey’s post hoc test using GraphPad Prism (Version 8.3, GraphPad Software, Inc., San Diego, CA, USA). The correlation analysis among different groups was performed using SPSS software (version 24.0;SPSS Inc., Chicago, IL, USA).
3. Results and discussion
3.1 Effect of PIP on bodyweight, food intake, and water intake in HFD rats
As shown in Fig. 1A, PIP supplementation significantly decreased the body weight of rats fed by HFD. At the end of the 9thweek, the body weight of rats in the PIP group was (6.70 ± 0.65)%lower than that in HFD group. No difference in the water intake and food intake were observed among groups, suggesting that the weight-reducing effect of PIP is not due to the reduced intake of calories (Figs. 1B and C). As shown in Figs. 1D and E, compared with HFD group, the treatment of PIP decreased the ratio of epididymal white adipocyte tissue weight to from (14.66 ± 1.85) g to(11.43 ± 1.62) g, and the ratio of liver to body weight from(3.12 ± 0.08)% to (2.81 ± 0.05)%, showing that PIP exerted anti-obesity effect by lowering adipose tissue and liver weight in HFD-fed rats.As shown in Figs. 1F and I, a significant increase in average adipocyte size (from (4 438.23 ± 502.35) μm2to (7 696.24 ± 436.61) μm2)was observed in HFD group compared with ND group, while the intake of PIP decreased the average size of the cells to(5 255.11 ± 284.62) μm2, suggesting that PIP may inhibit adipogenesis and hyperplasia of white adipocytes. Liver histopathological changes were measured by H&E staining to evaluate the condition of liver injury. According to liver sections shown in Fig. 1J, the increased lipid droplets and vacuolization were observed in the liver tissue of HFD rats, while PIP administration remarkably alleviated the pathological changes in liver tissues. The levels of ALT and AST in liver were examined to evaluate the preventative effects of PIP on HFD-induced fatty liver and hyperlipidemia. As shown in Figs. 1G and H, the serum ALT and AST levels in the HFD group were significantly increased compared with the ND group, indicating that chronic HFD intake led to liver injury. The addition of PIP decreased the level of AST from(21.31 ± 0.99) U/L to (16.25 ± 0.58) U/L, indicating that PIP exerted protective effect against hepatic damage in HFD-induced obese rats.These findings demonstrated that PIP ameliorated the liver damage,hepatic fat accumulation, and fat deposition in rats caused by chronic HFD intake.
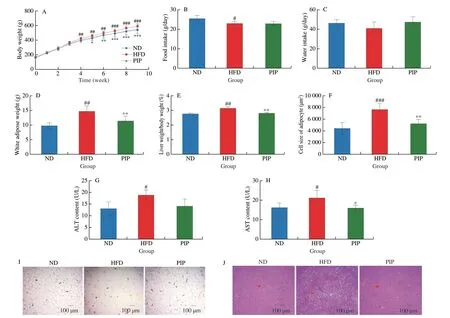
Fig. 1 Intervention effect of PIP on physiological index and histopathology in rats fed by HFD. (A) Body weight; (B) Food intake; (C) Water intake; (D) White adipose weight; (E) Liver weight/body weight; (F) Cell size of adipocyte; (G) ALT level; (H) AST level; (I) Representative H&E staining of liver sections;(J) Representative H&E staining of white adipose sections. Data were presented as mean ± SEM (n = 6 per group), #P < 0.05, ##P < 0.01, ###P < 0.001 vs ND group,*P < 0.05, **P < 0.01, ***P < 0.001 vs HFD group. The same below.

Fig. 2 Regulating of blood lipids and circadian clock in the liver by PIP. (A) TC; (B) TG; (C) LDL-C; (D) HDL-C; (E-L) The mRNA levels of circadian oscillator components Bmal1, Clock, Cry1, Cry2, Per1, Per2, Reverbα and Sirt1 in liver at different ZT points of the day. Transcript levels were measured by RT-qPCR and normalized to GAPDH mRNA levels.
3.2 PIP improves HFD-induced disruption in circadian rhythm of serum lipids
The fluctuation of blood lipids levels is closely related to the circadian rhythm of lipid metabolism, which could reflect the difference between the metabolic activities of day and night[6,17]. To evaluate the modulating effect of PIP on the circadian rhythm of blood lipids, the level of TG, TC, LDL-C and HDL-C were examined at different ZT points: ZT0, ZT6, ZT12, ZT18. The serum levels of TC, TG, LDL-C and HDL-C showed circadian oscillations over 24 h in the ND group. As shown in Figs. 2A-D, compared to the ND group, HFD treatment increased TC levels in 24 h with a peak at ZT18, which was reduced by PIP supplementation. The TG and LDL-C levels were elevated in the HFD group compared to those in the ND group, while PIP treatment decreased TG and LDL-C levels and restored their increased oscillatory amplitude induced by HFD.Meanwhile, PIP reversed the decrease in HDL-C levels and weakened oscillatory amplitude caused by HFD in the 24-h cycle. These results suggested that PIP could alleviate HFD-induced lipid metabolism disorder and disruption in the circadian oscillation of serum lipids levels in rats.
3.3 PIP ameliorates the circadian rhythm of liver clock gene mRNA expression
Recent studies revealed that HFD could disturb circadian rhythm and accelerate the development of metabolic disorders[18].Expressions of circadian clock genes in the liver plays a crucial role in regulating energy metabolism, which could be controlled by food phytochemicals[7,18]. To examine whether PIP affected circadian rhythms in the HFD group, the expression levels of clock genesBmal1,Clock,Per1,Per2,Cry1,Cry2,Reverbα, andSirt1were measured every 6 h in 24 h. As shown in Figs. 2E-M, HFD treatment induced phase shift in the expression levels ofBmal1,Clock,Per2,Cry1andCry2genes, shallowed oscillation ofReverbαgene expression and dampened rhythmic expression ofPer1, indicating that circadian rhythm desynchrony was triggered under high fat dietary condition. After PIP supplementation, the phase shift of theClock,Cry1,Cry2, andPer2genes and shallowed oscillation of theSirt1gene were restored, the oscillatory amplitude ofBmal1andReverbαand rhythmic expression ofPer1were recovered. These findings indicated that PIP could attenuate the perturbation in circadian oscillation of hepatic clock gene expressions induced by HFD in rats.
3.4 Regulating effects of PIP on gut microbiota in HFD rats
To investigate the effect of PIP on the overall structure and distribution of gut microbiota in HFD rats, the fecal samples of rats were analyzed using 16S rRNA sequencing. Indexes were measured to conduct a comprehensive analysis of theα-diversity of the microbial community, including the Chao1 and observed species diversity indexes in representing abundance of the microbial communities,the Shannon and Simpson indexes in representing diversity of the microbial communities, Pielou’s evenness index in representing uniformity of the microbial communities, and Good’s coverage index in representing coverage of the microbial communities. According to box-plot graphs shown in Fig. 3A, the microbial community richness was increased after PIP intervention with no significant difference in community diversity between HFD and PIP groups, indicating that PIP partially restored theα-diversity of the gut microbiota.According to Bray-Curtis principal coordinate analysis (PCoA)diagram presented in Fig. 3B, the microbial community composition of the different groups showed clear clustering, suggesting that PIP induced differences in species. As shown in Fig. 3C, based on the Venn diagram of amplicon sequence variant/operational taxonomic unit (ASV/OTU), the ND group had 8 813 unique microbes, while this number in the HFD group was reduced to 4 781, which was increased to 6 993 in the PIP group, indicating that PIP treatment altered the types of the microbiota in fecal samples of rats. Previous studies suggested that HFD treatment could cause dysregulation of the gut microbiota by increasing the Firmicutes/Bacteroidetes ratio[19]. As shown in Fig. 3E, the Firmicutes/Bacteroidetes ratio was significantly increased in the HFD group at the phylum level, which was reduced by PIP supplementation from 28.71 ± 6.27 to 21.63 ± 3.82 indicating that PIP restored gut microbiota dysbiosis in HFD rats.
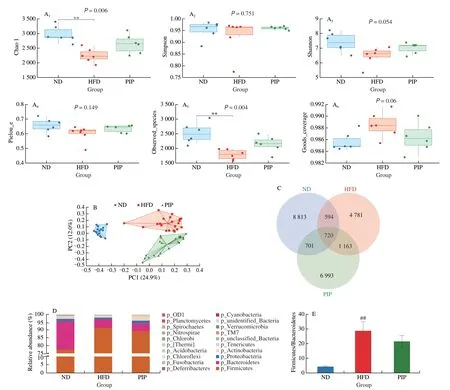
Fig. 3 Effects of PIP on the regulation of gut microbiota diversity and community structure. (A1-A6) Chao1 index, Simpson index, Shanon index, Pielou’s evenness index, Observed species index, and Good’s coverage index were used as the α-diversity measurement for fecal samples; (B) PCoA of β-diversity of gut microbiota; (C) ASV/OTU Venn diagram; (D) Analysis of the abundance of gut microbiota at the phylum level classification in three groups; (E) The ratio of Firmicutes to Bacteroidetes in three groups.
3.5 Effect of PIP on the diurnal rhythms of the gut microbiota composition in HFD rats
The gut microbiota has been identified as a key element involved in host circadian rhythms and exhibits diurnal variations in relative abundance and function, which could be disturbed by HFD treatment[20]. Recent studies have reported that the abnormal diurnal oscillations in the abundance of Lactobacillaceae, Lachnospiraceae,and Desulfovibrionaceae could be regulated byCyclocarya paliurusflavonoids[21]. To evaluate whether the administration of PIP altered circadian rhythm of gut microbiota, rats’ fecal samples in each group were collected every 6 h for 24 h for 16S rRNA gene sequencing.As shown in Figs. 4A-E, significant rhythmicity could be observed in the abundance of Lactobacillaceae, Desulfovibrionaceae,Paraprevotellaceae, and Lachnospiraceae in fecal samples. At ZT6,ZT12 and ZT18, the abundance of Lactobacillaceae showed a significant decrease in the HFD group compared with ND group, and PIP treatment increased the abundance of Lactobacillaceae at ZT6 and ZT18. As shown in Fig. 4C, compared to the HFD group, PIP significantly increased the relative abundance of Desulfovibrionaceae at ZT0, ZT6, ZT12 and ZT18. According to Fig. 4D, HFD significantly increased the relative abundance of Paraprevotellaceae,which was reduced by PIP with similar fluctuations to those from the ND group in 24 h. PIP intervention also reversed the increased abundance of Lachnospiraceae induced by HFD at ZT0, ZT6, ZT12 and ZT18. These results suggested that the diurnal circadian rhythms of gut microbiota in composition and abundance at the family level were disrupted by HFD, which could partially be restored by PIP treatment. According to Choi et al.[20], a small percentage of the gut microbiota exhibits circadian oscillations in their abundance,which were known as microbial oscillators. Microbial oscillators have been demonstrated to receive dietary signals and regulate host circadian metabolism through direct or indirect signaling by small molecule mediators, including metabolites[22]. Based on the findings in our study, microbial oscillators Lactobacillaceae, Lachnospiraceae,Paraprevotellaceae, and Desulfovibrionaceae might be involved in the regulating effect of PIP on the disrupted circadian rhythms and alterations of the gut microbiome composition induced by unhealth diets.

Fig. 4 Relative abundance of the gut microbiota at family level in correlation with clock genes and lipid indexes. (A) Relative abundance of the top family from samples, A1. ND, A2. HFD, A3. PIP; The variation in the diurnal oscillations of the abundance of (B) Lactobacillaceae; (C) Desulfovibrionaceae;(D) Paraprevotellaceae; (E) Lachnospiraceae; (F) Spearman’s correlation heatmap of gut microbiota, clock genes and lipid indexes.
3.6 Correlation analysis between gut microbiota, clock genes, and lipid profiles in PIP-intervened HFD rats
Spearman’s correlation and analysis of variance were used to assess the internal consistency, the correlation between test and association between expression levels of clock genes, obesityrelated biochemical indexes in liver and serum, and changes in the gut microbiota in rats. As shown in Fig. 4F, the abundance of Verrucomicrobiaceae showed a significant negative correlation with the relative expression ofBmal1andPer1genes. The abundance of Brucellaceae, Deferribacteraceae, and Helicobacteraceae showed a significant positive correlation with the relative expression of theClockgene. The abundance of Brucellaceae, Desulfovibrionaceae and Deferribacteraceae were negatively correlated with the relative expression of thePer2gene. The abundance of Pseudomonadaceae was positively correlated with the relative expression ofCry1andReverbαgenes, and negatively correlated with the relative expression of theSirt1gene. The abundance of Mogibacteriaceae was positively correlated with the relative expression of theSirt1gene.The increased plasma TC, LDL-C, and TG and decreased HDL-C concentration are characteristic features of dyslipidemia[23]. Based on the results from our study, dyslipidemia was positively associated with the abundance of Verrucomicrobiaceae, Paraprevotellaceae, and Lachnospiraceae, while negatively associated with the abundance of Lactobacillaceae and Christensenellaceae. Recently, it was reported that Lachnospiraceae played an important role in the progression of liver steatosis, and the increased abundance of Lactobacillaceae and Christensenellaceae was associated with the alleviation of lipid metabolism disorders[24-26]. As shown in Fig. 4F, similar results were observed in the correlation between progression of dyslipidemia and abundance of Lachnospiraceae, Lactobacillaceae and Christensenellaceae. As microbial oscillators, Lachnospiraceae,Lactobacillaceae, Desulfovibrionaceae, and Paraprevotellaceae exhibited daily rhythm in the composition and abundance, which were strongly associated with clock gene expressions and lipid levels, suggesting that gut microbiota played important roles in the alleviation effect of PIP on HFD-induced circadian rhythm disturbances in obese rats.
3.7 PIP altered the fecal metabolic profiles in HFD-fed rats
To further determine the difference in microbial metabolites between groups, fecal metabolic profiles were determined. OPLS-DA was used to identify metabolites that were expressed at different levels among groups. As shown in Figs. 5A and B, the OPLS-DA under positive and negative ion modes all showed a clear separation between the ND, HFD and PIP groups, revealing significant fecal metabonomic differences between these groups. Using the criteria of variable importance for projection (VIP) values (VIP > 1) andP-values from pairedt-test (P-value < 0.05), potential biomarkers associated with changes in gut microbiota abundance were identified. As shown in Fig. 5B and Table 2, among all metabolites determined, those that play important roles in the fatty acid metabolism, nucleotide metabolism and amino acid metabolism and that varied between groups were selected based on the VIP. Results revealed that 7 metabolites were up-regulated and 8 metabolites were down-regulated in HFD group compared with ND group,which were listed and clustered in Fig. 5C. Metabolites that were up-regulated included uridine, eicosadienoic acid, 3-dehydroshikimate,indolepyruvate, 13S-hydroxyoctadecadienoic acid, arachidic acid, and deoxyribose; metabolites that were down-regulated included lithocholyltaurine, cholesterol,D-phenylalanine, cytidine,L-tyrosine, uracil, (R)-10-hydroxystearate, and dodecanoic acid.There existed significantly different types of metabolites among the ND and HFD group, suggesting that HFD treatment affected the composition of fecal metabolites. As shown in Fig. 5D and Table 3,a total of 15 differential metabolites were significantly altered in PIP group compared with HFD group, including 7 up-regulated and 8 down-regulated metabolites. PIP supplementation increased the contents of lithocholyltaurine, urocanic acid, 7-dehydrocholesterol,cytidine monophosphate (CMP), niacinamide, homo-L-arginine,andO-acetylserine, and reduced levels of 9,10-epoxyoctadecenoic acid, ketoleucine,β-alanyl-L-lysine, deoxyguanosine, 9-OxoODE,12-keto-leukotriene B4, 3-dehydroshikimate and cytidine. It could be observed that PIP reversed the changes in relative metabolite levels,such as 3-dehydroshikimate, cytidine and lithocholyltaurine, which were closely associated with fatty acid metabolism and nucleotide metabolism. These results indicated that both the HFD and PIP treatment could induce significant variations in fecal metabolites,which were closely related with host circadian clocks. Dietary nutrients absorbed by the gut and metabolites of the gut microbiota were carried to the liver through the portal vein, while the liver transported bile acids and antimicrobial molecules to the gut via the biliary tract, regulating the distribution of gut microbiota[27]. Therefore,the intimate connection between the gut and liver played a pivotal role in the modulation of the gut-liver metabolic homeostasis. It was worth to note that changes in lithocholyltaurine had been reported to be involved in the regulation of bile acid homeostasis through gut-liver axis, which might partly explain the regulation effect of PIP on lipid metabolism disorders[28]. To further investigate the roles of these potential biomarkers in the modulation of lipid metabolism by PIP,KEGG pathway enrichment analysis was conducted and presented in Fig. 5E. According to theP-value and impact value, 8 metabolic pathways includingβ-alanine metabolism, pyrimidine metabolism,dopaminergic synapse, cortisol synthesis and secretion, cushing syndrome, ABC transporter, biosynthesis of amino acids, linoleic acid metabolism, tyrosine metabolism, and gap junction were obtained. The majority of the above pathways are involved in the metabolism process of the amino acid and fatty acid, which may serve as potential targets for metabolic disorder regulated by PIP treatment[29-30].

Fig. 5 Alterations of the metabolites in fecal samples and correlation analysis between metabolites and gut microbiota after PIP treatment. OPLS-DA score plot of fecal samples collected from different treatment groups of rats in (A) positive ion mode and (B) negative ion mode; Differential metabolites between (C) the ND and HFD groups and (D) the HFD and PIP groups; (E) The metabolic pathway analysis of bubble graphs; (F) Spearman’s correlation heatmap of gut microbiota and fecal metabolites.

Table 2 Differential metabolites identified in the ND group compared with the HFD group.
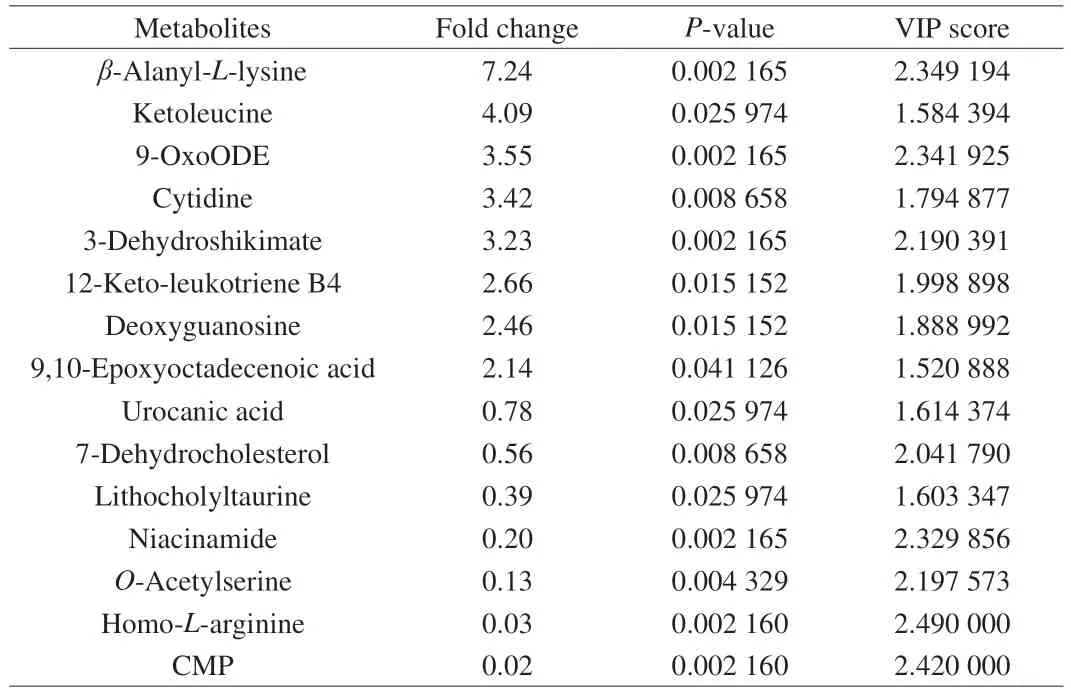
Table 3 Differential metabolites identified in the PIP group compared with the HFD group.
3.8 Correlation analysis between the gut microbiota and fecal metabolites in rats
As depicted in the heatmap in Fig. 5F, spearman’s correlation analysis was performed to identify the correlation between the gut microbiota composition and differential profiles of fecal metabolites that were affected by PIP treatment. Clear correlations could be observed between certain gut microbiota and fecal metabolites:the abundance of Lachnospiraceae was positively correlated with 3-dehydroshikimatee content; the abundance of Bifidobacteriaceae was negatively correlated with levels ofβ-alanyl-L-lysine,ketoleucine, 9-OxoODE and 3-dehydroshikimate, and was positively correlated with niacinamide and lithocholyltaurine; the abundance of Verrucomicrobiaceae was positively correlated withβ-alanyl-Llysine, 9-OxoODE, 3-dehydroshikimate, and deoxyguanosine content,and was negatively correlated with the quantity of homo-L-arginine and niacinamide; the abundance of Prevotellaceae was positively correlated with ketoleucine content. Changes in gut microbiotaderived metabolites such as fatty acids and bile acids could also be observed in Fig. 5, which had been revealed as potential mediators for gut microbiota-host circadian communication[31]. Therefore, our results showed that PIP administration induced alterations of fecal metabolites in rats produced by the characteristic gut microbiota,which were also likely to be involved in the modulation effect of PIP on circadian clock. However, the molecular mechanisms underlying the effect of altered metabolites induced by PIP on the lipid metabolism and hepatic circadian clock remains unclear.
4. Conclusion
In this study, the intervention effect of PIP on HFD-induced lipid metabolic disorder and circadian rhythm disturbances were investigated from the perspective of the gut-liver axis in rats. Results showed that PIP alleviated obesity triggered by high calory intake by inhibiting fat accumulation in liver and adipose tissue. The abnormal circadian oscillation of the hepatic clock gene expressions in rats caused by HFD was also alleviated after PIP administration,which was closely associated with changes in the fecal metabolome and remodeling of gut flora based on the correlation analysis.Therefore, it is suggested that PIP could regulate lipid metabolism by ameliorating the hepatic circadian misalignment and alterations in gut microbial communities caused by disruption in energy homeostasis.This work could provide theoretical basis for PIP as a multifunctional phytochemical with potential applications in the food and pharmaceutic industries.
Conflicts of interest
Chi-Tang Ho is a senior editor forFood Science and Human Wellnessand was not involved in the editorial review or the decision to publish this article. The authors declare that they have no known competing financial interests or personal relationships that could have appeared to influence the work reported in this paper.
Acknowledgements
This work was financially supported by the Program for Guangdong Introducing Innovative and Entrepreneurial Teams(2019ZT08N291), the National Natural Science Foundation of China(31901689), and the Natural Science Foundation of Guangdong Province, China (2021A1515012124).
- 食品科学与人类健康(英文)的其它文章
- Betalains protect various body organs through antioxidant and anti-inf lammatory pathways
- Effects of Maillard reaction and its product AGEs on aging and age-related diseases
- Characterization of physicochemical and immunogenic properties of allergenic proteins altered by food processing: a review
- Polyphenol components in black chokeberry (Aronia melanocarpa)as clinically proven diseases control factors—an overview
- Food-derived protein hydrolysates and peptides: anxiolytic and antidepressant activities, characteristics, and mechanisms
- Recent advances in the study of epitopes, allergens and immunologic cross-reactivity of edible mango

