An Update of the Catalog of Radial Velocity Standard Stars from the APOGEE DR17
Qing-Zheng Li , Yang Huang , Xiao-Bo Dong , Jian-Jun Chen , and A-Li Luo
1 Yunnan Observatories, Chinese Academy of Sciences, Kunming, Yunnan 650011, China
2 School of Astronomy and Space Science, University of Chinese Academy of Sciences, Beijing 100049, China; huangyang@ucas.ac.cn
3 CSA Key Laboratory of Optical Astronomy, National Astronomical Observatories, Chinese Academy of Sciences, Beijing 100101, China
4 Key Laboratory of Space Astronomy and Technology, National Astronomical Observatories, Chinese Academy of Sciences, Beijing 100101, China
Abstract We present an updated catalog of 46,753 radial velocity (RV) standard stars selected from the APOGEE DR17.These stars cover the Northern and Southern Hemispheres almost evenly, with 62% being red giants and 38%being main sequence stars.These RV standard stars are stable on a baseline longer than 200 days(with 54%longer than one year and 10%longer than five years)with a median stability better than 215 m s−1.The average number of observations of those stars is 5 and each observation is required to have signal-to-noise ratio greater than 50 and RV measurement error smaller than 500 m s−1.Based on the new APOGEE RV standard star catalog,we have checked the RV zero-points (RVZPs) for current large-scale stellar spectroscopic surveys including RAVE, LAMOST, GALAH and Gaia.By careful analysis, we estimate their mean RVZP to be +0.149 km s−1,+4.574 km s−1 (for LRS), −0.031 km s−1 and +0.014 km s−1, respectively, for the four surveys.In the RAVE,LAMOST (for MRS), GALAH and Gaia surveys, RVZP exhibits a systematic trend with stellar parameters(mainly [Fe/H], Teff, log g, GBP −GRP and GRVS).The corrections to those small but clear RVZPs are of vital importance for these massive spectroscopic surveys in various studies that require extremely high RV accuracies.
Key words: stars: fundamental parameters – (stars:) binaries: general – stars: general – catalogs
1.Introduction
The velocity component of a star in the line of sight direction can be defined by the Doppler shift of the spectrum captured by the telescope.It can be converted into the framework of the solar system’s center of mass, called the “barycentric” or“heliocentric” radial velocity (RV).The “barycentric” or“heliocentric”RV represents the rate of change of the distance between the Sun and the star (for a detailed definition of RV,see Lindegren & Dravins 2003).The measurement of RV is essential to the construction of complete stellar 6D information(3D position and 3D velocity).Its accuracy is required to be better than several km s−1, or even a few m s−1, for various Galactic studies such as understanding the structure and assembly history of the Milky Way (Binney & Tremaine 1987; Bovy et al.2012b; Bovy 2015; Belokurov et al.2018;Gaia Collaboration et al.2018b; Helmi et al.2018; Helmi 2020),estimating the mass of the Milky Way(Xue et al.2008;Bovy et al.2012a; Huang et al.2016; Eilers et al.2019; Zhou et al.2022), defining orbital parameters and characteristics of binary systems (Mayor & Queloz 1995; Gao et al.2017; El-Badry et al.2018; Tian et al.2018; Liu et al.2019; Li et al.2022b), identification of exoplanets (Xie et al.2016; Trifonov et al.2020)and systematically searching for hypervelocity stars(Brown et al.2005, 2014; Huang et al.2017, 2021; Koposov et al.2020;Li et al.2021,2022a,2022c;Marchetti et al.2022).
In the past decades, RVs have been measured for over tens of millions of stars from a series of large-scale spectroscopic surveys, including, ground-based surveys, such as GALactic Archaeology with HERMES (GALAH, De Silva et al.2015;Buder et al.2018), Sloan Digital Sky Survey/Apache Point Observatory Galactic Evolution Experiment(SDSS/APOGEE,Blanton et al.2017; Majewski et al.2017; Abdurro’uf et al.2022), RAdial Velocity Experiment (RAVE, Steinmetz et al.2006;Kunder et al.2017),SDSS/Sloan Extension for Galactic Understanding and Exploration (SDSS/SEGUE, Yanny et al.2009;Eisenstein et al.2011;Dawson et al.2013;Rockosi et al.2022), Large Sky Area Multi-Object Fiber Spectroscopic Telescope (LAMOST, Cui et al.2012; Deng et al.2012; Zhao et al.2012;Luo et al.2015)and space-based surveys,i.e.,Gaia Radial Velocity Spectrometer (Gaia RVS, Katz et al.2004;Cropper et al.2018;Gaia Collaboration et al.2018a,2018b).In the near future,more stellar RVs will be obtained thanks to the ongoing/planningmassive spectroscopic surveys, such as the SDSS-V (Kollmeier et al.2017), 4-metre Multi-Object Spectrograph Telescope (4MOST, de Jong et al.2019)and Dark Energy Spectroscopic Instrument (DESI, DESI Collaboration et al.2016; Dey et al.2019).
The measurement of RV can be influenced by various factors, including the type of instrument, spectral resolution,accuracy of wavelength calibration, methodology used to derive RV,and even observation conditions and environments.These factors can lead to significant variations in RV measurements.To correct for these effects, it is necessary to construct a set of RV standard stars which are stable enough in a long observation baseline.
At present,over tens of thousands of RV standard stars have been defined by various efforts, including about 5000 bright RV standard stars with extreme stability of 15 m s−1over an average baseline of six years constructed by a long monitoring project (Udry et al.1999a, 1999b; Crifo et al.2007, 2010;Chubak et al.2012; Soubiran et al.2013, 2018) and over 18,000 standard stars with a median stability of 240 m s−1over a one-year baseline with a large color and magnitude range constructed from the APOGEE Data Release (DR)14 (Huang et al.2018, hereafter H18).However, the number spatial density of current RV standard stars is so low that it is hard to calibrate the RV zero-points(RVZPs)of the RV measurements from future massive spectroscopic surveys.
This paper is an update to H18.Thanks to the long-term repeated observations and more southern stars observed during SDSS-IV, the number of RV standard stars has been trebled with a much larger sky coverage from APOGEE DR17,compared to the previous version of H18.The paper is structured as follows.In Section 2, we correct the possible RVZPs of the RV measurements of APOGEE DR17.In Section 3,we describe the details of selections of RV standard stars from APOGEE DR17.In Section 4, we use the selected APOGEE RV standard stars to calibrate the RVZPs of the RAVE, GALAH, LAMOST and Gaia surveys.Finally, we conclude in Section 5.
2.Corrections to APOGEE RV Measurements
As found in H18, the measured RVs of APOGEE surveys exhibit a systematic trend as a function of Teff.To correct this trend, 1611 reference RV standard stars, collected from the various literatures (Udry et al.1999a, 1999b; Nidever et al.2002;Chubak et al.2012;Soubiran et al.2013),are adopted to calibrate the RVZP of APOGEE DR14(Abolfathi et al.2018).In this paper, we apply these reference RV standard stars to check the RVZP of APOGEE DR17 (Abdurro’uf et al.2022).The details of the compilation of these reference RV standard stars are described in H18.Generally, the RVs of these 1611 reference stars are required to have stability better than 100 m s−1over a baseline of at least one year.
By cross-matching the 1611 reference RV standard stars to APOGEE DR17, 118 common stars are found to check the RVZPs of APOGEE DR17.The RV differences between APOGEE and reference RV standard stars show a significant systematic trend along stellar effective temperature (see Figure 1).To describe this trend,a simple linear fit is adopted:
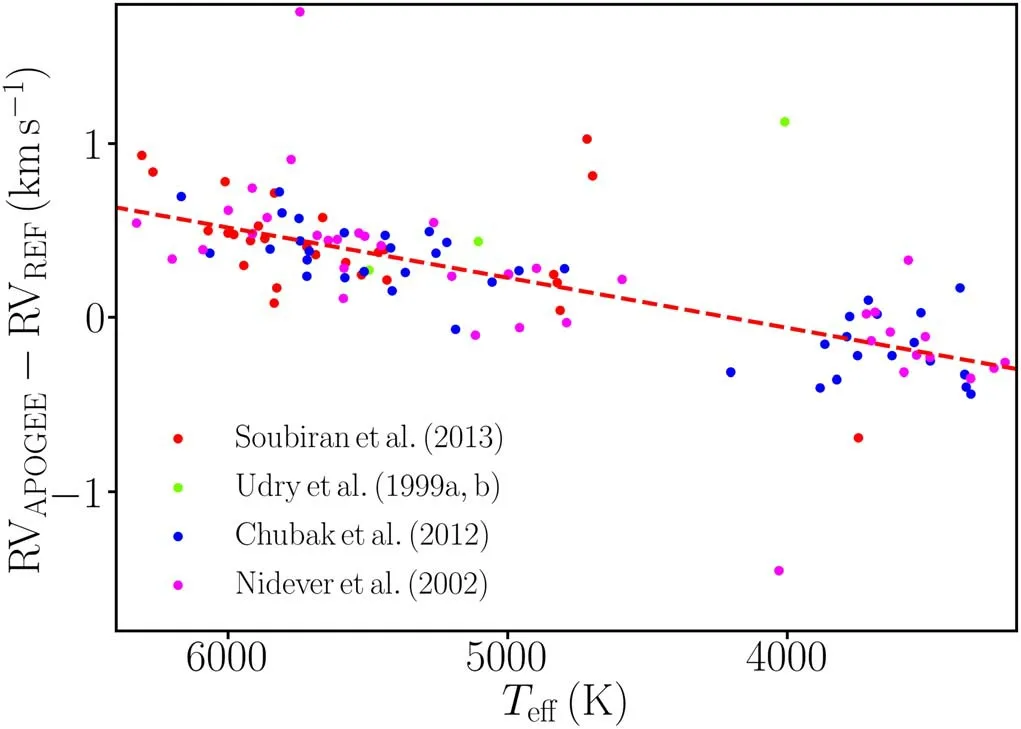
Figure 1.The differences between the APOGEE RV(RVAPOGEE)and the RV standard star (RVREF) collected from the literature as a function of effective temperature (Teff).Stars with different colors are reference RV standard stars selected from different catalogs, as marked in the bottom-left corner.The dashed red line is the best linear-fit to the data points.
The coefficients found here are similar to those reported in H18, implying the robustness of the instruments and RV measurements.
We also cross-matched a set of 4813 RV standard stars constructed by Soubiran et al.(2018)with APOGEE DR17 and 205 common stars were left.The systematic trend found by these common stars is generally consistent with that displayed in Figure 1 for stars with Teff>4000 K.For cold stars with Tff<4000 K, few stars are found.
3.APOGEE Radial Velocity Standard Stars
3.1.APOGEE Survey
APOGEE (Zasowski et al.2013, 2017; Majewski et al.2016; Majewski et al.2017) is a large-scale high-resolution(R ∼22,500) spectroscopic survey in the near-infrared (Hband 1.51–1.70 μm),provided by the 2.5 m Sloan Foundation Telescope (Gunn et al.2006) and the 1 m New Mexico State University (NMSU) Telescope (Holtzman et al.2010) at Apache Point Observatory (APO) in the Northern Hemisphere, and the 2.5 m Irénée du Pont Telescope (Bowen &Vaughan 1973) at Las Campanas Observatory (LCO) in the Southern Hemisphere.The APOGEE survey is an important part of the SDSS-III (Eisenstein et al.2011) and SDSS-IV(Blanton et al.2017)programs.The APOGEE survey is called“APOGEE” or “APOGEE-1” in SDSS-III, and it is called“APOGEE-2” in SDSS-IV.APOGEE-1 started its data collection in 2011 and ended it in 2014.The SDSS DR10 publicly released the APOGEE-1 three-year data set, which was subsequently followed by two additional releases in 2015 and 2016.This accomplishment successfully fulfilled the stated objective of observing over 100,000 stars with a limiting magnitude of H=12.2 mag and spectral signal-tonoise ratio (S/N) greater than 100.APOGEE-2 is a constituent program of the SDSS-IV initiative, which commenced in 2014 and finished in 2021.In addition to collecting the data in the Northern Hemisphere, APOGEE-2 also adopted data from the 2.5 m Irénée du Pont Telescope mounted on LCO to expand the observation sky coverage to the Southern Hemisphere.The recently released SDSS DR17(Abdurro’uf et al.2022) incorporates the latest version of the APOGEE survey,including more than 657,000 stars,and this version is also the final version of all APOGEE-1 and APOGEE-2 data.The measurement of RV has an uncertainty of 100 m s−1and a zero-point offset of 500 m s−1(Nidever et al.2015).Typical uncertainties for Teff,loggand [Fe/H]are better than 150 K, 0.2 dex and 0.1 dex, respectively(Mészáros et al.2013; García Pérez et al.2016).

Figure 2.Hammer projection in R.A.and decl.of the APOGEE RV standard stars.The black line signifies the Galactic plane,on which we mark the positions of the Galactic center(GC)and the Galactic anti-center(GAC).The positions of M31,Large Magellanic Cloud(LMC)and Sagittarius Dwarf Spheroidal Galaxy(Sgr dSph)are also marked.
3.2.Selecting RV Standard Stars from the APOGEE DR17
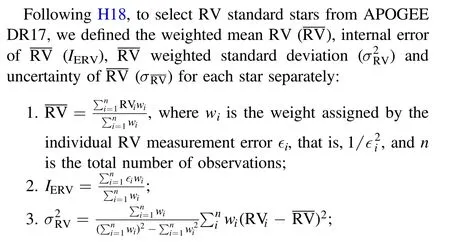
We utilize the symbol ΔT to denote the time baseline and MJD to represent the mean Modified Julian Date of the n observations.In the following step, we select RV standard stars based on the following criteria: ΔT>200 days, n ≥3,S/Nlow≥50 and σRV≤200 m s−1,where S/Nlowrepresents the lowest S/N for the multiple spectroscopic visits to each star.
Through the above cuts, a total of 46,753 APOGEE RV standard stars were selected.The spatial distribution is depicted in Figure 2, with full sky coverage.The distributions of time baseline ΔT, number of observations n and σRVfor these RV standard stars are plotted in Figure 3.Their ΔT are all greater than 200 days(with 54%longer than one year and 10%longer than five years).The average number of observations for these stars is 5.The median σRVof all standard stars is 71.75 m s−1,corresponding to a median stability (3σRV) of 215.25 m s−1,better than 240 m s−1of the H18 sample.We show the color-(absolute) magnitude distributions of these stars, see Figure 4 for H against J −Ks, and Figure 5 for absolute MGagainst GBP−GRP.Due to the selection effect of the APOGEE survey,81% of RV standard stars are redder than 0.5 in terms of J −Ks.Figure 5 contains 30,268 RV standard stars with measurable distances, all of which have been corrected for interstellar extinction using the 2D dust map from Schlegel et al.(1998).We employ the empirical relation MG=3.53×(GBP−GRP)−0.06 to distinguish giants from main sequence dwarf stars (see dashed line).Among them,62%are red giants and 38%are main sequence dwarf stars.We list 46,753 APOGEE RV standard stars including their name,H, J −Ks, Teff,RV (after RVZP correction by Equation (1)),IERV,σRV,n,σRV,ΔT and mean MJD information in Table 1.

Figure 3.The time baseline distribution (left panel), observation number distribution (middle panel) and RV weighted standard deviation (σRV) distribution (right panel) of 46,753 APOGEE RV standard stars.
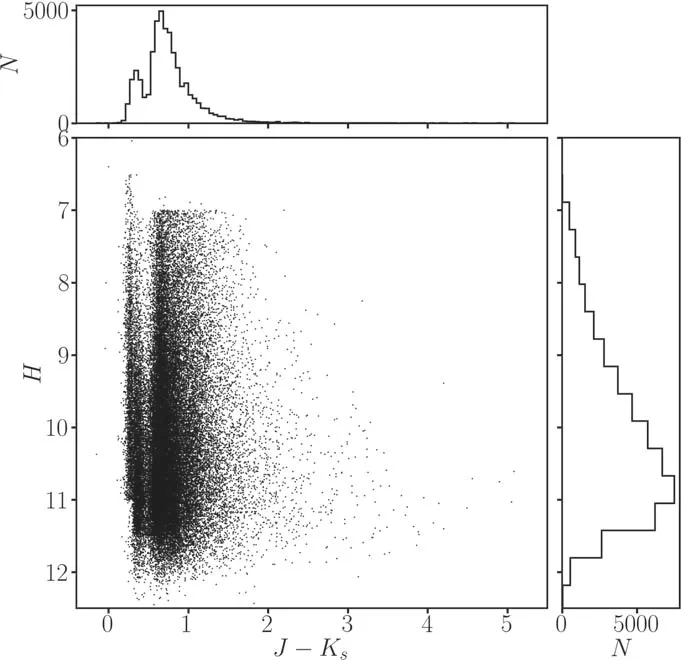
Figure 4.The color J −Ks-magnitude H diagram of APOGEE RV standard stars.The top and right insets are histogram distributions along the J −Ks and H axes, respectively.
4.Calibrations of Radial Velocity Scales for Largescale Stellar Spectroscopic Surveys
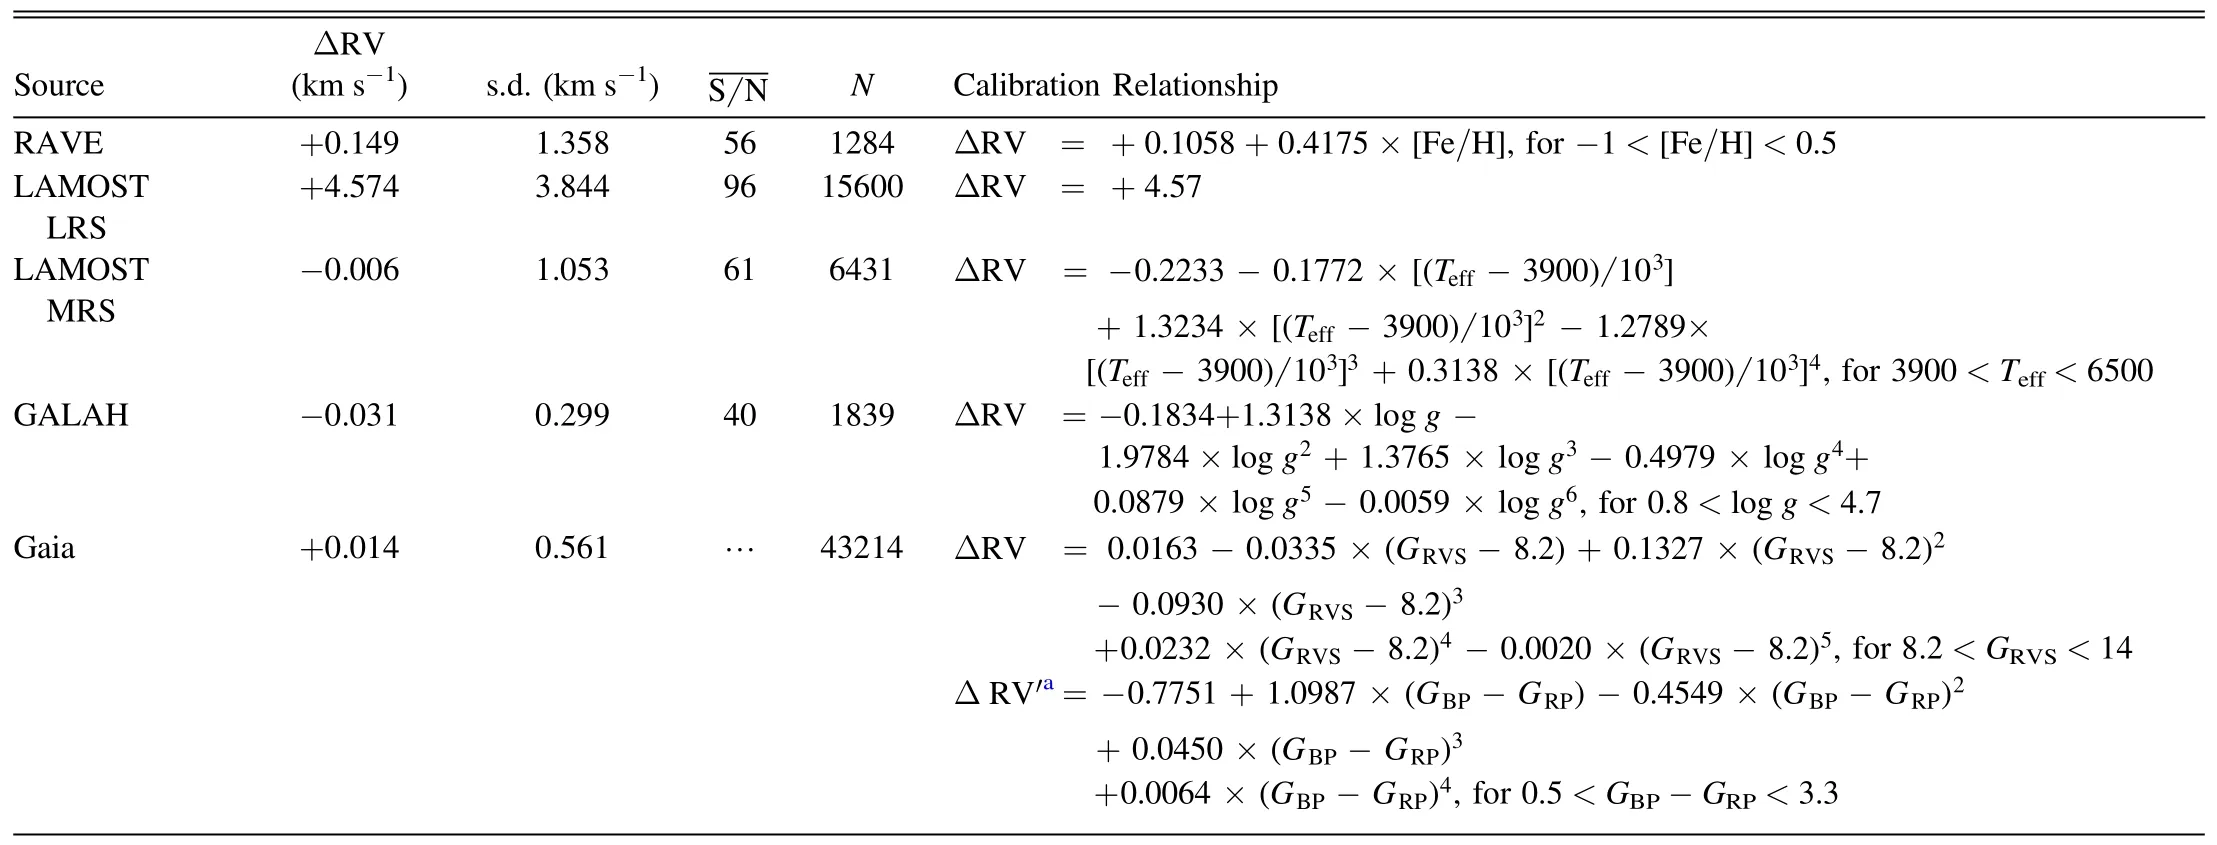
Next, we use these 46,753 APOGEE RV standard stars to check the RVZPs of the RAVE,LAMOST,GALAH and Gaia surveys.The calibration results are shown in Figures 6, 7 and Table 2.
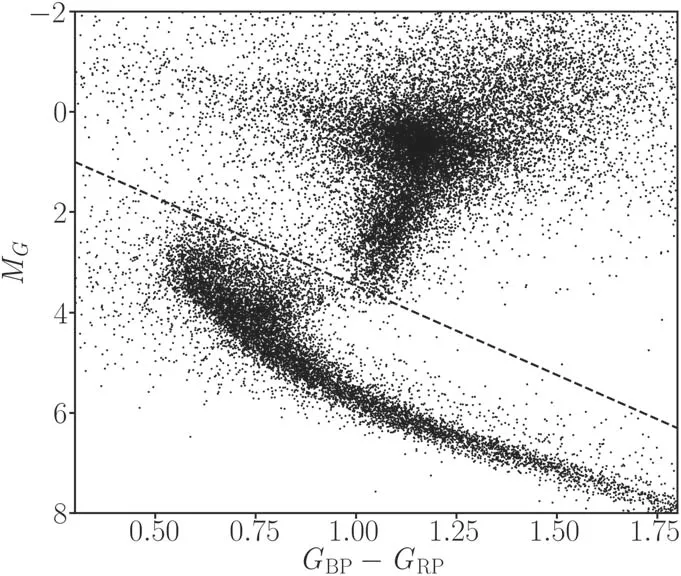
Figure 5.The color GBP −GRP-magnitude MG distribution of APOGEE RV standard stars.The black dashed line is the empirical line to separate giants and main sequence dwarf stars.
(i) The RAVE survey: The RAVE survey has collected 520,781 medium-resolution spectra (MRS, R ∼7500) centered on the Ca I triplet (8410–8795 Å) range.The survey has released 457,588 individual stars randomly selected from the Southern Hemisphere stars with 9 We cross-matched RAVE DR5 with our 46,753 APOGEE RV standard stars, resulting in a total of 1284 common stars with S/N>10.The comparisons show a mean ΔRV(APOGEE RVs minus RAVE) of +0.149 km s−1, with a standard deviation of 1.358 km s−1.We display the systematic trends of ΔRV with Teff, log g, [Fe/H] and S/N in Figure 6.There is no obvious systematic trend of ΔRV with Teff,log g or S/N,however,ΔRV exhibits a weak linear trend with[Fe/H].This trend can be described by ΔRV=0.1058+0.4175×[Fe/H] (see Table 2). (ii)The LAMOST survey:LAMOST is a 4 m quasi-meridian reflecting Schmidt telescope(Cui et al.2012).The telescope is equipped with 4000 fibers distributed in a field of view with a diameter of 5°.Within one exposure, LAMOST can obtain 4000 optical low-resolution spectra (LRS; R ∼2000; with wavelength coverage between 3700 and 9000 Å) or MRS(R ∼7500;with two wavelength windows of 4950–5350 Å and 6300–6800 Å, respectively). The MRS parameter catalog released in LAMOST DR9 contains measurements of stellar atmospheric parameters and RV for over 1.6 million stars from 8 million MRS.To check the RVZPs of the LAMOST MRS RVs, we cross-matched the LAMOST DR9 MRS parameter catalog with the RV standard stars,resulting in 6431 common stars with S/N>10(see Table 2).By comparing their RVs (measurements from LASP) with the standard stars, multiple peaks are found in the RV difference distribution.There are two dominant main peaks,one occurring before 2018 October 19(MJD=58,410)and the other after this date.Prior to 2018 October 19, the mean ΔRV(APOGEE RVs minus LAMOST) was 6.843 km s−1with a standard deviation of 1.202 km s−1, while after that date, the mean ΔRV was 0.727 km s−1with a standard deviation of 1.183 km s−1.The main reason for such a significant transition in mean ΔRV arises from the use of different wavelength calibration lamps.Prior to 2018 October 19, the Sc lamp was employed to calibrate the wavelengths of the LAMOST test observation spectra, whereas the Th–Ar lamp has been used since then (Wang et al.2019; Zhang et al.2021).LAMOST MRS provide zero-point corrected RV measurements, with the aforementioned offsets largely corrected.If considering the formal survey started from 2018 October 19, the offsetcorrected RVs from LAMOST MRS agree very well with those of the APOGEE RV standard stars, with a nil zero-point and a scatter of 1.05 km s−1(see middle panel of Figure 6).However,the mean RV differences still show a systematic trend with Teff(see middle panels of Figure 6).This trend can be described by a fourth-order polynomial in Teff(see Table 2). Figure 6.RV differences of common stars(gray dots)between APOGEE RV standard stars and different surveys(top panel:RAVE;middle two panels: LAMOST LRS and MRS (zero-point corrected RV measurements after 2018 October 19); bottom panel: GALAH) as a function of Teff (first column), log g (second column),[Fe/H](third column)and S/N(fourth column).The black dots and their error bars in each subpanel signify the mean and standard deviation of ΔRV,respectively,in bins of individual parameters(Teff,log g,[Fe/H]and S/N).Blue dashed lines represent the mean difference as shown in Table 2.Red lines trace polynomial fits of the RV difference as functions of stellar parameters (the coefficients are given in Table 2). (iii)The GALAH survey:The GALAH survey is a large-scale stellar spectroscopic survey.The aim is to collect highresolution (R = 28,000) spectra of approximately one million stars in the optical band (four discrete optical wavelength ranges:4713–4903,5648–5873,6478–6737 and 7585–7887 Å)using the HERMES spectrograph installed on the 3.9 m Anglo-Australian Telescope (AAT) at the Siding Spring Observatory(De Silva et al.2015).In the third data release (DR3, Buder et al.2021), GALAH provided a total of 678,423 spectra of 588,571 unique stars, including measurements of RVs, stellar atmospheric parameters and individual element abundances. We cross-matched the APOGEE RV standard stars with GALAH DR3 to examine the RVZP of the GALAH RVs.A total of 1839 common stars with S/N>10 were found, with average S N of 40 (Table 2).The mean value and standard deviation of the ΔRV (APOGEE RVs minus GALAH) are−0.031 km s−1and 0.299 km s−1, respectively.Figure 6(bottom panel) shows the systematic trends of ΔRV with Teff,log g, [Fe/H] and S/N.It can be seen from the plot that ΔRV has no trend with [Fe/H] or S/N.However, ΔRV exhibited a curved trend with both Teffand log g.Through our validation,we find that the systematic trend of GALAH RVs is dominated by log g.The trend can be described by a sixth-order polynomial about log g,the coefficients of which are presented in Table 2. (iv) The Gaia survey: The European Space Agency (ESA)satellite Gaia(Gaia Collaboration et al.2016)recently released the DR3 (Gaia Collaboration et al.2022), which provides astrometric and photometric data for more than 1.8 billion sources.Compared with Gaia DR2, Gaia DR3 provides more than 33 million stars with measurements of RV (Katz et al.2022) and more than 470 million stars with measurements of atmospheric parameters (Fouesneau et al.2022).The median value of RV measurement accuracy is 1.3 km s−1at GRVS=12 mag and 6.4 km s−1at GRVS=14 mag.The RVZP of the Gaia DR2 has a systematic trend with GRVS, which shows ΔRV=0 km s−1at GRVS=11 mag and ΔRV=0.40 km s−1at GRVS=14 mag (Huang et al.2018; Katz et al.2022). Figure 7.Top panel: Similar to Figure 6, but this figure presents common stars between APOGEE RV standard stars and Gaia DR3, subplots of which show a systematic trend of ΔRV with GRVS(left),GBP −GRP(middle)and Nobs(right).Red lines trace polynomial fits of ΔRV with GRVS or GBP −GRP,and the coefficients are listed in Table 2.ΔRV′ in the middle panel signifies the RV differences after the corrections to GRVS dependent systematics.Cyan line is a second-order polynomial taken from Katz et al.(2022)to describe the systematic trend of ΔRV with GRVS when GRVS>11 mag.Bottom panel:The RV precision of Gaia DR3,as a function of GRVS,is reported through comparison with APOGEE RV standard stars,corresponding to metal-rich stars([Fe/H]≥−0.1,left),middle-level metallicity stars (−0.4 ≤[Fe/H] <−0.1, middle) and relatively metal-poor stars ([Fe/H] <−0.4, right).The different colored curves are calculated for each effective temperature range of the APOGEE RV standard stars as labeled in the top-left corner on each panel. Table 2 Comparisons of RVs yielded by the APOGEE RV Standard Stars and RAVE, LAMOST, GALAH and Gaia Surveys To check the RVZP of the Gaia DR3,we cross-matched our APOGEE RV standard stars with Gaia DR3 to obtain 43,214 common stars with 3200 K Based on the common stars of our APOGEE RV standard star and Gaia DR3, we study the precision of Gaia RV measurements.As displayed in the bottom panels of Figure 7,the precision of Gaia RV measurement generally decreases with Teffand GRVSand slightly increases with[Fe/H].The RV precision in the bright range (GRVS<10 mag) is several hundred m s−1, and is a few km s−1at the faint end (GRVS>12 mag).This result is consistent with the prediction of Katz et al.(2022). We have constructed a catalog of 46,753 RV standard stars from the 657,000 near-infrared (H-band; 1.51–1.70 μm) highresolution (R ∼22,500) spectra provided by APOGEE DR17.They are almost evenly distributed in the Northern and Southern Hemispheres, with 62% red giants, and 38% main sequence dwarf stars.They were observed with a time baseline of at least 200 days (with 54% longer than one year and 10%longer than five years) and were observed more than three times.The median RV stability was 215.25 m s−1.Using the catalog of RV standard stars, we calibrated the RVZPs of four large-scale stellar spectroscopic surveys: RAVE, LAMOST,GALAH and Gaia.By careful comparisons,we found the mean RVZPs are +0.149 km s−1, +4.574 km s−1(for LRS),−0.031 km s−1and +0.014 km s−1, for RAVE, LAMOST,GALAH and Gaia, respectively.In addition to an overall constant offset,RVZPs of part of these surveys show moderate dependences on stellar parameters (e.g., Teff, log g, [Fe/H],color or magnitude).We further provide corrections by simple polynomial fits with coefficients listed in Table 2.Our studies demonstrate that the small but clear RVZPs in these large-scale spectroscopic surveys can be well detected and properly corrected by our RV standard stars, which are believed to be useful for their further applications in various investigations.The complete APOGEE RV standard star catalog in Table 1 is publicly available at https://nadc.china-vo.org/res/r101244/. Acknowledgments This work is supported by National Key R & D Program of China No.2019YFA0405102, 2019YFA0405500, and National Natural Science Foundation of China (NSFC, Grant Nos.11903027, 11973001, 11833006, U1731108, 12090040 and 12090044). Funding for the Sloan Digital Sky Survey IV has been provided by the Alfred P.Sloan Foundation, the U.S.Department of Energy Office of Science, and the Participating Institutions.SDSS acknowledges support and resources from the Center for High-Performance Computing at the University of Utah.The SDSS website is www.sdss.org. Software:astropy(Astropy Collaboration et al.2013,2018),TOPCAT (Taylor 2005). ORCID iDs Qing-Zheng Li https://orcid.org/0000-0002-4033-2208 Yang Huang https://orcid.org/0000-0003-3250-2876 Xiao-Bo Dong https://orcid.org/0000-0002-2449-9550 Jian-Jun Chen https://orcid.org/0000-0003-4525-1287 A-Li Luo https://orcid.org/0000-0001-7865-2648


5.Summary
 Research in Astronomy and Astrophysics2023年11期
- Research in Astronomy and Astrophysics的其它文章
- Photometric and Spectroscopic Study of Two Low Mass Ratio Contact Binary Systems: CRTS J225828.7-121122 and CRTSJ030053.5+230139
- Injection Spectra of Different Species of Cosmic Rays from AMS-02, ACECRIS and Voyager-1
- The AIMS Site Survey
- A High-Temperature Superconducting Wideband Bandpass Filter at the L Band for Radio Astronomy
- Modified Masses and Parallaxes of Close Binary Systems: HD 39438
- Detecting HI Galaxies with Deep Neural Networks in the Presence of Radio Frequency Interference
