GRB 220408B: A Three-episode Burst from a Precessing Jet
Zijian Zhang , Yi-Han Iris Yin,2 , Chenyu Wang, Xiangyu Ivy Wang,4, Jun Yang,4, Yan-Zhi Meng,4, Zi-Ke Liu,4,Guo-Yin Chen,4, Xiaoping Fu, Huaizhong Gao, Sihao Li, Yihui Liu, Xiangyun Long, Yong-Chang Ma, Xiaofan Pan,0,Yuanze Sun, Wei Wu, Zirui Yang,0, Zhizhen Ye, Xiaoyu Yu2, Shuheng Zhao, Xutao Zheng,0, Tao Zhou,Qing-Wen Tang4, Qiurong Yan, Rong Zhou, Zhonghai Wang, Hua Feng, Ming Zeng,0, and Bin-Bin Zhang,4,
1 School of Astronomy and Space Science, Nanjing University, Nanjing 210093, China; bbzhang@nju.edu.cn
2 School of Physics, Nanjing University, Nanjing 210093, China
3 Department of Astronomy, Tsinghua University, Beijing 100084, China; hfeng@tsinghua.edu.cn
4 Key Laboratory of Modern Astronomy and Astrophysics, Nanjing University, Ministry of Education, Nanjing 210093, China
5 School of Information Engineering, Nanchang University, Nanchang 330031, China
6 Department of Engineering Physics, Tsinghua University, Beijing 100084, China
7 Department of Health Physics, China Institute for Radiation Protection, Taiyuan 300000, China
8 Key Laboratory of Radiation Physics and Technology of Ministry of Education, College of Physics of Sichuan University, Chengdu 610065, China
9 School of Artificial Intelligence, Nanjing University, Nanjing 210093, China
10 Key Laboratory of Particle and Radiation Imaging, Tsinghua University, Ministry of Education, Beijing 100084, China; zengming@tsinghua.edu.cn
11 Department of Computer Science and Technology, Nanjing University, Nanjing 210093, China
12 School of Chemistry and Chemical Engineering, Nanjing University, Nanjing 210093, China
13 College of Engineering and Applied Sciences, Nanjing University, Nanjing 210093, China
14 Department of Physics, School of Physics and Materials Science, Nanchang University, Nanchang 330031, China
15 Purple Mountain Observatory, Chinese Academy of Sciences, Nanjing 210023, China
Abstract Jet precession has previously been proposed to explain the apparently repeating features in the light curves of a few gamma-ray bursts (GRBs).In this paper, we further apply the precession model to a bright GRB 220408B by examining both its temporal and spectral consistency with the predictions of the model.As one of the recently confirmed GRBs observed by our GRID CubeSat mission, GRB 220408B is noteworthy as it exhibits three apparently similar emission episodes.Furthermore, the similarities are reinforced by their strong temporal correlations and similar features in terms of spectral evolution and spectral lags.Our analysis demonstrates that these features can be well explained by the modulated emission of a Fast-Rise-Exponential-Decay (FRED) shape light curve intrinsically produced by a precessing jet with a precession period of18.4 s, a nutation period ofs and viewed off-axis.This study provides a straightforward explanation for the complex yet similar multiepisode GRB light curves.
Key words: gamma-rays: general – (stars:) gamma-ray burst: individual (GRB 220408B) – stars: jets
1.Introduction
Regardless of its different types of origin, which can be either the collapse of a massive star(Paczynski 1986;Woosley 1993; Woosley & Bloom 2006) or the merger of binary compact stars (Eichler et al.1989), a gamma-ray burst (GRB)central engine is believed to resemble the same accretion system which consists of a central object,an accretion disk,and a relativistic jet.In particular, if the central object is a black hole(BH),the angular momentum direction of the BH and the accretion disk can differ due to the anisotropic explosions of its progenitor star.As the outer part of the disk has a sufficiently larger angular momentum, it will maintain its direction and drive the BH and the inner part of the accretion disk to precess due to the Lense-Thirring torque and the viscosity of the disk(Lense & Thirring 1918; Bardeen & Petterson 1975).The jet launched from the inner region of the disk will follow the rotating black hole to precess (e.g., Reynoso et al.2006; Liu et al.2010; Lei et al.2012).Such precession can naturally cause the change of observer angle (calculated with respect to the moving direction of the ejected material, see Section 3.1).In some cases, when the precession period is shorter than the burst duration, and the jet’s opening angle is small enough,precession can affect the observed light curve by introducing periodic-like or missing emissions.Several previous attempts(e.g., Lei et al.2007; Liu et al.2010) have been made to correlate those features with observations.
In light of previous studies, we sought to find additional GRBs that display those characteristics that may be attributed to precession.GRB 220408B, a recent burst co-detected by Fermi (Bissaldi et al.2022), Konus-Wind (Lysenko et al.2022),Astro-Sat (Gopalakrishnan et al.2022),and GRID (this work), quickly caught our attention due to its multiple similar temporal episodes.In this paper, we first performed a detailed analysis of GRB 220408B from the perspective of its light curve properties and spectral evolution (Section 2).Motivated by the similarities of the three episodes in light curve profile,spectral evolution, and spectral lags, we proposed to use a precession-nutation model to explain the observed properties of GRB 220408B (Section 3).The summary and discussion are presented in Section 4.
2.Observation and Data Analysis
2.1.The Data
GRB 220408B triggered the Gamma-ray Burst Monitor(GBM) aboard the NASA Fermi Gamma-ray Space Telescope(Meegan et al.2009) at 07:28:04.65 universal Time on 8 Apr 2022 (hereafter T0,GBM).It is also the third confirmed GRB observed by GRID (short for Gamma-Ray Integrated Detectors), a low-cost project led by students aiming to build an all-sky and full-time CubeSat network to monitor highenergy transient sources, including GRBs, in low Earth orbits(Wen et al.2019, 2021).To date, GRID has collected several confirmed GRBs as well as dozens of GRB candidates, of which the first is GRB 210 121A (Wang et al.2021).In this work, we mostly utilize the Fermi/GBM data in consideration of its wide spectral coverage and high temporal and spectral resolution.As a result of a large separation angle (≫60°)between the pointing direction of the detector and the GRB location, the GRID data of GRB 220408B suffer from low signal-to-noise ratio16(S/N) and,therefore, are only displayed in the top panel of Figure 1 as an illustration.
We retrieved the time-tagged event (TTE) data set of GRB 220408B from the Fermi/GBM public data archive.17Two sodium iodide (NaI) detectors, namely n6 and n7, with the smallest viewing angles with respect to the GRB source direction, were selected for our analysis.Additionally, the brightest bismuth germanium oxide (BGO) detector, b1, was also selected as it extends to a higher energy range.These data were then processed according to the standard procedures described in Zhang et al.(2011) and Yang et al.(2022) to investigate the burst’s temporal and spectral properties, as detailed below.

2.2.The Three-episode Light Curve
We plot the GBM and GRID light curves together in Figure 1, using the same bin size of 0.325 s and the same alignment time,T0,at T0,GBM.While both light curves are extracted from the same 15–350 keV energy range, the S/N of the brightest peak of the GRID light curve is about one-fifth of that of the GBM light curve due to the former’s large off-axis angle.Nevertheless,the majority of the significant peaks on both light curves coincide, which reinforce the usefulness of CubeSat detectors for GRB research, even in non-ideal observational conditions.
GRB 220408B exhibits an overall Fast-Rise-Exponential-Decay (FRED; Kocevski et al.2003) profile while retaining a complex substructure characterized by three apparently separated emission episodes.Following the method in Yang et al.(2020a)and Yang et al.(2020b),the burst duration in the standard energy range of 15–350 keV is calculated as T90,15–350keV∼30 s (see also Bissaldi et al.2022), counted from T0+1.5 s to T0+31.5 s.Such a T90range,however,does not cover the third episode, which starts at around T0+55 s.

Figure 2.(a)Light curve profiles of the three episodes are aligned according to the middle peak positions within red vertical dashed lines.Matched peaks are marked with green vertical dashed lines.(b)The correlation between Episode II and Episode I is delineated in orange,and the correlation between Episode II and Episode III is delineated in purple.The shaded areas represent the corresponding 3σ uncertainties.
We noticed that the third emission episode becomes particularly significant in low energies, as shown in the third panel of Figures 1 and 3, indicating a strong spectral evolution across the three episodes.We were thus motivated to recalculate the burst’s T90in a lower energy range between 10 and 25 keV to be 62.5 s (see the bottom panel of Figure 1), which more accurately conveys the burst timescale and the central engine activities (Zhang et al.2014).Such an energy range is also utilized in dividing the burst into three episodes with a visual aid of the pulse structures,as colored in the third panel of Figure 1.
Interestingly, the three emission episodes display striking similarities with each other in terms of duration,pulse structure,and spectral evolution.A more comprehensive analysis of that focus will be conducted in the rest of this section.
2.3.Similarity in Overall Temporal Profile
The similarity of the light curve profiles is illustrated in Figure 2(a), where the light curves18Those light curves are extracted in the energy range of 10–100 keV to improve S/N and binned to 0.1 s to increase the visibility of the detailed structures.of the three episodes are first aligned according to the middle peak positions(red vertical dashed lines).Interestingly, such an alignment automatically results in several other peaks matching along (green vertical dashed lines).
To further quantify the similarity, we calculated the correlation coefficients between any pair of the three light curves in Figure 2(b).The Pearson correlation coefficient is 0.68 with a p-value of 7.60×10⁻³¹between Episode I and Episode II,and is 0.42 with a p-value of 1.15×10⁻¹⁰between Episode II and Episode III.The strong correlations among the three episodes indicate that they may have the same physical origin, which could account for their similar shapes.
2.4.Similarity in Multi-wavelength Behaviors
We then divided the energy range between 10 and 800 keV into eight bands and extracted multi-wavelength light curves from Fermi/GBM NaI detectors n6, n7 and BGO detector b1 using the method described in Liu et al.(2022).As shown in Figure 3, the profiles of the multi-wavelength light curves,including their characteristics,such as the peak time and width of the pulses, clearly evolve in accordance with increasing energy.Such an evolution is commonly observed in GRBs and often measured as a spectral lag, which refers to the delay of the arrival time of gamma-ray photons in different energy bands (e.g., Norris et al.2000; Yi et al.2006).Both positive(i.e.,higher-energy photons arrive earlier)and negative lags,as episodes, which further confirms the similarity of the three emission episodes.
2.5.Similarity in Spectral Evolution
We performed both time-integrated and time-resolved spectral analyses over the periods of Episodes I, II, and III,respectively.Our time-resolved spectral analysis seeks to track the spectral evolution in as much detail as possible.To do so,we divided the burst duration into 37 time-resolved slices (see Figure 5 and Table 1),each containing sufficient photon counts(i.e., 20 counts per spectral bin; Zhang et al.2018) to ensure statistical validity.Within each slice, we extracted the count spectra of GRB 220408B from Fermi/GBM NaI detectors n6,n7 and BGO detector b1 following the procedures described in Zhang et al.(2011);Yang et al.(2020a,2020b,2022)and Zou et al.(2021).Corresponding background spectra are acquired by applying the baseline method(Yang et al.2020a;Zou et al.2021)to the time interval from T0-98 s to T0+134 s for each energy channel.The response matrices of the detectors are generated using the GBM Response Generator.19https://fermi.gsfc.nasa.gov/ssc/data/analysis/rmfit/gbmrsp-2.0.10.tar.bz2
For each slice, as well as each episode, we performed a spectral fit using the Monte Carlo fitting tool MySpecFit(Yang et al.2022).All the spectra are fitted by a cutoff power-law(CPL) model formulated as (Yu et al.2016)well as the positive-to-negative lag transitions (e.g., Wei et al.2017; Du et al.2021; Liu et al.2022), have been observed in some GRBs.
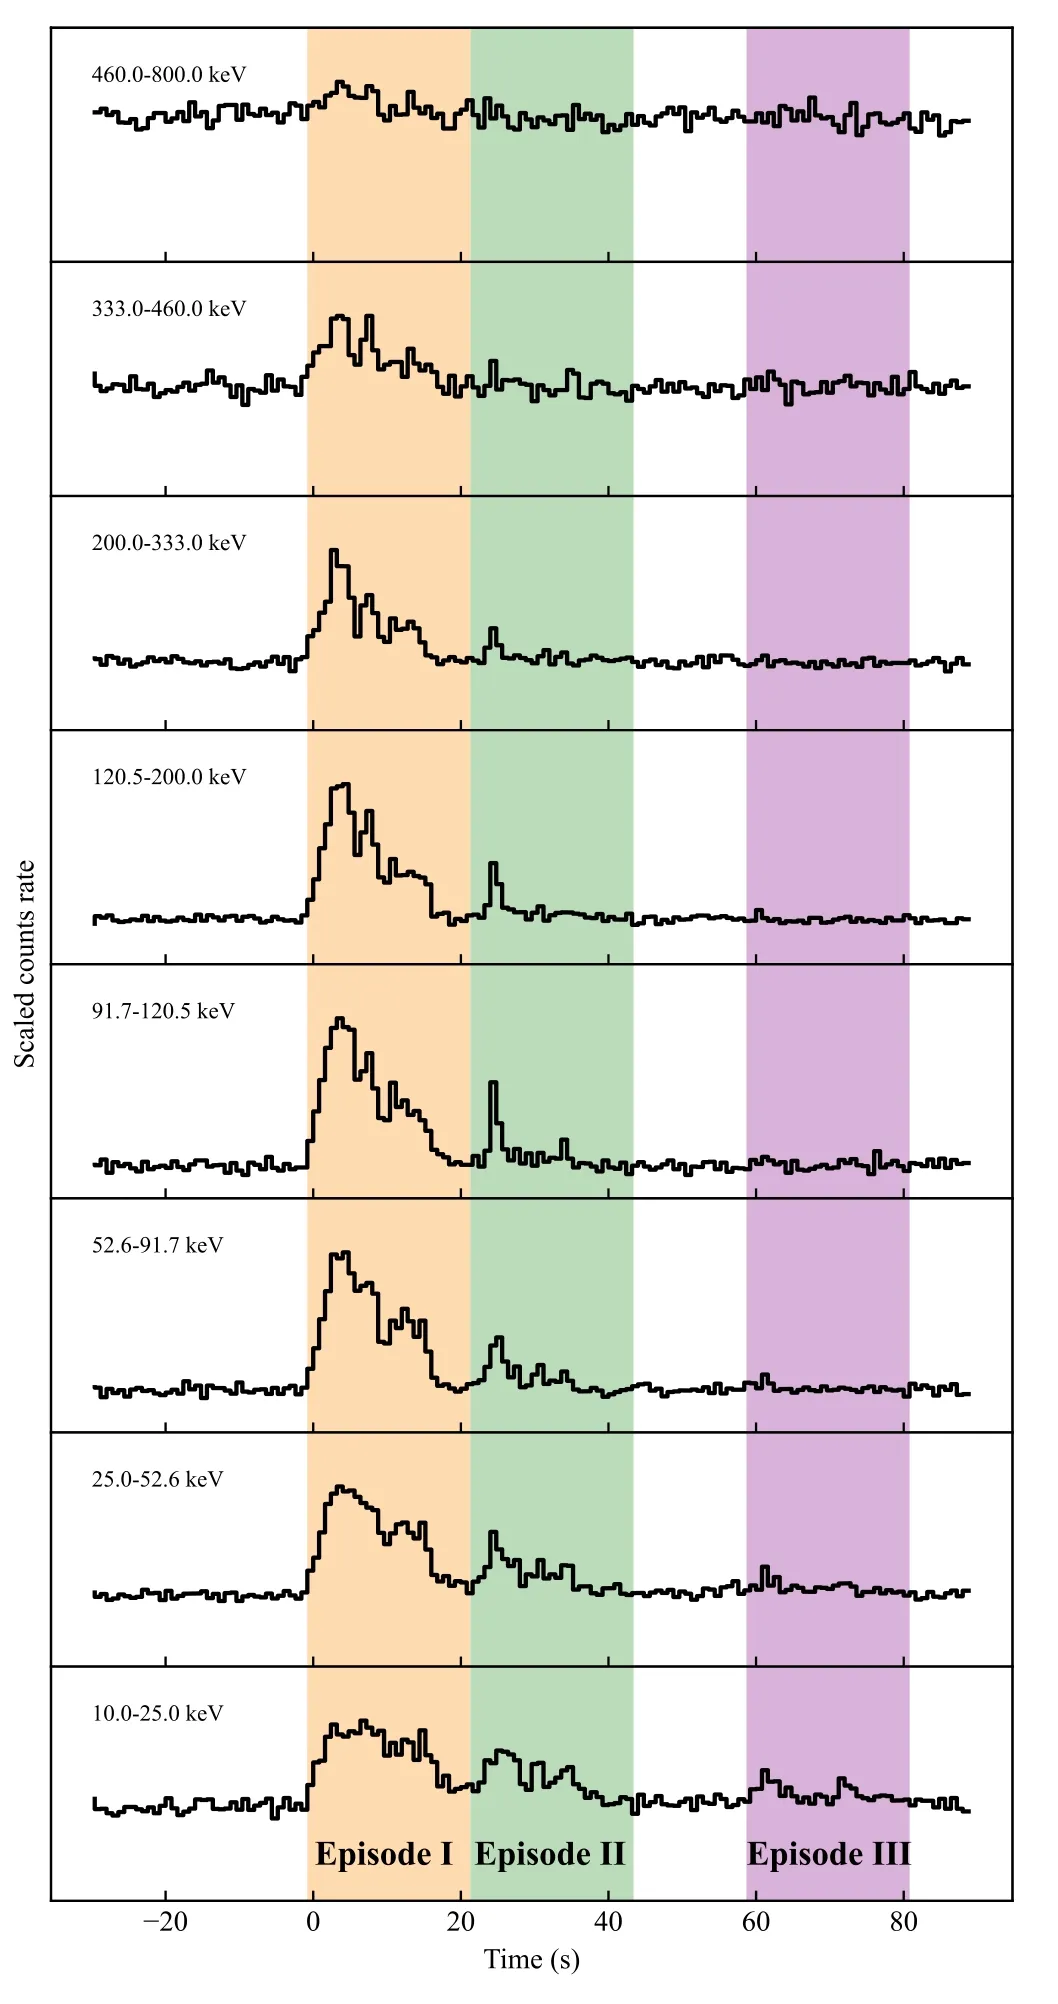
Figure 3.The multi-wavelength light curves of GRB 220408B.The orange,green, and purple blocks mark Episode I, Episode II, and Episode III,respectively.
Following the method described in Zhang et al.(2012) and Liu et al.(2022), we calculated the energy-dependent lags for all three episodes using the multi-wavelength light curve pairs in Figure 3.The results are shown in Figure 4.Interestingly, a positive-to-negative transition feature, with a roughly consistent trend, is observed in the lag-E relations in all three
where α, A, and Epare the photon index, normalization coefficient, and peak energy, respectively.
The results of our spectral fitting are presented in Table 1.Based on the ratio of Profile Gaussian likelihood to the degree of freedom(PGSTAT/dof;Arnaud 1996)statistics, our results indicate that the CPL model can adequately fit the spectra of the three episodes and time-resolved slices.Using the best-fit parameters of the CPL model,we plot the spectral evolution of GRB 220408B in Figure 5, along with the total light curve summing up the GBM detectors n6,n7,and b1 between 10 and 1000 keV.Both α and Epexhibit strong spectral evolution,roughly consistent with the tracking behaviors as observed in other GRBs (e.g., Lu et al.2012).transition, which is typically attributed to GRB central engine characteristics (e.g., Zhang et al.2018).
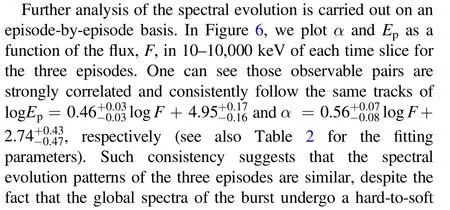
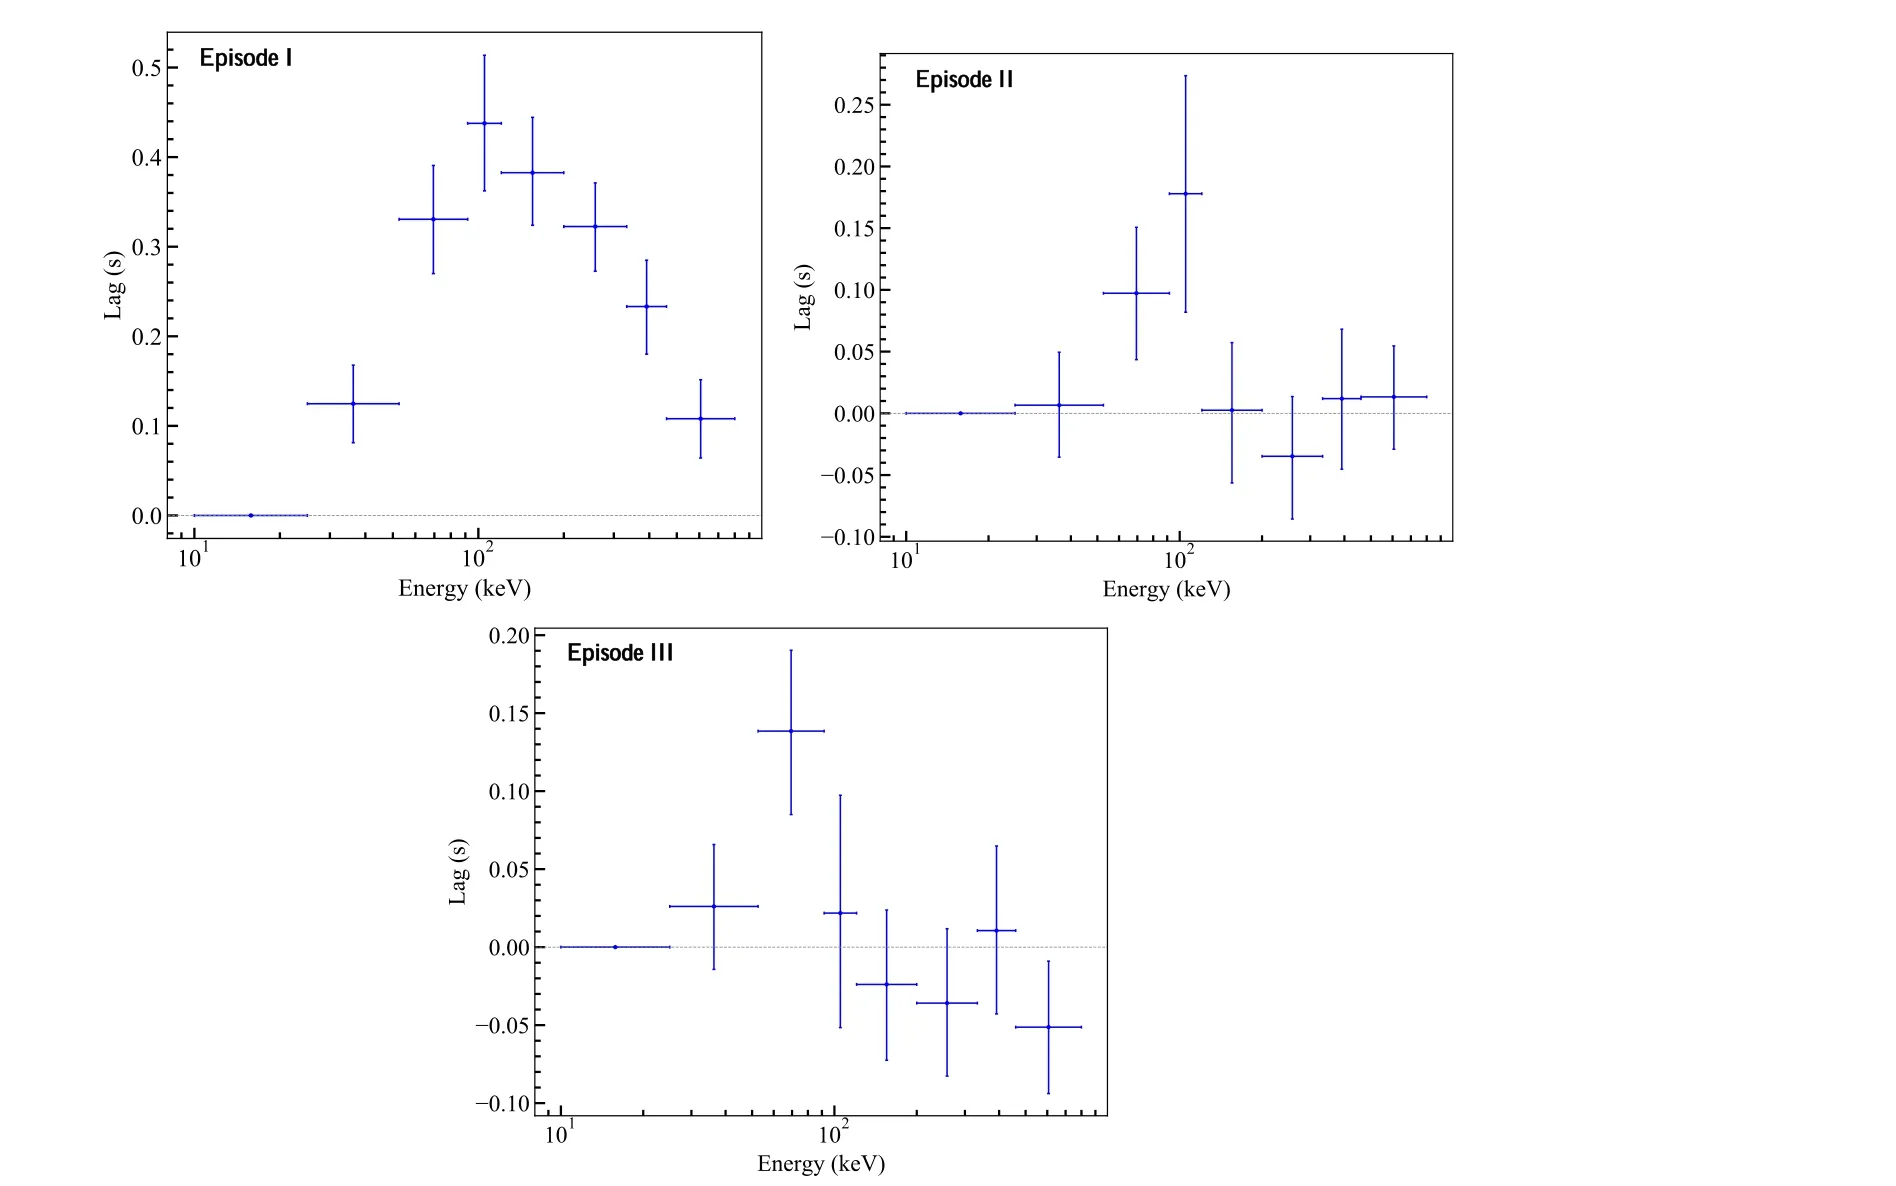
Figure 4.Spectral lags between the lowest energy band(10–25 keV) and any higher energy bands of the three episodes(Episodes I to III from top to bottom).The zero lag is shown with a dashed gray line.The horizontal error bars represent the range of energy bands, and the vertical error bars indicate the 1σ uncertainties.
3.Model and Fit
The similarities of the three emission episodes,as well as the overall FRED shape profile, appear to point toward a uniform origin that produces the observed gamma-ray emissions in a repeatable manner.A natural explanation for such features is that the GRB jet may precess while propagating outward from the central engine(Portegies Zwart et al.1999;Lei et al.2007;Liu et al.2010).In this section, we further test this hypothesis by quantitatively fitting the observed data with a precession model.In addition to the precession itself, our toy model also considers that the nutation (Portegies Zwart et al.1999) of the jet can contribute to the substructure of the light curves.
3.1.The Precession–Nutation Model
Considering the precession and nutation of a GRB jet, the observer angle, θ, defined as the angle between the jet propagating direction and line of sight (LOS), varies as a function of time.A GRB can be significantly observed only when θ is less than the jet’s half-opening angle.The periodic change of θ may cause the jet to sweep across the LOS intermittently, which, when taking into account the intrinsic emission profiles together,can lead to complex shapes of GRB light curves, sometimes with repeating (Portegies Zwart et al.1999;Lei et al.2007)and emission-missing(Wang et al.2022)features.
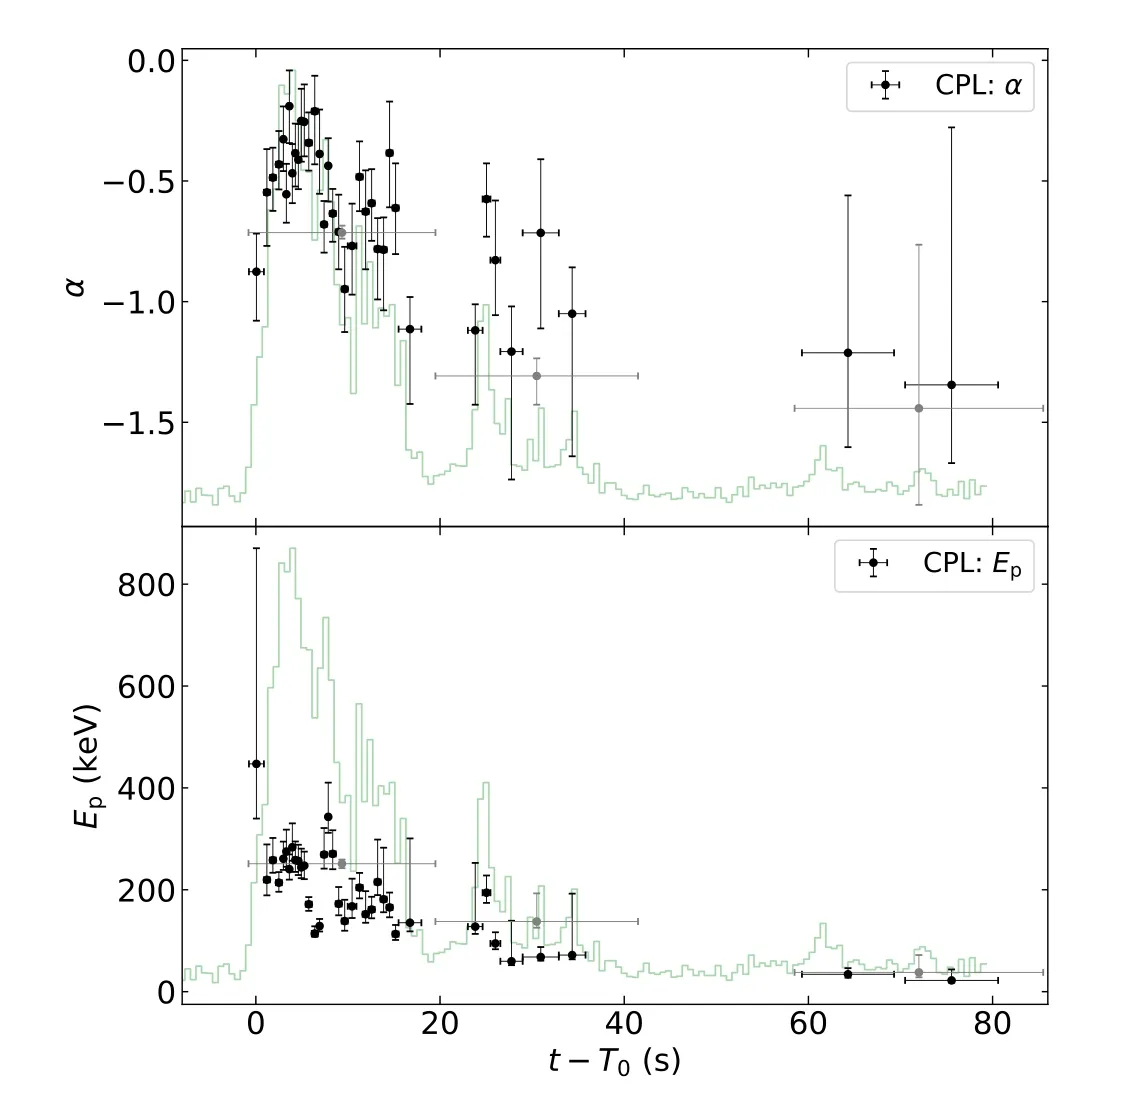
Figure 5.The spectral evolution of the CPL model.The horizontal error bars represent the time spans,and the vertical error bars indicate the 1σ uncertainties of the best-fit parameters.

Table 1 The Spectral Fitting Results and Corresponding Energy Flux of GRB 220408B
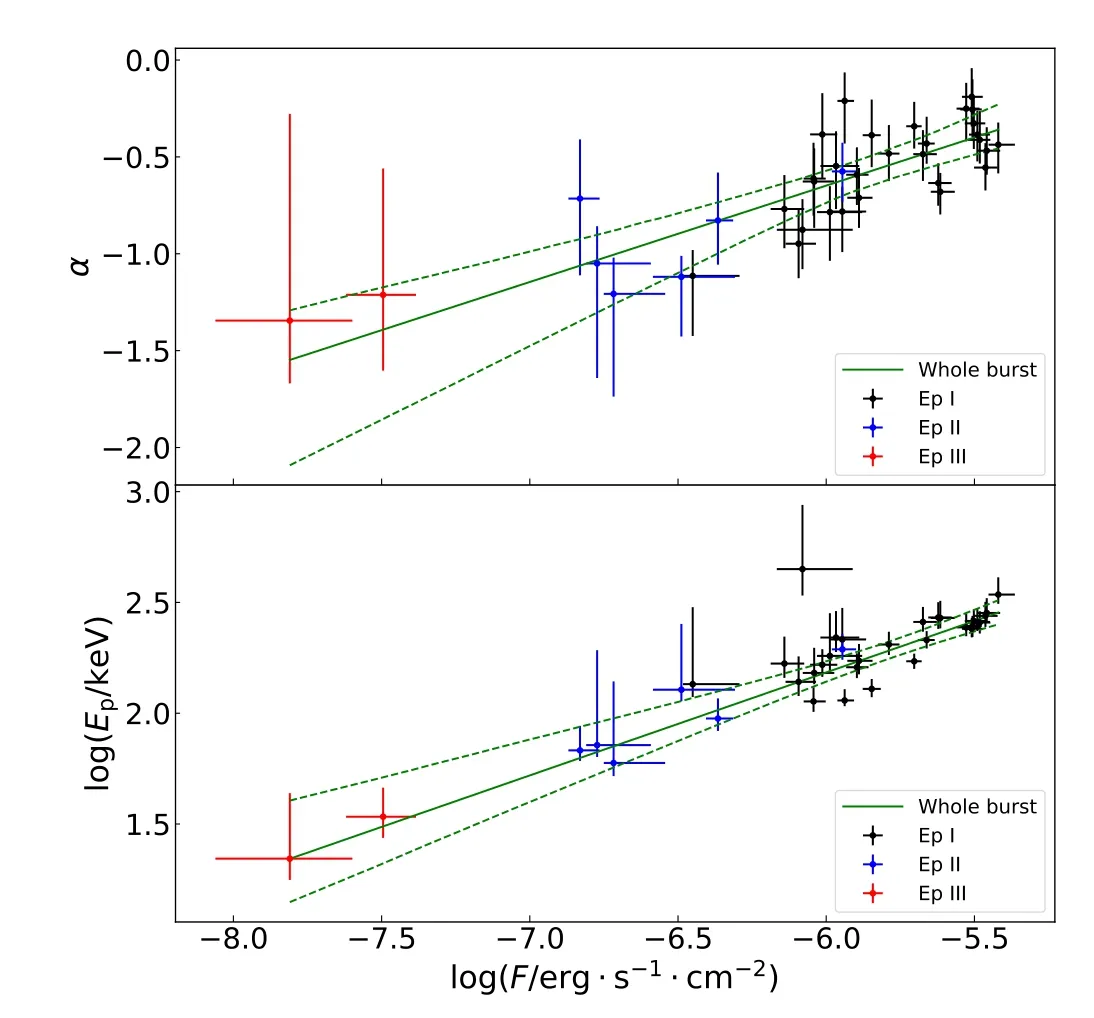
Figure 6.The linear fits to log Ep – logF and α–log Frelations.The solid green lines and dashed green lines show the best-fit relations and the corresponding 3σ error bands of the whole burst,respectively.The black,blue,and red points are the parameters of Episode I, Episode II, and Episode III,respectively.The error bars indicate the corresponding 1σ uncertainties of the parameters.
Our model is illustrated in Figure 7.A GRB jet with a halfopening angle,θjet,is propagating along its direction of ˆrjet.An observer resides within the θjet-cone with an off-axis angle, θ,with respect to ˆrjet.The jet precesses with an angular velocity ofωprealong the z-axis while its rotating axis is nutating with an angular velocity of ωnu.The x-y plane is set accordingly so the Cartesian coordinate is centered at the GRB central engine.We also assumed that the intrinsic emission from the jet is shaped as a FRED function (Kocevski et al.2003), namely,
where t is measured in the laboratory frame (the jet’s local frame),tmis the time when the flux reaches the peak,Fmis the peak flux,r and d are the power-law exponents for the rise and decay, respectively.
We then derived the observed flux of our model based on the above configuration.The direct effect brought by precession and nutation is the change of θ as a function of time,which can be calculated as
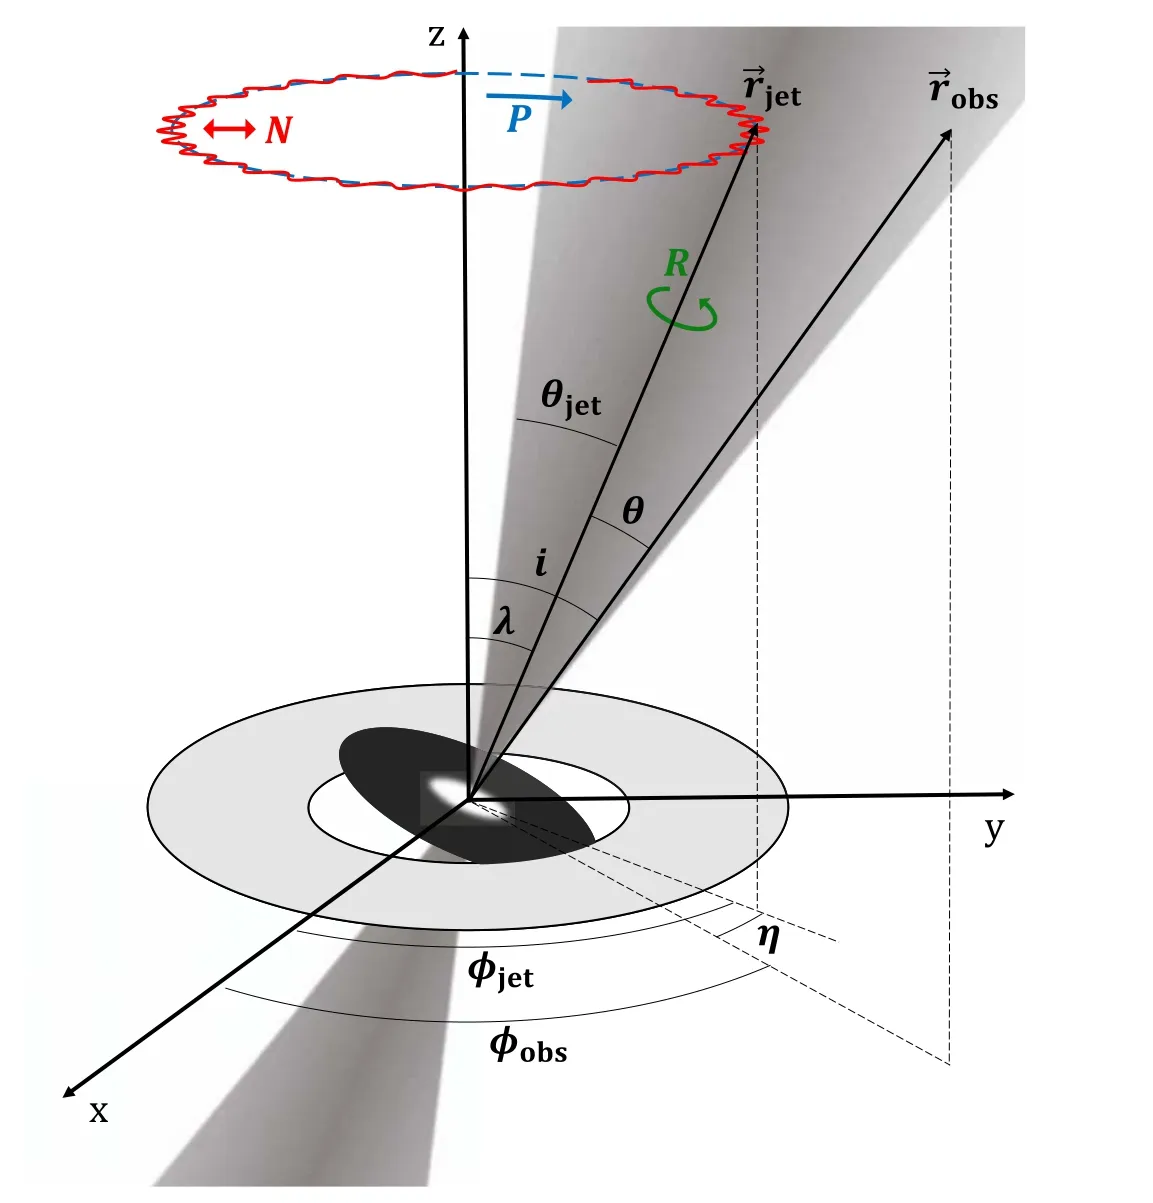
Figure 7.The schematic sketch of the precession-nutation jet model.

The increasing time intervals between the three episodes may be due to the slowing down of jet precession, which is a natural outcome of energy dissipation.We thus assumed a power-law decay of the precession angular velocity aswhere ξ is the decay index, t0is the offset time when the jet begins to precess, tCis a characteristic timescale.

Table 2 The Best-Fit Parameters of Linear Models for α–log F, log Ep – log F, and log Ep –αCorrelations
We assumed a conical jet with a half-opening angle of θjetand no moving material outside the cone.According to the derivation in Salafia et al.(2016),the observed GRB flux M(t,θ(t)) at viewing angle θ(t) in the laboratory frame can be described by
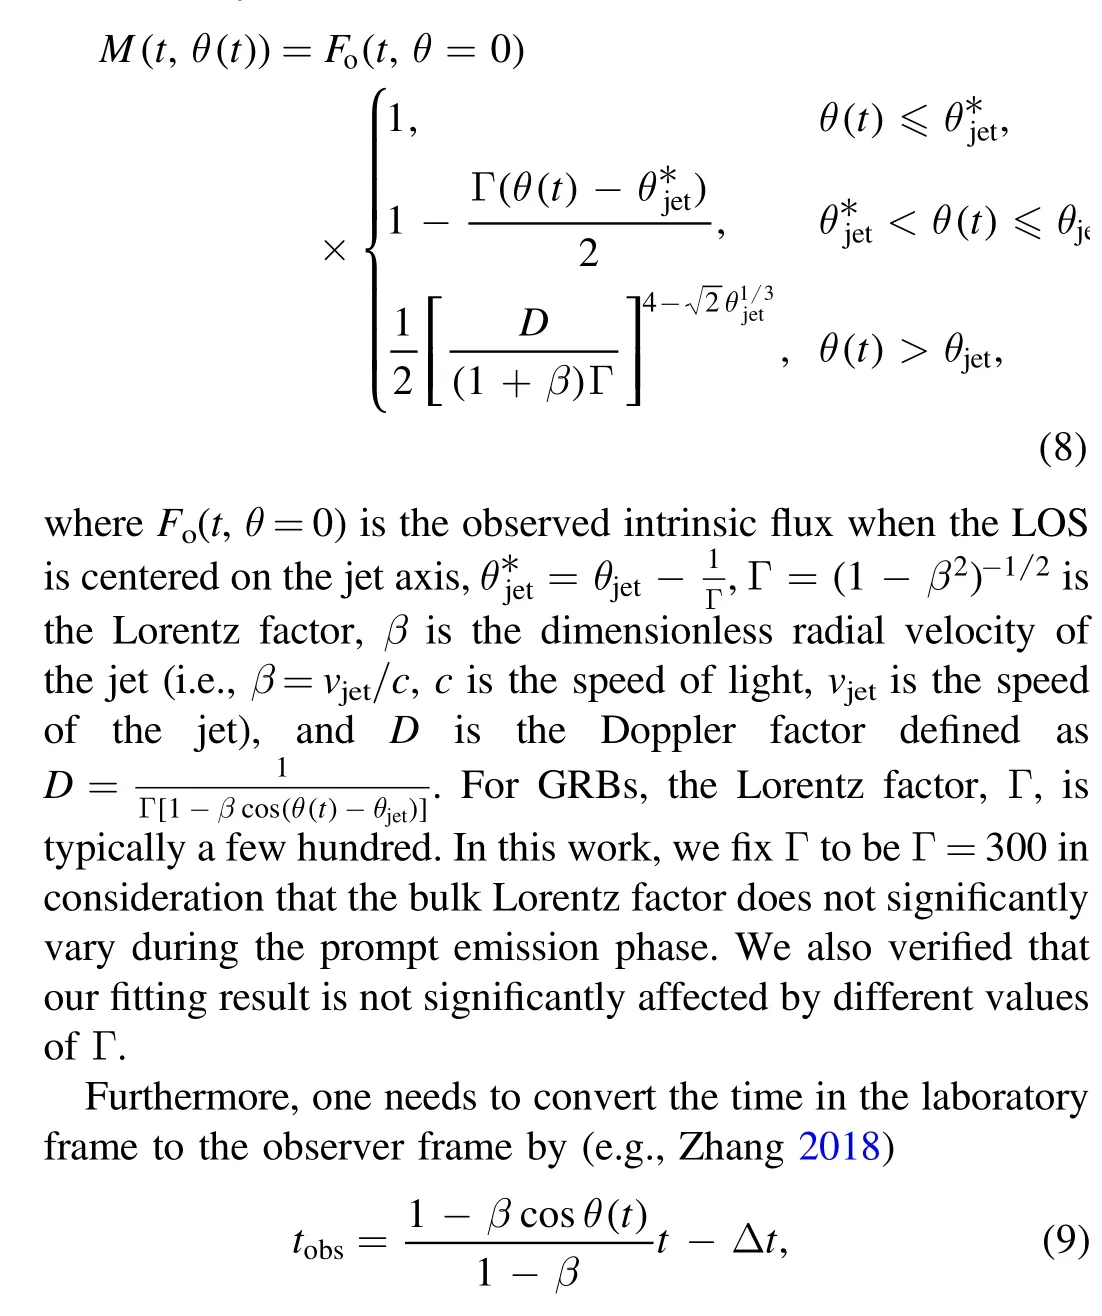
where Δt is a parameter for adjusting the time offset of the model light curve.
Finally, the observed flux can be calculated by substituting Equations (2)–(7) and Equation (9) to Equation (8), which can be written in form of

3.2.The Fit
The next step is to fit our model (Equation (10)) to the observed light curve.With a fixed parameter of Γ=300, the free parameter set P of our model consists of the following 14 items:
1.The jet’s half-opening angle θjet.According to Ryan et al.(2015), the maximum of θjetis smaller than 0.5 radians.Thus the prior of θjetis set as a uniform distribution between 0 and 0.5 radians.
2.The initial precession angle λ0.The prior of λ0is set as a uniform distribution between 0 and π/2 radians.
3.The observer’s polar angle i.The prior of i is set as a uniform distribution between 0 and π/2 radians.
4.The initial phase η0.The prior of η0is set as a uniform distribution between -π and π radians.
5.The initial precession angular velocityωpre,0.As there are at least two precession periods within the ∼70 s duration of the burst, the prior ofωpre,0is set as a uniform distribution between 0.18 and 1 rad s-1.Such a range can account for the decrease ofωpre.
6.The nutation angular velocity ωnu.The prior of ωnuis set as a uniform distribution between 0.18 and 2.5 rad s-1.
7.The precession angular velocity decay index ξ.The prior of ξ is set as a uniform distribution between 0 and 0.5.
8.The offset time t0of precession angular velocity decay.The prior of t0is set as a uniform distribution between-50 and 10 s.
9.The characteristic timescale tCof precession angular velocity decay.The prior of tCis set as a uniform distribution between 0 and 15 s.
10.The peak time tmof the intrinsic FRED profile.The prior of tmis set as a uniform distribution between 0 and 10 s.11.The rise power-law exponent r of the intrinsic FRED profile.The prior of r is set as a uniform distribution between 0.3 and 5.
12.The decay power-law exponent d of the intrinsic FRED profile.The prior of d is set as a uniform distribution between 0.3 and 5.
13.The peak flux Fmof the intrinsic FRED profile.The prior of Fmis set as a uniform distribution between 3000 and 7000 cts s-1.
14.The time offset Δt of the model light curve.The prior of Δt is set as a uniform distribution between -2 and 2 s.
We then performed the fit using a self-developed Bayesian Monte-Carlo fitting package McEasyFit (Zhang et al.2015),which is based on the widely used Multinest algorithm (Feroz& Hobson 2008; Feroz et al.2009).This package can explore the complete parameter space efficiently to find the reliable best-fit parameters and determine their uncertainties realistically by the converged Markov Chains.The log-likelihood function can be calculated as:
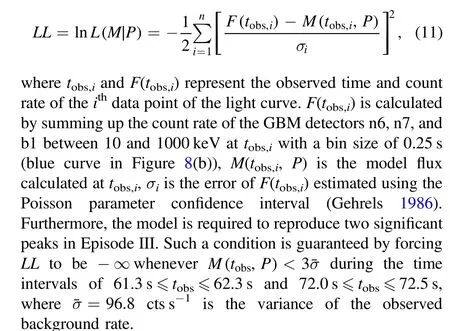
3.3.The Result

Based on the best-fit parameters in Table 3 and Equation(3),we can calculate that the observer angle θ is always smaller than the jet’s half-opening angle θjet,suggesting that the change of θ does not dominate the change of the laboratory frame observed flux.The lower limit of the jet’s half-opening angle can be derived asθjet,lolim=λmax+imax= 1.05 × 10⁻³rad.On the other hand,the precession-nutation effect modulates the shape of the observed light curve mainly through the conversion of photons’ observed time between the laboratory frame and the observer frame(i.e.,Equation(9))rather than the direct influence to the laboratory frame intrinsic light curve(i.e.,Equation(8)).As a result of the conversion of arrival time between the two frames, the number of arriving photons is redistributed in the observer frame.At certain times,the arrival of photons is more concentrated, which results in the peak structures in the light curve.
4.Summary and Discussion
This paper proposes that the observed three-episode feature of GRB 220408B can be explained by a precessing jet.Based on the similarities between the three episodes in light curve profile,spectral evolution,and spectral lags,we concluded that they may have the same origin and may be the result of jet precession.A jet-precession model can be successfully used to fit the light curve of GRB 220408B, which assumes a FRED shape light curve that precesses and nutates with slowing precession angular velocity.Our fit suggests that the photon arrival time change in different frames resulting from the precession jet plays a prominent role in shaping the observed light curve when a GRB is observed off-axis.

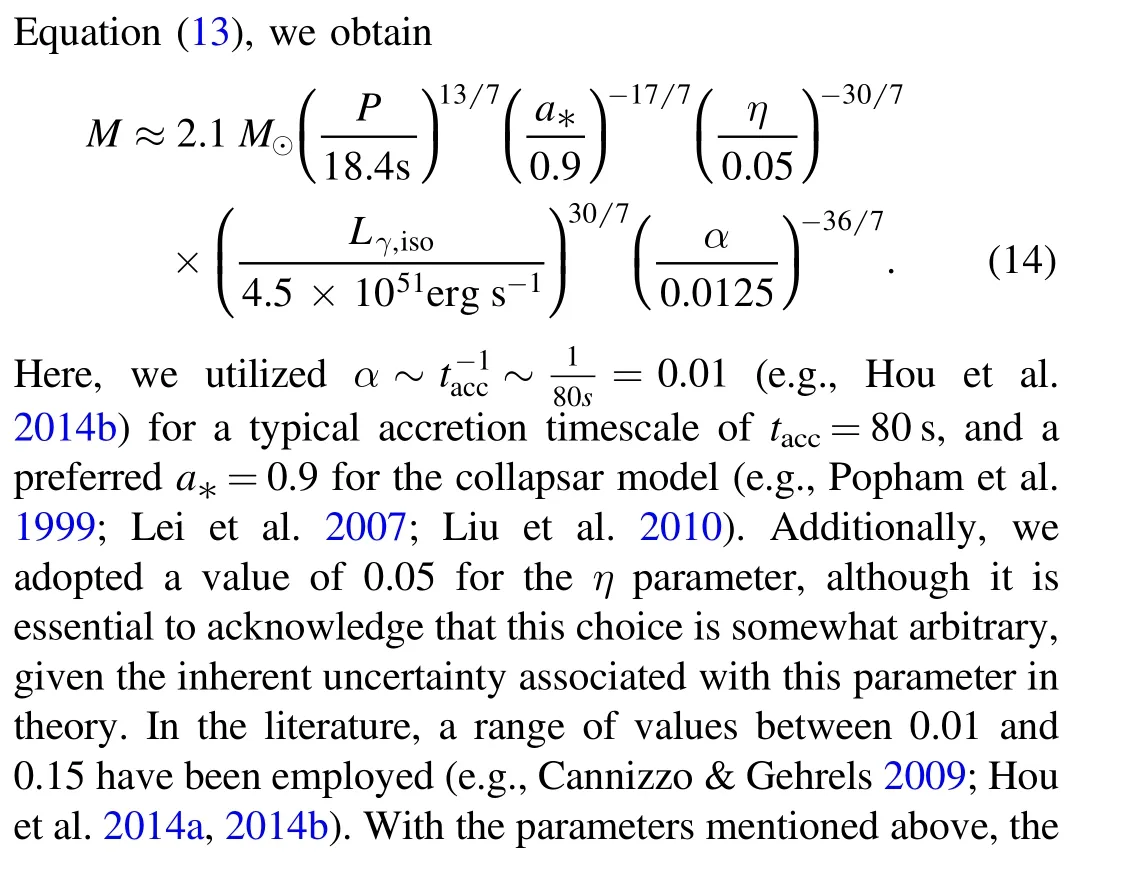
where a* and M are respectively the dimensionless spin parameter (0 Figure 8.(a) Corner plot of the posterior probability distributions of the parameters.The red error bars represent the 1σ uncertainties.The contours in the 2D histograms represent 1σ, 1.5σ, and 2σ uncertainties, respectively.(b) Light curves of GRB 220408B and the best-fit precession-nutation model. Table 3 The Best-Fit Parameters of the Light Curve in 10–1000 keV Range Additionally, it is worth noting that our model maintains a fixed jet bulk Lorentz factor at the typical value of Γ=300.Our analysis has verified that variations in the Γ value have negligible impact on the profile of the model’s light curve,thereby not substantially influencing our fitting outcomes.Furthermore, in view of computation costs, our model, which already has 14 free parameters, does not incorporate the reproduction of the observed spectral evolution.Although, in principle, such an evolution can be attributed to the Doppler factor change predicted by our model, a realistic model should also take into account the intrinsic central engine behaviors that result in the observed spectral evolution,which adds even more complexity to the model but will be left for future study. Acknowledgments We thank the anonymous referee for helpful suggestions and comments.We acknowledge the support by the National Key Research and Development Programs of China(2022YFF0711404, 2022SKA0130102), the National SKA Program of China (2022SKA0130100), the National Natural Science Foundation of China(grant Nos.11833003,U2038105,U1831135, 12121003), the science research grants from the China Manned Space Project with NO.CMS-CSST-2021-B11,the Fundamental Research Funds for the Central Universities,and the Program for Innovative Talents and Entrepreneur in Jiangsu.Y.-Z.M.is supported by the National Postdoctoral Program for Innovative Talents (grant No.BX20200164).We acknowledge the use of public data from the Fermi Science Support Center (FSSC). ORCID iDs Zijian Zhang https://orcid.org/0000-0002-2420-5022 Yi-Han Iris Yin https://orcid.org/0000-0002-5596-5059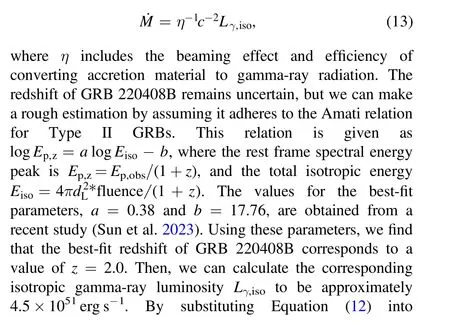



 Research in Astronomy and Astrophysics2023年11期
- Research in Astronomy and Astrophysics的其它文章
- Photometric and Spectroscopic Study of Two Low Mass Ratio Contact Binary Systems: CRTS J225828.7-121122 and CRTSJ030053.5+230139
- Injection Spectra of Different Species of Cosmic Rays from AMS-02, ACECRIS and Voyager-1
- The AIMS Site Survey
- A High-Temperature Superconducting Wideband Bandpass Filter at the L Band for Radio Astronomy
- Modified Masses and Parallaxes of Close Binary Systems: HD 39438
- Detecting HI Galaxies with Deep Neural Networks in the Presence of Radio Frequency Interference
