New Continuum Observations of the Andromeda galaxy M31 with FAST
Wenjun Zhang , Xiaohui Sun , and Jie Wang
1 School of Physics and Astronomy, Yunnan University, Kunming 650500, China; zhangwenjun@mail.ynu.edu.cn, xhsun@ynu.edu.cn
2 National Astronomical Observatories, Chinese Academy of Sciences, Beijing 100101, China
Abstract We present a new total intensity image of M31 at 1.248 GHz, observed with the Five-hundred-meter Aperture Spherical radio telescope(FAST)with an angular resolution of4′and a sensitivity of about 16 mK.The new FAST image clearly reveals weak emission outside the ring due to its high sensitivity on large-scale structures.We derive a scale length of 2.7 kpc for the cosmic ray electrons and find that the cosmic ray electrons propagate mainly through diffusion by comparing the scale length at 4.8 GHz.The spectral index of the total intensity varies along the ring, which can be attributed to the variation of the spectra of synchrotron emission.This variation is likely caused by the change of star formation rates along the ring.We find that the azimuthal profile of the non-thermal emission can be interpreted by an axisymmetric large-scale magnetic field with varying pitch angle along the ring,indicating a complicated magnetic field configuration in M31.
Key words: galaxies: ISM – galaxies: magnetic fields – radiation mechanisms: general – (ISM:) cosmic rays
1.Introduction
The Andromeda galaxy (M 31) is a prominent spiral galaxy that is the nearest to the Milky Way(Beck et al.1998).Due to its proximity and outstanding“ring”of star formation,M31 has been widely studied in various bands, such as X-ray (Pietsch et al.2005),UV(Gil de Paz et al.2007),near-IR (Jarrett et al.2003), far-IR (Rice et al.1988), and optical (Sarkisyan et al.2020).These observations have improved our understanding of the formation and evolution of M31.
The radio total intensity of M31 is concentrated in a ring about 7–13 kpc from the center (Beck et al.1998).In this ring,there are also concentrations of cold molecular gas(Nieten et al.2006),warm neutral gas(Chemin et al.2009),warm ionized gas(Devereux et al.1994), and dust (Smith et al.2012).All these indicate that the M31 ring is an important star-forming region and contributes most of the brightness of the galaxy.
There have been many studies based on the radio observations of M31.The first radio observation of M31 was conducted with the Cambridge one-mile radio telescope at 408 and 1407 MHz with resolutions of 80′ ×120′ and23′ ×35 ′,respectively(Pooley 1969).With the continuing improvement of angular resolution and sensitivity, the follow-up observations of M31 reveal more detailed emission structures, such as the observations by the Effelsberg 100 m telescope at 4850 MHz with a resolution of2.′6 (Berkhuijsen et al.1983).In addition, the combination of interferometric observations from the Very Large Array and the single-dish observations from the Effelsberg radio telescope at 1.5 GHz yielded an image with a high resolution of 45″ covering all the spatial scales (Beck et al.1998).
The spectrum of M31 has been studied based on the radio observations.The radio emission consists of synchrotron emission (non-thermal) and free–free emission (thermal).At frequencies below 10 GHz, the non-thermal emission is dominant(Battistelli et al.2019), and the fraction of thermal emission is only about 24%at 1 GHz(Berkhuijsen et al.2003).Based on the observations at 1.46 and 4.85 GHz, Berkhuijsen et al.(2003) obtained an overall non-thermal spectral index of α=−1±0.1 (Sν∝να, with Sνbeing the flux density at frequency ν).Beck et al.(2020) derived a total intensity spectral index of −0.71±0.02, and a synchrotron emission spectral index of −0.81±0.03 using the observations at 2.645 GHz, 4.85 GHz, and 8.35 GHz.The spectral index toward the ring increases to −0.5 because the thermal fraction is large and the spectrum thus tends to be flat (Fatigoni et al.2021).
The Five-hundred-meter Aperture Spherical radio Telescope(FAST) is well suited to image extended sources such as M31 with its high sensitivity(Jiang et al.2020).The observations of M31 Halo are one of the key projects currently being conducted by FAST with guaranteed time (PI: Jie Wang),which focuses on HI mapping in the region of about 800 square degree around the M31 and pulsar searching in the M31 galaxy.The continuum and polarization data have also been recorded simultaneously.This allows us to analyze the total intensity distribution and the spatial variation of spectral index to infer the properties of M31.
The paper is organized as follows: the observations and results are described in Section 2,and the results are discussed in Section 3, and summarized in Section 4.
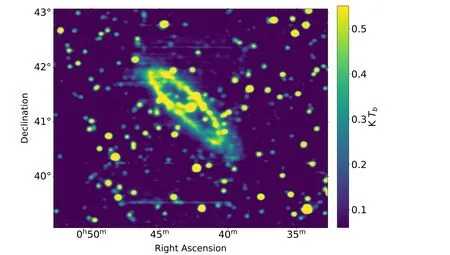
Figure 1.Total intensity (I) image of M31 at 1.248 GHz from FAST.The resolution is4′ and the rms noise is 16 mK.
2.Observations and Results
M31 was observed in drifting-scan mode(Jiang et al.2020).In this mode,the 19-beam receiver is rotated by 23°.4 so that a decl.strip of about22′ can be completed in Nyquist sampling for each individual scan.In total, 11 drifting scans were conducted during 2020 October 1–18.In order to calibrate the system variations, a linearly polarized noise of about 12.5 K(Jiang et al.2019) is injected into the system for 2 s every 1000 s.The frequency range of the receiving system is 1.0–1.5 GHz, which is divided into 65,536 channels.The width of each channel is about 7.63 kHz.The backend outputs four channels with two for total intensity I1and I2,and the other two for Stokes U and V.
We follow the data processing procedure developed by Sun et al.(2021).To obtain the images at a single frequency channel,the following steps were taken:(1)mitigation of radio frequency interference (RFI); (2) correction of instrumental polarization leakage and angle, and temperature scale with injected noise; (3) combination of all the 11 scans; (4)conversion to the brightness temperature scale (Tb).We repeat this procedure and obtain the maps of about 29,000 frequency channels.These maps are then smoothed to a common resolution of4′.
2.1.Total Intensity Maps
We average all the frequency channel maps by taking the median values and obtained the total intensity image at 1.248 GHz, as shown in Figure 1.Some scanning effects are indicated by the stripes along decl.direction still remain in the image, which were caused by drifting of the system.It would require scans in alternative directions to remove these effects, as shown by Sun et al.(2022).The rms noise is about 16 mK.
A smaller area containing M31 is cut out from Figure 1,rotated by 53° following Beck et al.(1998) and shown in Figure 2 (top panel).For comparison, the map by Beck et al.(1998) combining the interferometer and single-dish observations at 1.46 GHz is also shown in Figure 2 (middle panel).
As can be seen from Figures 1 and 2, there is strong radio emission toward the center and the ring area.The FAST image clearly reveals weak emission extending outside the ring toward the southwest.In contrast, this extended emission is almost absent in the image by Beck et al.(1998).
To study the emission from M31, we remove the bright compact sources marked in Figure 2(top panel)by subtracting Gaussian fittings of these sources.The resulting image is shown in Figure 2(bottom panel),which is used to investigate the variations of total intensity below.Note that there still remain background point sources that cannot be resolved with FAST.We retrieve the flux intensities of these sources from the NVSS survey with a higher resolution of 45″(Condon et al.1998), and find that their contribution to the intensity of the ring is less than about 5%.Their influence on the analyses below can thus be ignored.
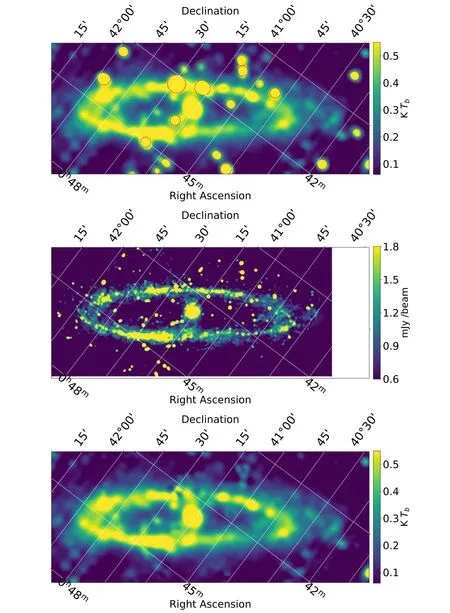
Figure 2.Total intensity(I)image of M31 from FAST(top panel),from the combination of the VLA and Effelsberg 100 m telescope(middle panel,Beck et al.1998),and from FAST with point sources marked in the upper panel removed (bottom panel).The galaxy is rotated by −53°.
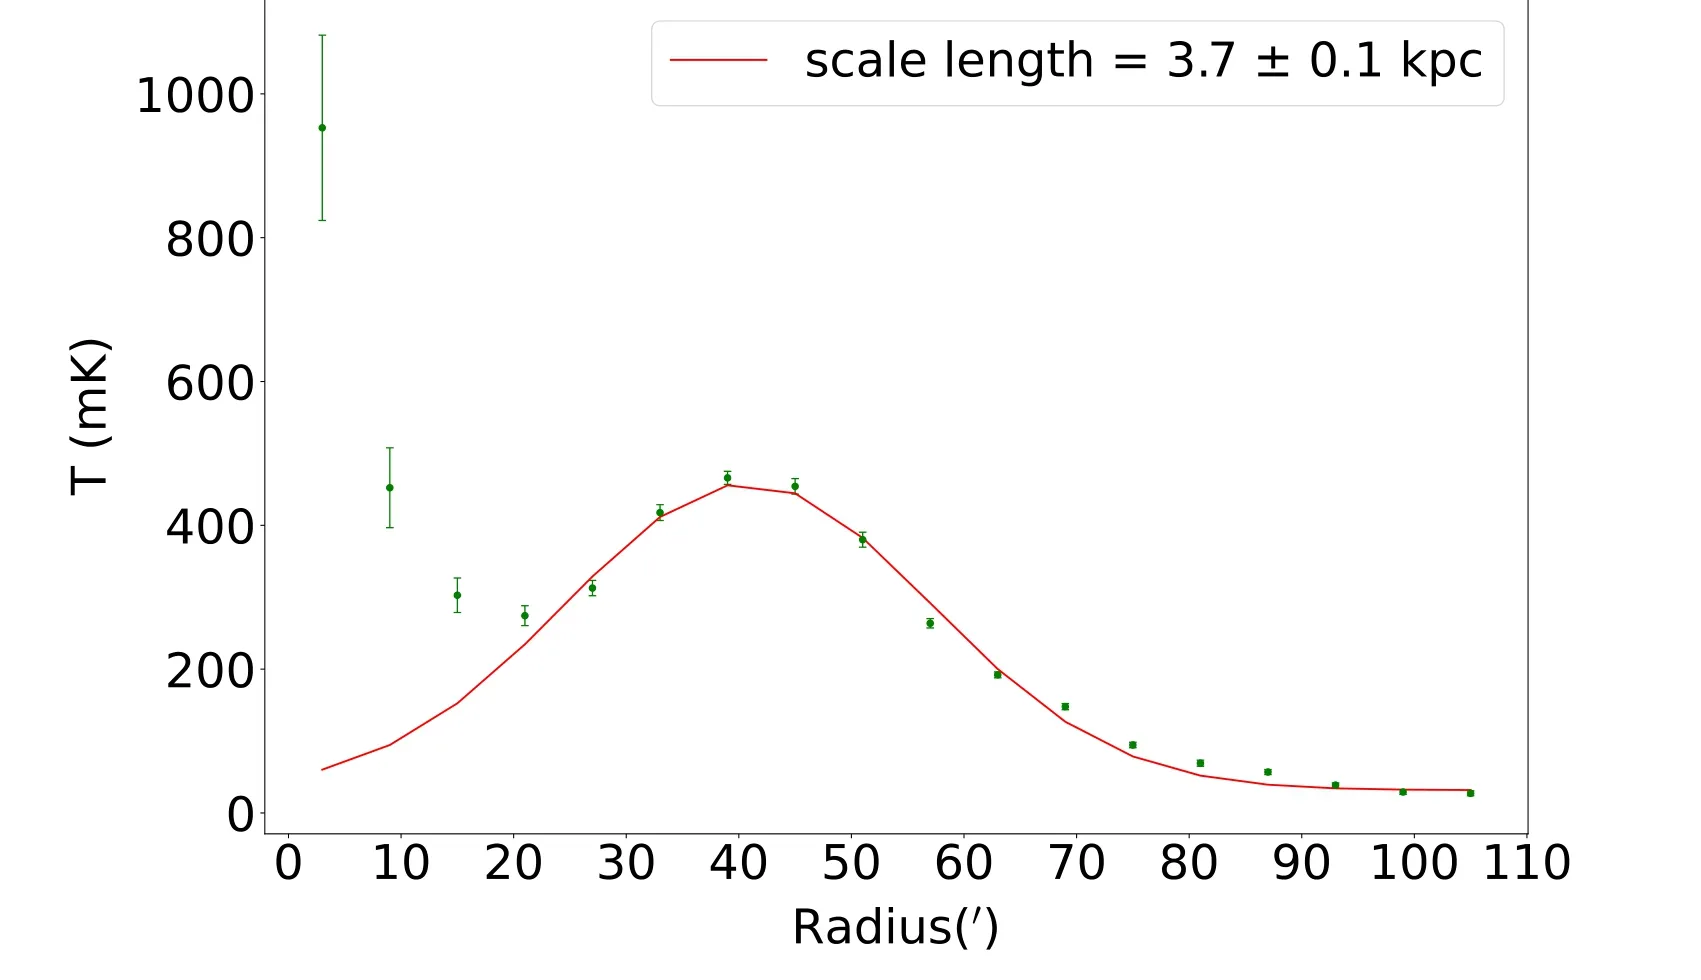
Figure 3.Intensity I with the angular distance from the galactic center.The red line indicates a Gaussian fitting with a scale length of 3.7 kpc after correcting the influence of beamwidth.
2.2.Radial Profile of the Total Intensity
The radial variation of the total intensity can be used to constrain the propagation of cosmic ray electrons.We derive the average intensity of 6′-width annuli from the center until the radius of about 110′.The intensity versus radius is shown in Figure 3.The standard deviation from each annulus is calculated as the error bar.
The sharp peak near radius 0 is contributed by the nucleus of M31.The broad peak from the radius of about27′to the radius of about57′indicates the ring area with bright emission.With a distance to M31 of about 780 kpc(Stanek & Garnavich 1998),this angular range corresponds to about 6–13 kpc.The total intensity gradually decreases with increasing radius and flattens out beyond the radius of about93′.
We fit the total intensity radial profile for radii larger than27′to a Gaussian, namelyT∝ exp[- (r-r0)22L2], where r is the radius,r0is the peak radius,and L is the scale length.After accounting for the influence of beamwidth,we obtain the scale length of about 16.′2 ± 0.3′ or 3.7±0.1 kpc.
2.3.Azimuthal Profile of the Total Intensity
The variation of total intensity versus direction reflects the structure of magnetic field.From the Gaussian fitting of the radial profile, we obtain the peak position of the ring atr0= 40.′9.We use the annulus of r0±L to derive the azimuthal profile of total intensity in the ring.The azimuthal angle starts from the major axis toward the north east and increases eastwards (Figure 1) or starts from the major axis toward the left and increases counter-clockwise (Figure 2).An average intensity is derived for every 10° sector, and the profile is shown in Figure 4.
The emission is the brightest for the azimuthal angle between 30° and 90°, and becomes weaker for the azimuthal angle between 150° and 270°, as can also be seen from Figure 2.There is no clear pattern for the azimuthal profile.
2.4.Spectral Index
The spectral index is related with the emission properties,such as non-thermal and thermal fraction and cosmic ray electrons aging.We do not derive the spectral index for all the pixels by fitting the brightness temperature against frequency because of the influence of background emission.Instead, we divide the whole M31 area into eight regions(Figure 5) and obtain the spectral index using the Temperature–Temperature plot (TT-plot) method(Turtle et al.1962) which is immune to the background emission.
We take the median values of the first 10,000 and the last 10,000 channels to calculate the spectral index with TT-plot.The corresponding frequencies are 1.055 and 1.420 GHz,which has the largest frequency separation and hence allows for a more accurate determination of spectral index.The TT-plot results for the seven regions are shown in Figures 5 and 6.Note that the brightness temperature spectral index β, as we obtain,can be connected to the flux density spectral index α as α=β+2.
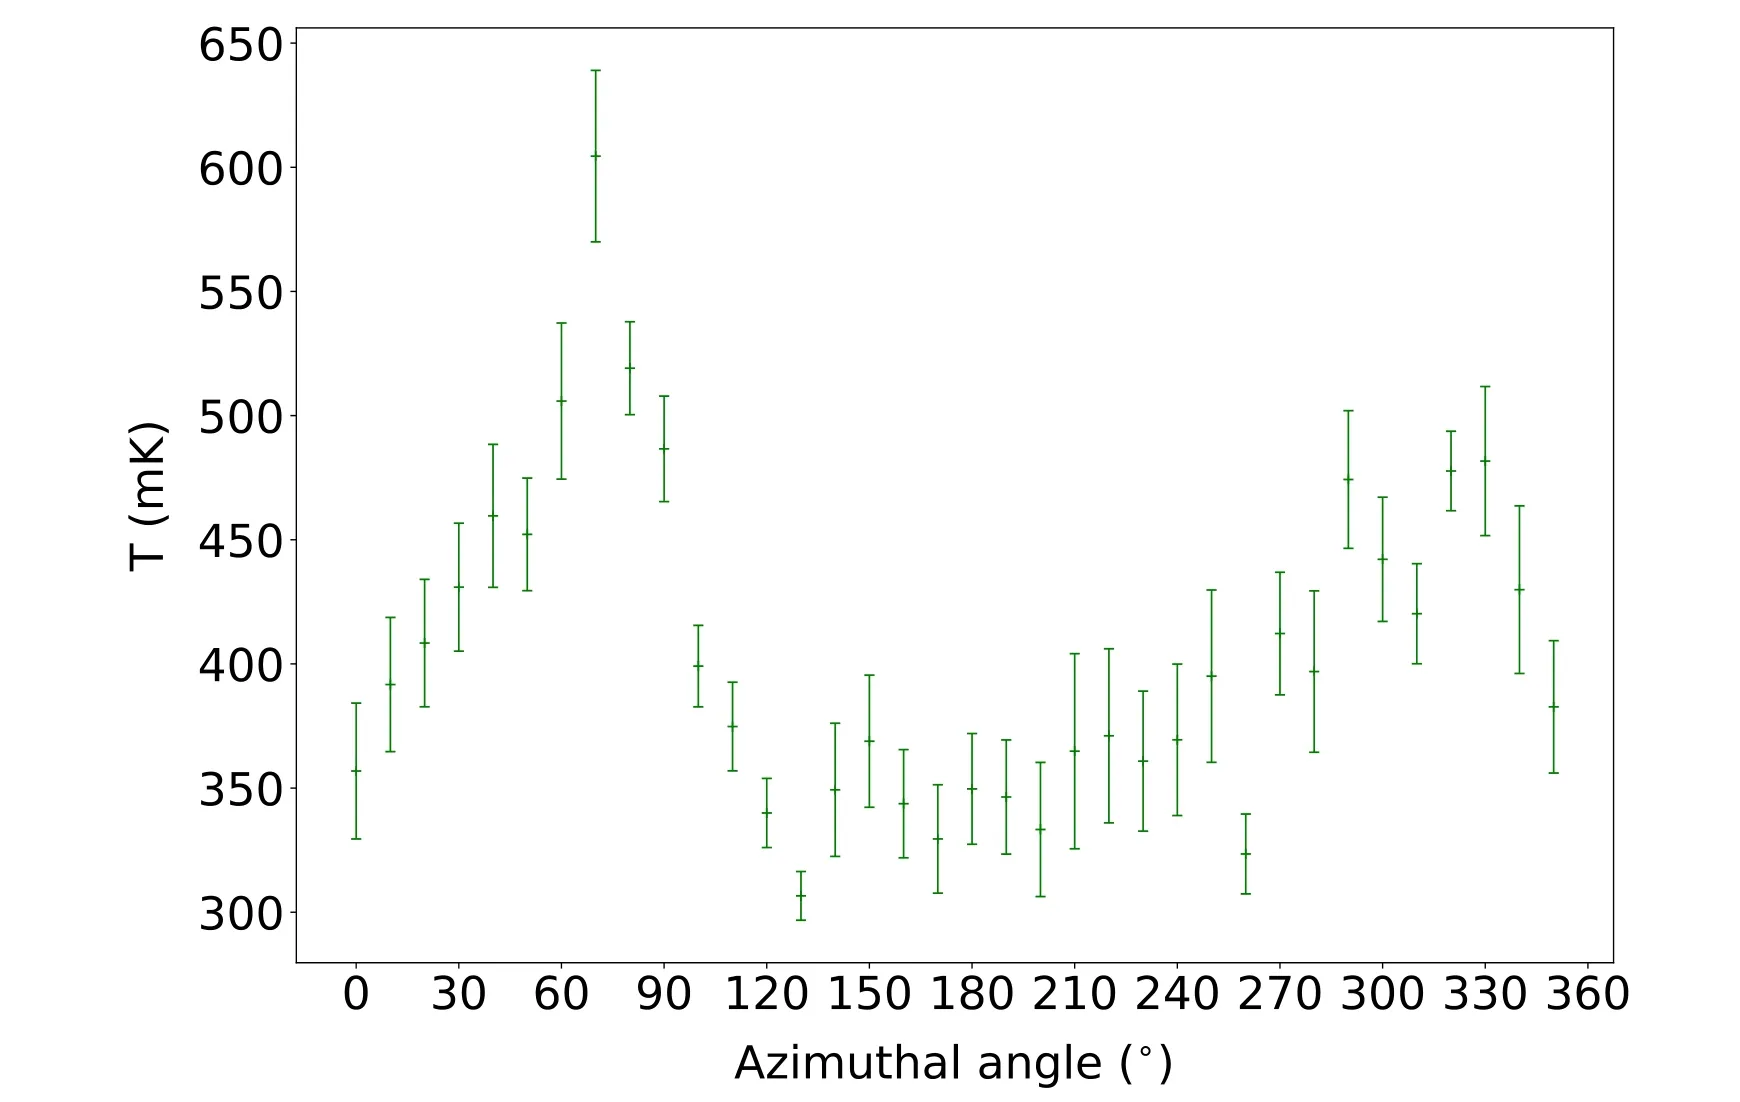
Figure 4.The total intensity in the ring of M31 vs.azimuthal angle.
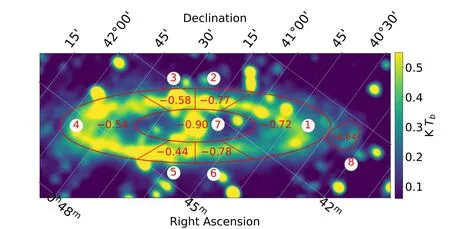
Figure 5.Area marked for deriving spectral index with the TT-plot method and the resulted flux density spectral indices α=β+2.
The spectral index for the total intensity is not uniform for M31.Toward the areas marked as 6,1,2 in Figure 5 where the total intensity emission is weak, the spectra are steep with spectral index α between −0.8 and −0.7.In contrast,the areas marked as 3,4,5 in Figure 5 where the emission is stronger,the spectra are shallower with spectral index α up to −0.44±0.09.There seems a tendency of larger intensity with flatter spectrum.The nucleus region marked as 7 has the smallest spectral index of −0.90±0.03.The area outside M31 marked as 8, detected because of the high sensitivity of FAST, has a spectral index of α=−0.64±0.08, and has not been well studied before.
3.Discussion
3.1.Properties of Cosmic Ray Electrons
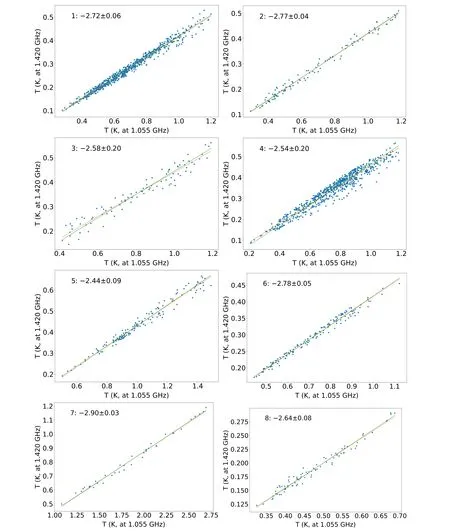
Figure 6.TT-plots for the areas marked in Figure 5.The resulted brightness temperature spectral indices β are also shown.
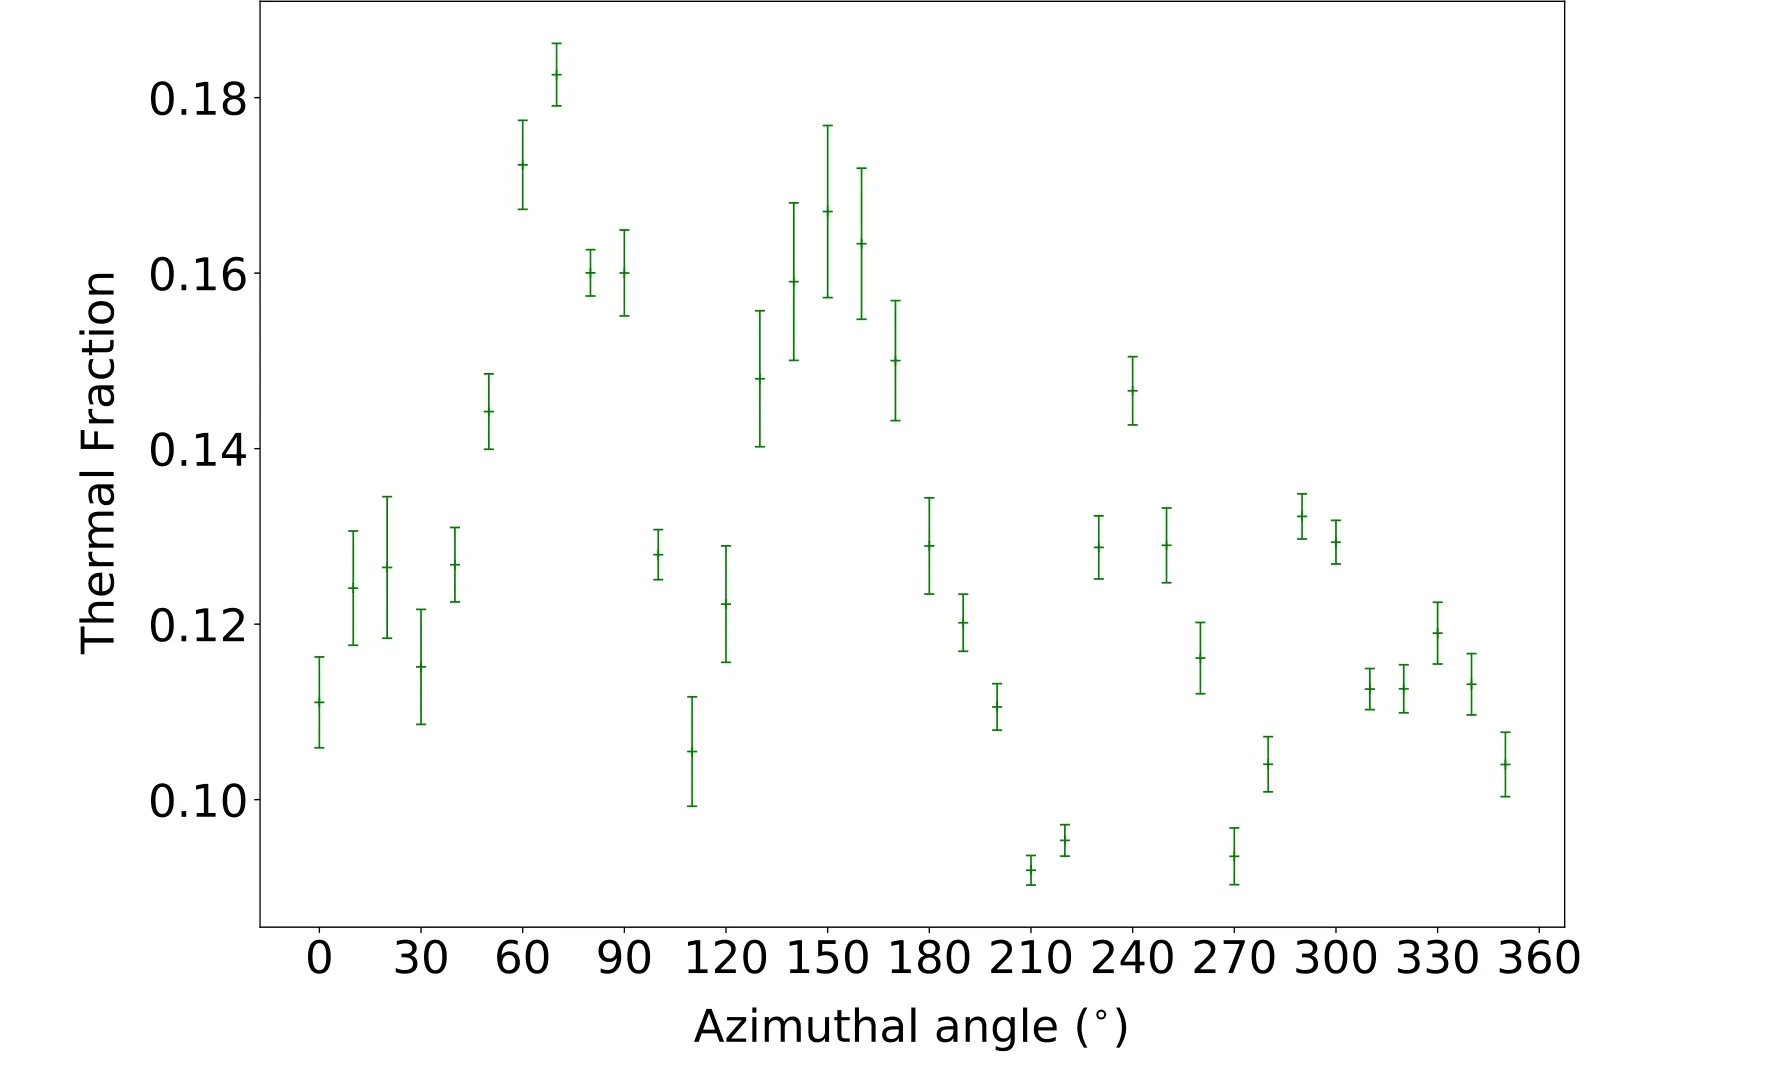
Figure 7.Thermal fraction obtained from Tabatabaei et al.(2013) vs.the azimuthal angle.
The total intensity is composed of both thermal emission from free–free radiation and non-thermal emission from synchrotron radiation.We take the images of thermal and nonthermal emission derived by Tabatabaei et al.(2013)and obtain the thermal fraction versus the azimuthal angle for the ring of M31, as shown in Figure 7.The thermal fraction is up to 20%for the azimuthal angle between 30°and 90°,and is about 10%for the rest.The thermal emission has a flat spectrum with αth≈−0.1 which is much larger than that of non-thermal emission.Therefore the mixture of thermal and non-thermal emission will bring the spectral index of the total emission to a larger value.Typically,for a thermal fraction of 10%and 20%,the spectral index of total intensity calculated from the frequency pair of 1.055 and 1.420 GHz is increased by 0.1 and 0.2 in comparison with the spectral index of non-thermal emission αn, respectively.
For the emission ring of M31,the spectra for total intensity toward the north part in Figure 1 or the regions 3, 4, 5 on the left part in Figure 5 are shallower than those toward the south part.Taking into account the influence of thermal emission,the spectral index of the non-thermal emission could be estimated by subtracting 0.1 or 0.2 from the total intensity spectral index depending on the thermal fraction.For example, the non-thermal spectral index could reach αn≈−0.64 for region 5 with a thermal fraction of about 20%.This implies that the non-thermal spectral index toward the northern part is larger than that toward the southern part of M31.
The asymmetry of the non-thermal spectral index between the northern and southern part of M31 was also found by Fatigoni et al.(2021) based on the observations at frequencies between 1.5 and 6.6 GHz.The star formation rate is also higher toward the north(Fatigoni et al.2021).A higher star formation rate results in a larger number of stars and consequently a larger number of supernovae and supernova remnants that can produce more cosmic ray electrons.Therefore the spectrum is flatter toward the north.Moreover, the presence of higher cosmic ray electron density results in stronger synchrotron radiation, which explains the correlation between large intensity and large spectral index.
For area 8 in Figure 5, it cannot be the extension from the ring.Otherwise its spectrum should be steeper because of the aging of cosmic ray electrons as they propagate from the ring.From the Herschel image at 250 μm(Viaene et al.2014),there is strong emission corresponding to this area, which seems to be part of a large ring structure surrounding M31.There could be star-forming activities that produce high energy electrons.High resolution observations are needed to detect radio emission related with the infrared emission observed by Herschel.
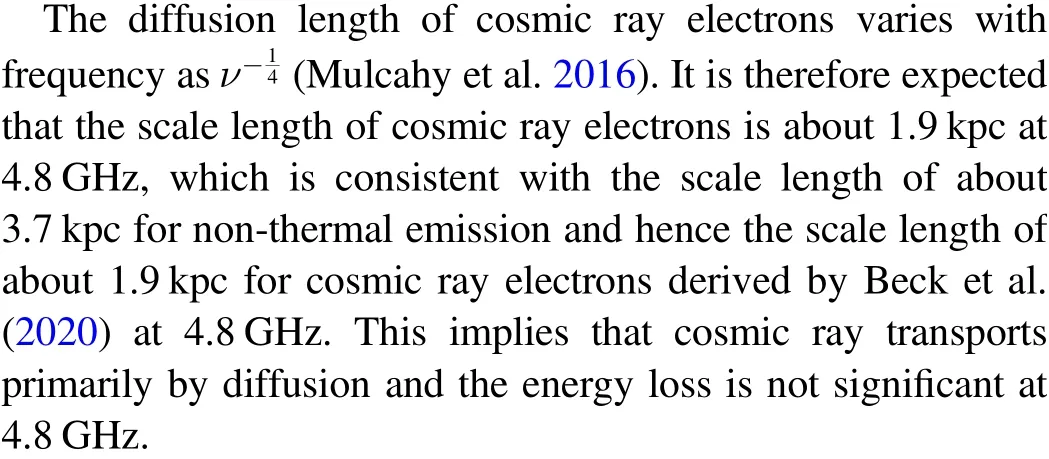
The scale length of the total emission is 3.7 kpc.The thermal emission is highly concentrated in the ring(Tabatabaei et al.2013), and therefore has little influence on the scale length of non-thermal emission.In practice, we derive a scale length of 3.8 kpc for the non-thermal emission after removing the contribution of thermal emission.This corresponds to an exponential scale length of 2 × 3.8 ≈ 5.4 kpc.Assuming an energy equipartition between magnetic field and cosmic rays,the scale length of the non-thermal emission is equal to that of cosmic ray electrons multiplied by the factor (3 −αn)/2 ≈2(Berkhuijsen et al.2013).The scale length of cosmic ray electrons is thus about 2.7 kpc.
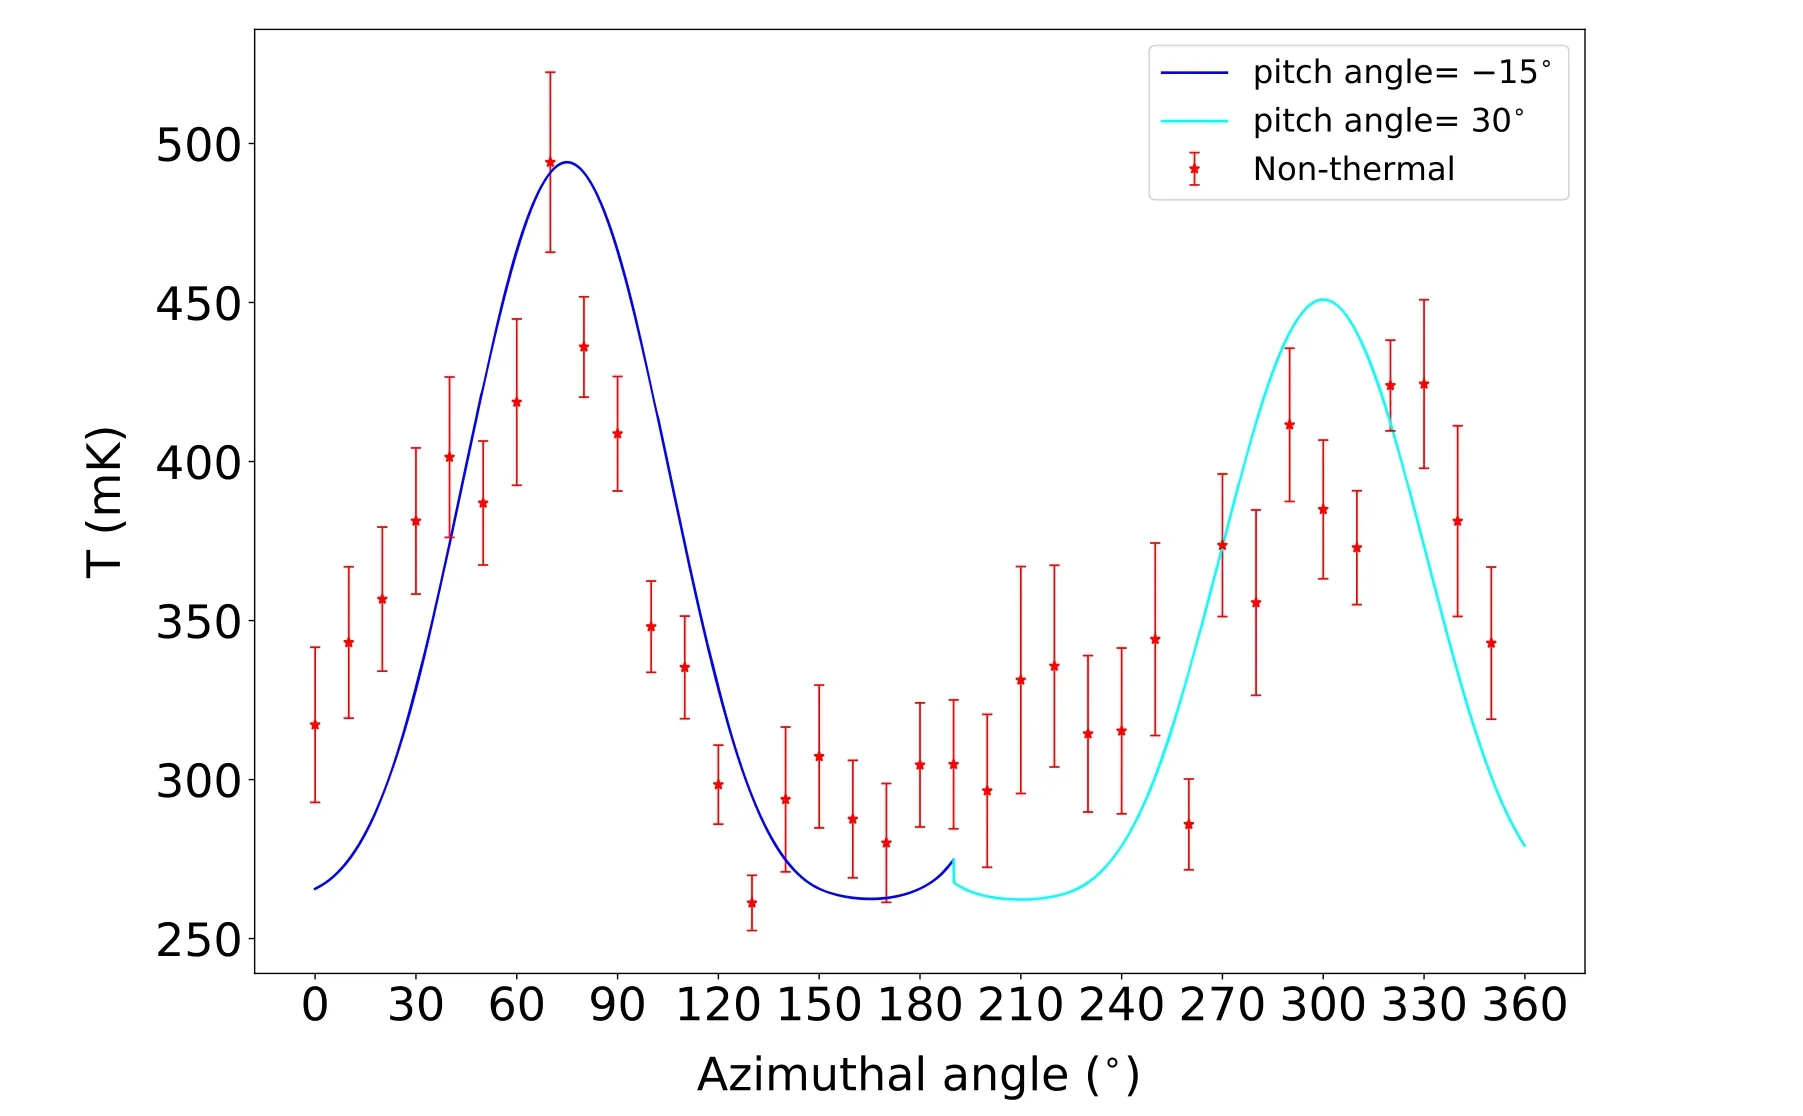
Figure 8.The azimuthal profile of the non-thermal emission within the ring.The lines indicate the profiles expected from an axisymmetric magnetic field with a pitch angle of −15° and 30°, respectively.
3.2.The Magnetic Field in the Ring
We obtain the azimuthal profile of the non-thermal emission within the bright ring after subtracting the thermal emission(Figure 7) from the total emission(Figure 4).The result is shown in Figure 8.The non-thermal emission is from synchrotron radiation and its profile thus reflects the magnetic field configuration in M31.
The large-scale regular magnetic field in M31 mainly follows an axisymmetric pattern(Han et al.1998; Fletcher et al.2004).In this configuration, the magnetic field perpendicular to the line of sight can be derived as,
where φ is the azimuth angle, ξ is the pitch angle, and i is the inclination angle of M31.The non-thermal intensity (I) can be assessed as(Beck & Krause 2005),
Here the energy equipartition between magnetic field and cosmic rays is assumed.
The random magnetic field has recently been classified into ordered field and isotropic field to interpret the polarization observations of M31(Beck et al.2020).The ordered field can be generated from shear of differential rotation or compression of spiral arm shocks(Jaffe 2019).However, there are no indications of such large-scale structures inside the ring from radio observations.We therefore only consider the isotropic random magnetic fields.Since the path length along different line of sight toward the ring is similar, the synchrotron emission from the random fields is independent of the azimuthal angle.The azimuthal variation of non-thermal emission is thus caused by the large-scale regular field.
The intensity of synchrotron radiation can be derived using Equations (1) and (2).The inclination angle i=75°(Chemin et al.2009) is used.The pitch angle is uncertain.Berkhuijsen et al.(2003) obtained a pitch angle of ξ=−13°±7° by analyzing polarization observations at 6 cm.Fletcher et al.(2004)found a radial change of the pitch angle from −17° to −8° based on multi-frequency polarization observations.Whereas, the recent analysis by Beck et al.(2020) suggested a large variation of the pitch angle versus azimuthal angle for the total magnetic field including both regular and ordered field.
Assuming a constant pitch angle for M31, we would expect the separation of the two intensity peaks to be 180°, which is clearly inconsistent with the observed profile shown in Figure 8.This implies variations of the pitch angle.We thus propose a simple model of the large scale magnetic field with a pitch angle of −15°for the azimuthal angle range of 0°–190°,and a pitch angle of 30°for the azimuthal angle range of 190°–360°.Additionally,we impose a factor of 0.95 for the ratio of the two peaks, which we attribute to the variation of cosmic ray electron density.The resulting profile is presented in Figure 8,which reasonably reproduces the observed profile.A more sophisticated model of magnetic field requires both total intensity and polarization observations at multiple frequencies,which is beyond the scope of this paper.
4.Summary
We obtain the total intensity images from the FAST legacy survey of M31, covering the frequency range of 1.0–1.5 GHz.By averaging over all the frequency channels, we derive the total intensity image at 1.248 GHz, which reveals weak extended emission outside the ring because of the high sensitivity.The image allows us to analyze the propagation of cosmic ray electrons and the magnetic field configuration.
The main conclusions are as follows:
1.We derive a scale length of about 2.7 kpc for the cosmic ray electrons by fitting the radial profile of non-thermal emission.In comparison with the scale length at higher frequencies, we find that the cosmic ray electrons propagate mainly through diffusion.
2.The spectral index of the total intensity in the ring,calculated from TT-plots, clearly exhibits an azimuthal variation,which can be attributed to the spectral variation of synchrotron radiation.The variation is likely caused by the change in star formation rates along the ring.
3.The weak emission detected outside the ring might not be the extended emission from the ring.Instead, it might be produced by star-forming activities.
4.The azimuthal profile of non-thermal emission can be reproduced with an axisymmetric large-scale magnetic field pattern with pitch angle varying with azimuthal angle, indicating that the magnetic field configuration in the ring is complicated.
Acknowledgments
W.Z.and X.S.are supported by the National SKA Program of China (grant No.2022SKA0120101).We thank the anonymous referee for the comments that helped improve the paper.We thank Dr.Fatemeh Tabatabaei for providing us the thermal fraction map of M31.
ORCID iDs
Wenjun Zhang https://orcid.org/0000-0003-3136-7756 Xiaohui Sun https://orcid.org/0000-0002-3464-5128
 Research in Astronomy and Astrophysics2023年11期
- Research in Astronomy and Astrophysics的其它文章
- Photometric and Spectroscopic Study of Two Low Mass Ratio Contact Binary Systems: CRTS J225828.7-121122 and CRTSJ030053.5+230139
- Injection Spectra of Different Species of Cosmic Rays from AMS-02, ACECRIS and Voyager-1
- The AIMS Site Survey
- A High-Temperature Superconducting Wideband Bandpass Filter at the L Band for Radio Astronomy
- Modified Masses and Parallaxes of Close Binary Systems: HD 39438
- Detecting HI Galaxies with Deep Neural Networks in the Presence of Radio Frequency Interference
