Galaxy Morphology Classification Using a Semi-supervised Learning Algorithm Based on Dynamic Threshold
Jie Jiang, Jinqu Zhang , Xiangru Li, Hui Li, and Ping Du
1 School of Computer Science, South China Normal University, Guangzhou 510631, China; zjq@scnu.edu.cn
2 Guangdong Construction Vocational Technology Institute, Qingyuan 511500, China
Abstract Machine learning has become a crucial technique for classifying the morphology of galaxies as a result of the meteoric development of galactic data.Unfortunately,traditional supervised learning has significant learning costs since it needs a lot of labeled data to be effective.FixMatch,a semi-supervised learning algorithm that serves as a good method,is now a key tool for using large amounts of unlabeled data.Nevertheless,the performance degrades significantly when dealing with large, imbalanced data sets since FixMatch relies on a fixed threshold to filter pseudo-labels.Therefore, this study proposes a dynamic threshold alignment algorithm based on the FixMatch model.First, the class with the highest amount has its reliable pseudo-label ratio determined, and the remaining classes’ reliable pseudo-label ratios are approximated in accordance.Second, based on the predicted reliable pseudo-label ratio for each category, it dynamically calculates the threshold for choosing pseudo-labels.By employing this dynamic threshold,the accuracy bias of each category is decreased and the learning of classes with less samples is improved.Experimental results show that in galaxy morphology classification tasks,compared with supervised learning,the proposed algorithm significantly improves performance.When the amount of labeled data is 100,the accuracy and F1-score are improved by 12.8%and 12.6%,respectively.Compared with popular semisupervised algorithms such as FixMatch and MixMatch, the proposed algorithm has better classification performance, greatly reducing the accuracy bias of each category.When the amount of labeled data is 1000, the accuracy of cigar-shaped smooth galaxies with the smallest sample is improved by 37.94%compared to FixMatch.
Key words: galaxies: photometry – techniques: image processing – techniques: photometric
1.Introduction
Investigating the evolution of galaxies requires an understanding of galaxy morphology (Barchi et al.2020).Galaxy morphology is closely related to the formation process of galaxies (Holwerda 2021).By studying the morphological features of galaxies, we can delve into exploring the evolution of the galaxies, the distribution of dark matter and the measurement of cosmological parameters, providing valuable information for our understanding of the cosmos (Parry et al.2009; Wijesinghe et al.2010; Salucci 2019).For example, the spiral arm characteristics affect how giant molecular clouds form within spiral arms and how their mass is distributed(Bekki 2021).
Currently, there are many galaxy morphology classification schemes, including a visual classification system based on the visual characteristics of galaxies (Kartaltepe et al.2015), a model-based classification system based on the brightness profiles of galaxies (Peng et al.2002), a non-model-based classification system based on structural parameters of galaxy morphology(Lotz et al.2004),and so on.A well-known visual classification scheme for galaxy morphology is the Hubble sequence.Galaxies are divided into three broad classes based on their visual features: elliptical galaxies, spiral galaxies and lenticular galaxies (Hubble 1979).These broad classifications are further refined to achieve more detailed galaxy morphology classification, leading to the development of additional categories like irregular galaxies (Gallagher & Hunter 1984).With the help of the Hubble sequence as inspiration,the Galaxy Zoo decision tree’s design was able to classify galaxy morphology in a more comprehensive way(Willett et al.2013).
The classification of galaxies initially relied on visual assessment (De Vaucouleurs 1959, 1964).However, the amount of data on galaxies has grown tremendously as a result of the ongoing development of sky surveys,including the Sloan Digital Sky Survey(SDSS;York et al.2000),the Hyper Suprime-Cam (HSC; Miyazaki et al.2012) survey, the Dark Energy Survey (Abbott et al.2005), the Euclid Space Telescope (EST; Laureijs et al.2011), and the Vera Rubin Observatory Legacy Survey of Space and Time (LSST; Ivezić et al.2019).For example,the LSST can generate 36 TB of data per night, totaling 500 PB over the course of its lifetime(Farias et al.2020).Faced with such a large volume of data, it is challenging to complete the visual classification of galaxies even utilizing citizen science projects like Galaxy Zoo (Willett et al.2013).Consequently, it is becoming a best choice to apply machine learning to classify galaxy morphology (Reza 2021).For example, Gupta et al.(2022)proposed an improved version of ResNet for galaxy classification.Li et al.(2023) designed a multi-scale convolutional neural network to extract multi-scale features from galaxy images resulting in improved accuracy in galaxy classification.Fang et al.(2023) introduced adaptive polar coordinate transformation to ensure consistent classification results for the same galaxy image.Different machine learning methods have also contributed to this field, such as those by Dunn et al.(2023),Wu et al.(2022),Ghosh et al.(2022),Zhang et al.(2022),and Wei et al.(2022).Amongthem,traditional supervised machine learning necessitates a substantial amount of labeled data for the classification of galaxy morphology (Zhu et al.2019;Barchi et al.2020), and manual data labeling is timeconsuming and labor-intensive, increasing the learning cost.Therefore,the use of semi-supervised approaches to completely exploit unlabeled data and improve the performance of the classification model has emerged as an important research field in galaxy morphology classification.
Currently, more and more semi-supervised algorithms are being tried out in the analysis of astronomical data.For instance, Ma et al.(2019) built an autoencoder based on the VGG-16 network that was first trained on a lot of unlabeled data to learn how to extract galactic features, and then finetuned on a small amount of labeled data to learn how to classify radio galaxies morphologically.Soroka et al.(2021) suggested a semi-supervised approach based on active learning and adversarial autoencoder models to address the issue of classifying galaxy morphologies.Slijepcevic et al.(2022)conducted semi-supervised research based on the radio galaxy classification network of Tang et al.(2019) utilizing transfer learning as the baseline, demonstrating the precision and robustness of semi-supervised learning (SSL) in radio galaxy classification.Ćiprijanović et al.(2022) created the DeepAstroUDA method, a general semi-supervised domain adaptation technique for astronomical applications that can find nonoverlapping classes in two separate galaxy data sets and even find and cluster unidentified classes.
SSL enhances learning performance by incorporating unlabeled data learning based on small sample supervised learning (Berthelot et al.2019).Today, deep semi-supervised learning (DSSL), which combines SSL and deep learning, has now emerged as the most effective method for SSL(Yang et al.2022).According to DSSL schemes, they can be categorized into three groups: consistency regularization-based SSL,pseudo-labeling based SSL and semi-supervised deep learning techniques combining the consistent regularization principle with pseudo-labels.A pseudo-label is regarded as a prediction label of unlabeled data by a model trained using trustworthy labeled data, and furthermore, a pseudo-label with high probability participates in the model’s training in the same way as the labeled data(Lee et al.2013).Semi-supervised deep learning techniques include MixMatch, ReMixMatch, Fix-Match, etc., which combine consistency regularization and pseudo-labels, becoming the most popular solution (Berthelot et al.2019; Sohn et al.2020).Among various algorithms,FixMatch simplifies the application of pseudo-labels and unsupervised loss and has been shown to obtain the best performance on basic test data sets.
Even if the FixMatch model performs at its best,this is only possible with balanced and sufficient data quantities for each category.Nevertheless, the training data in deep learning applications are typically imbalanced, especially in the area of astronomical data.For instance, the Galaxy Zoo 2 (GZ2) data set cited in this article contains just a small number of cigarshaped galaxies.When confronted with imbalanced data sets,the model tends to learn more features of classes with more samples and fewer features of classes with fewer samples,resulting in accuracy bias in a classification task, where the majority class’ accuracy is higher and the minority class’accuracy is lower.This problem is mostly caused by the FixMatch model’s predetermined high threshold for SSL,which ignores the learning progress of several classes.As a result,models like FlexMatch(Hou et al.2021),Adsh(Guo&Li 2022) and Dash (Xu et al.2021), which are based on the FixMatch model, introduce dynamic thresholds that change with the learning status.For example, FlexMatch proposes the idea of curricular pseudo-labels, a curriculum learning approach to leverage unlabeled data according to the models’learning status, where the dynamic threshold is a nonlinear mapping between the number of pseudo-labels for each class whose confidence exceeds the threshold and the current threshold.In order to improve learning for minority classes,Adsh dynamically adjusts the thresholds by determining the pseudo-label filtering ratio for each class.At the same time,DARP(Kim et al.2020),ABC(Lee et al.2021),CReST(Wei et al.2021) and others optimize the issue of data imbalance in SSL from the perspective of adjusting class distributions.Despite a variety of semi-supervised studies,little attention has been paid to the issue of imbalanced data distribution in astronomical data, which can lead to accuracy biases of semisupervised tasks on different categories.
Therefore, this paper proposes a semi-supervised method based on dynamic threshold alignment (DTA) to address the issue of data imbalance in semi-supervised classification of galaxies.By establishing a class-specific threshold that changes dynamically with the learning state of each class, the DTA method improves upon the fixed high threshold in the FixMatch algorithm.By doing so, it is ensured that minority classes receive a greater number of unlabeled learning samples during the training stage, hence minimizing accuracy biases in the classification task.We carried out experiments utilizing galaxy images from the Galaxy Zoo Data Challenge Project on Kaggle based on the GZ2 project (Willett et al.2013) to measure these improvements.We compared the experimental results of the FixMatch algorithm, several well-known semisupervised algorithms and the DTA algorithm under various data quantities.The DTA algorithm performed better in most situations.

Figure 1.The training process of unlabeled data in FixMatch.FixMatch applies both weak and strong data augmentation to the unlabeled data,which are then fed into the model to obtain different prediction results.The prediction results from weak data augmentation are transformed into pseudo-labels using a fixed high confidence threshold.The cross-entropy loss used for model training is made up of these pseudo-labels and the prediction outcomes from strong data augmentation.
The structure of this paper is as follows.Section 2 is the method design, along with the evaluation metrics and the design of the DTA algorithm.In Section 3,which describes the experiment, the experimental data sets, platform, related data augmentation,baseline network and comparison techniques are introduced.Results and discussion are found in Section 4.Section 5 concludes the paper by providing a summary.
2.Methodology
The DTA algorithm improves upon the fixed high threshold used in FixMatch by setting an independent dynamic threshold for each galaxy category.This avoids the issue of losing correct pseudo-labels that can occur when relying on a fixed high threshold for all classes in FixMatch.By utilizing a dynamic threshold, DTA enhances the robustness of the model, reduces accuracy bias and introduces more accurate pseudo-labels during the training process.
2.1.Dynamic Threshold Calculation
2.1.1.Fixed Threshold in FixMatch
In order to filter reliable pseudo-labels, the FixMatch SSL technique employs a fixed threshold.During training, pseudolabels and consistent regularization principles are used.For labeled data, FixMatch trains a supervised model using crossentropy loss and weak augmentation.The generated supervised model is then further trained on unlabeled data, with the unlabeled data being subjected to weak augmentation, strong augmentation and cross-entropy loss (Figure 1).According to the consistent regularization principle, after both weak and strong augmentations,the same unlabeled data should yield the same model classification results.By lowering the crossentropy loss, FixMatch brings the strong augmentation prediction results closer to the pseudo-labels and generates pseudo-labels based on the weak augmentation prediction results of unlabeled data.

where λuis a constant scalar hyperparameter that denotes the importance of unsupervised loss;sL indicates supervised loss;andLusignifies unsupervised loss.Here the supervised losssL is the standard cross-entropy loss of weakly augmented labeled data compared to the true label, which is calculated as expressed in Equation (2)

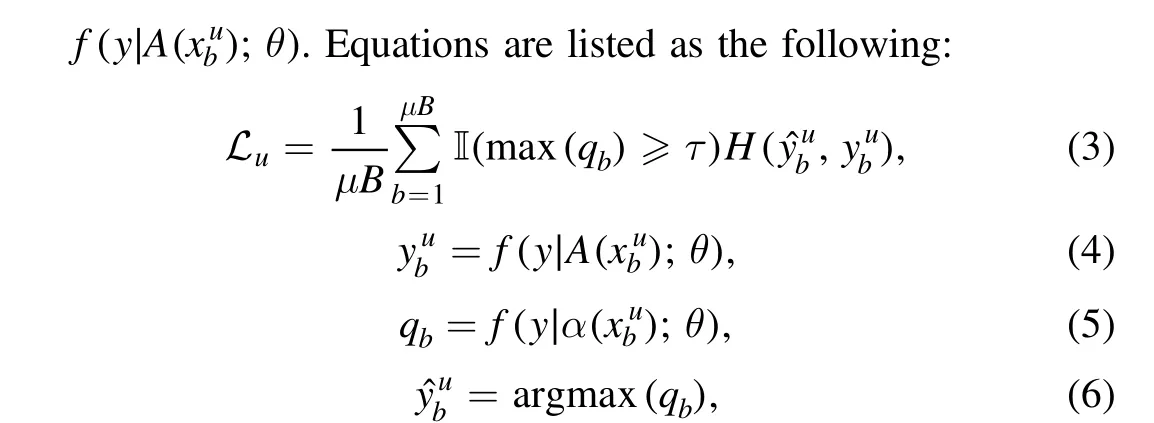
where I(·) is a filter function to ensure the reliability of pseudolabels; τ stands for the threshold defined by FixMatch; qbrepresents the prediction probability of the model f with parameter θ;A(xbu) andα(xbu)signify strong and weak augmentation for unlabeled data, respectively;yˆbumeans the unlabeled data’s pseudo-label in a form of one-hot probability distribution which is produced by applying the function argmax(·) to the probability prediction value qb.Based on the principle of consistent regularization, the FixMatch algorithm obtains the unsupervised loss of the unlabeled data using the cross-entropy loss with corresponding pseudo-label.
In the FixMatch algorithm,a fixed high threshold τ=0.95 is configured to ensure the reliability of pseudo-labels to screen pseudo-labels with high prediction confidence.Yet, the high threshold limits the number of pseudo-labels while maintaining the validity of pseudo-labels.Especially in the early stage of training,too high of thresholds lead to a loss of correct pseudolabels in a class with small sample size, further increasing the training gap between a class with small sample size and the class with the largest sample size,which is not conducive to the robustness of the model.The loss of accurate pseudo-labels must therefore be minimized by implementing a new dynamic threshold semi-supervised approach that does not rely on a predetermined high threshold during training.
2.1.2.Dynamic Threshold Alignment Algorithm
The main premise of the DTA technique is to consider the influence of the number of labeled data in each class on the learning effect while assuming a uniform distribution of different classes within a batch.As a result, by examining the percentage in the class with the most data, we may infer the proportion of reliable pseudo-labels in other classes.The algorithm could dynamically determine the threshold for filtering pseudo-labels in each category based on the inferred proportions of pseudo-labels in each class, making up for the shortcoming of utilizing a fixed threshold in the FixMatch algorithm.
In Figure 2, the practical flow of the algorithm is displayed.First,the predicted results of the unlabeled data are grouped by class, and the confidence of the predicted class is stored in an array and sorted in descending order.Then, based on the fixed high threshold of the majority class, the reliable pseudo-label ratio of the majority class is determined and the reliable pseudo-label ratios of other classes are calculated based on the class distribution of the labeled data.Finally, based on the reliable pseudo-label ratios of each class,reliable pseudo-labels are assigned from high to low confidence in the sorted prediction arrays.The confidence corresponding to the partition position is the new threshold.
(1) Reliable pseudo-label ratio calculation
The DTA approach first establishes a predefined high threshold τ0for the majority class, assuring the reliability of the pseudo-label screening.Based on this, the ratio of pseudolabels with confidence higher than the threshold in the unlabeled data predicted as the majority class by the model can be calculated, i.e., the reliable pseudo-label ratio of the majority class, as shown in the following equation,
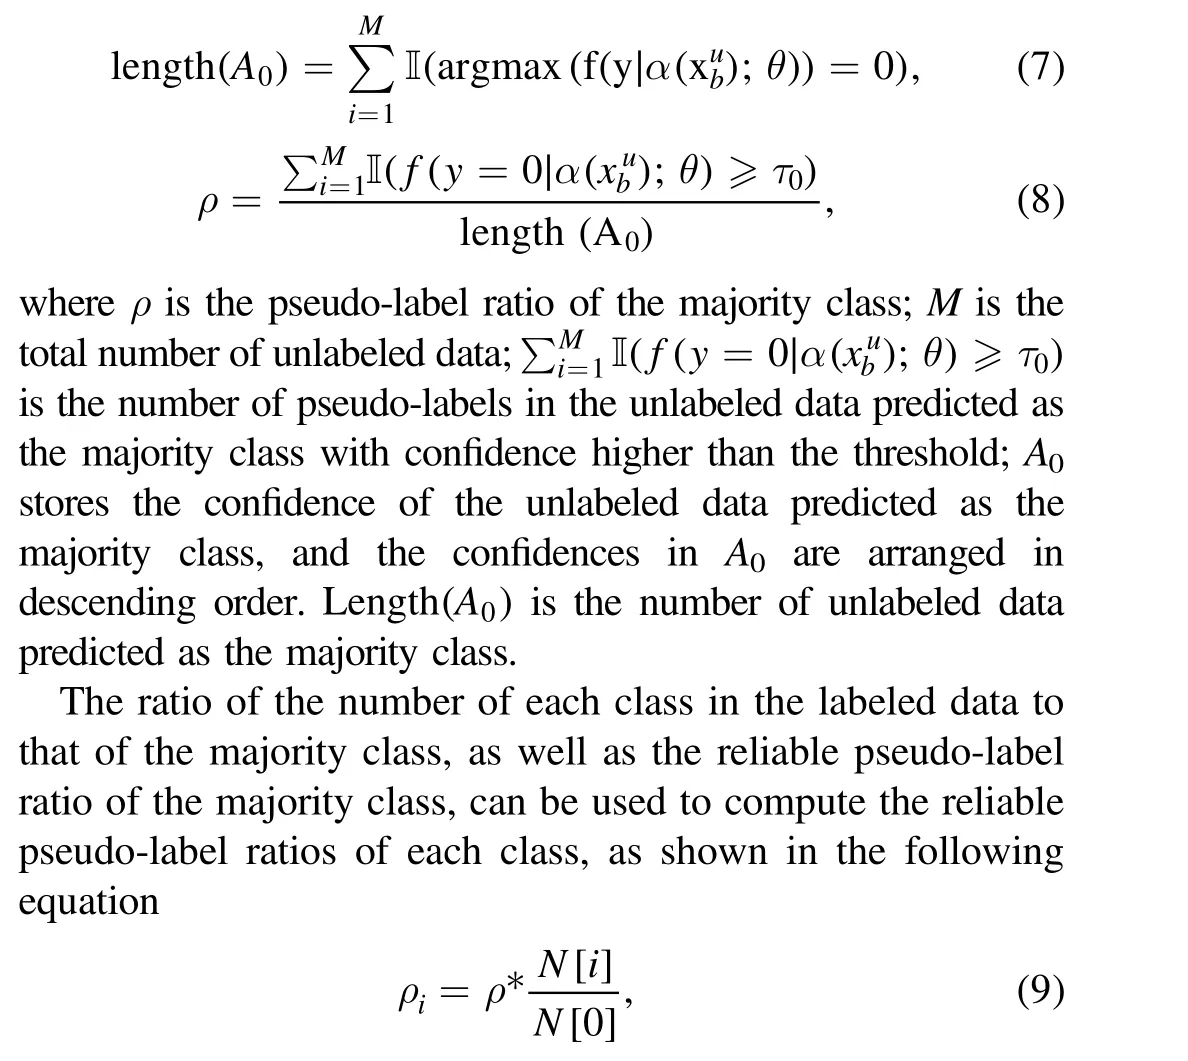
where ρiis the reliable pseudo-label ratio of class i; ρ is obtained from Equation(8)as the reliable pseudo-label ratio of the majority class and N[i]is the number of members in class i;N[0] is the number of members in the majority class in the labeled data.
(2) Dynamic threshold calculation
Using the reliable pseudo-label ratios of each class obtained from Equation(9)and the confidence of the model’s prediction on the unlabeled data, the new threshold of each class can be calculated using the following equation
where Acis an array that stores the confidence of the unlabeled data predicted as class c, and the confidence is sorted in descending order.Length(Ac) is the number of unlabeled data predicted as class c.
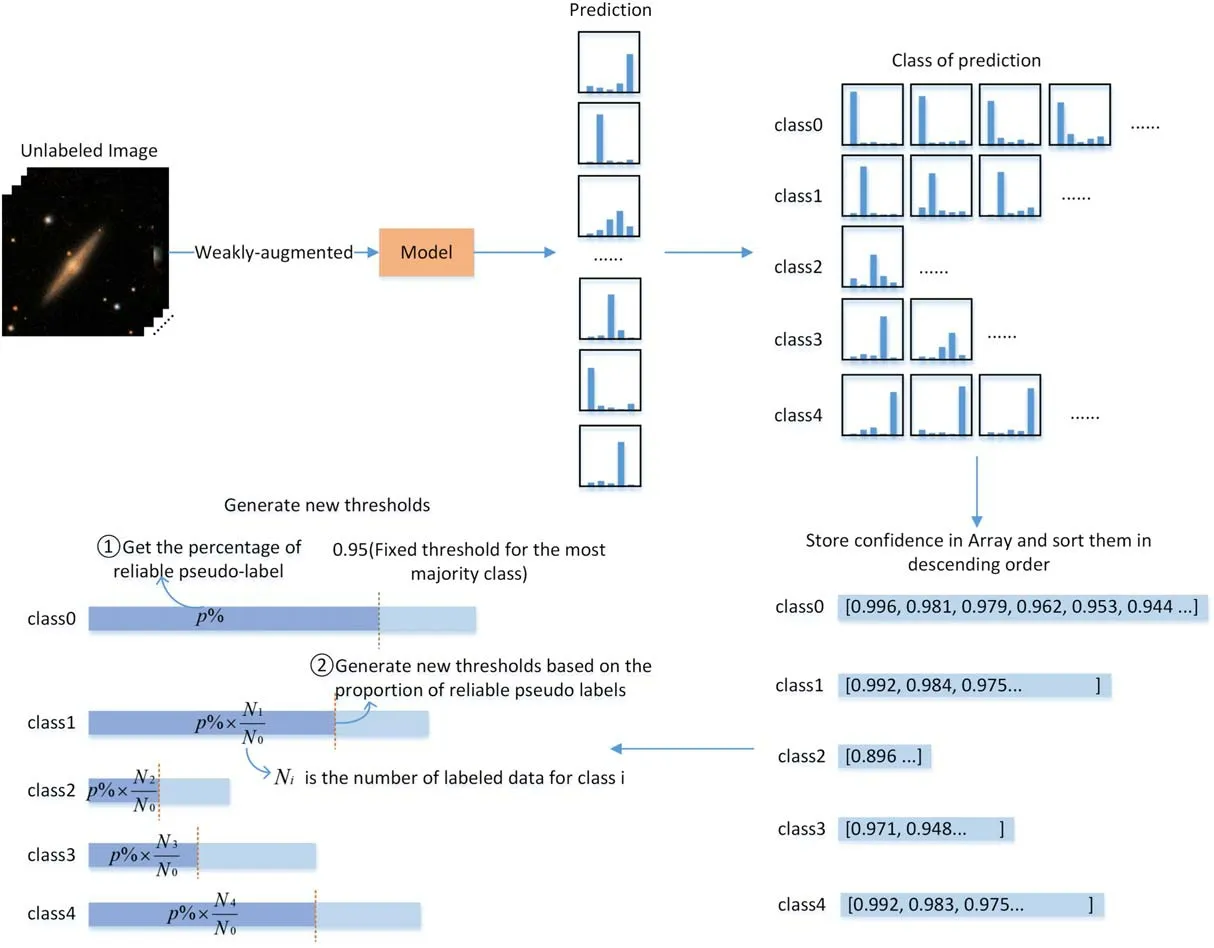
Figure 2.The workflow of the DTA algorithm.In order to generate pseudo-labels,first sort the data according to the prediction probabilities of each category for the unlabeled data; then, set a high threshold and determine the percentage of reliable pseudo-labels for the category with the highest number; then, determine the threshold for other categories based on this percentage; and finally, obtain pseudo-labels for other categories.
The DTA algorithm uses Equation (10) to determine the dynamic threshold new−τcfor each class by determining the pseudo-label screening ratio for each class.When the model has high confidence in the pseudo-labels of the minority class and the dynamic threshold new−τcis higher than the majority class threshold τ0, new−τcwill be set as τ0so as to introduce more correct pseudo-labels in the state of better model learning.
The DTA algorithm is able to choose trusted pseudo-labels with relatively low confidence but high intra-class confidence by applying dynamic and independent thresholds for each class, minimizing the learning bias brought on by imbalanced data during training.
2.2.Framework for Semi-supervised Classification Using DTA Algorithm
The DTA technique is employed in this semi-supervised training procedure to create dynamic thresholds for selecting trustworthy pseudo-labels for the unlabeled data.The framework for semi-supervised training is illustrated in Figure 3.Weak data augmentation is used to create an initial supervised model in the early phases of model training.The supervised loss is the sole loss included in the total loss at this point because the DTA algorithm is focused on training the supervised model.When the labeled data reach a good initialization state, namely, the supervised loss is less than the appropriate threshold, the training of unlabeled data is introduced and pseudo-labels are generated for the unlabeled data based on the initial model.

Figure 3.Semi-supervised training flow diagram with the DTA algorithm.The training of unlabeled data is added during the semi-supervised training process when the labeled data achieve a good initialization state, that is, the supervised loss is lower than the corresponding threshold (threshold_Ls).When screening potential pseudo-labels, information entropy is also included.Pseudo-labels can only be chosen as reliable labels when both of these factors are satisfied, i.e., when the information entropy is low and the confidence level is high.
The DTA algorithm’s pseudo-label screening must meet two requirements: first, the model prediction confidence must be higher than the threshold; second, the model predicted probability of the matching unlabeled data must have less information entropy.Information entropy is an indicator used to measure uncertainty.Uncertainty decreases with increasing information entropy,and increases with decreasing information entropy.When pseudo-labels are analyzed using information entropy, the lower the information entropy is, the higher the certainty of the model on the pseudo-label.The DTA algorithm adds the information entropy restriction to the screening of pseudo-labels to boost the certainty of the labels.When training additionally includes unlabeled data, the total loss comprises both supervised loss and unsupervised loss, and the computation method is the same as Equation(1).The DTA algorithm’s unsupervised loss computation looks like this

2.3.Evaluation
Equations(13)–(16)outline the procedure for calculating the assessment metrics for binary classification tasks, which include accuracy, precision, recall and F1-score.In these equations,TP represents true positive,FP means false positive,TN signifies true negative and FN corresponds to false negative.
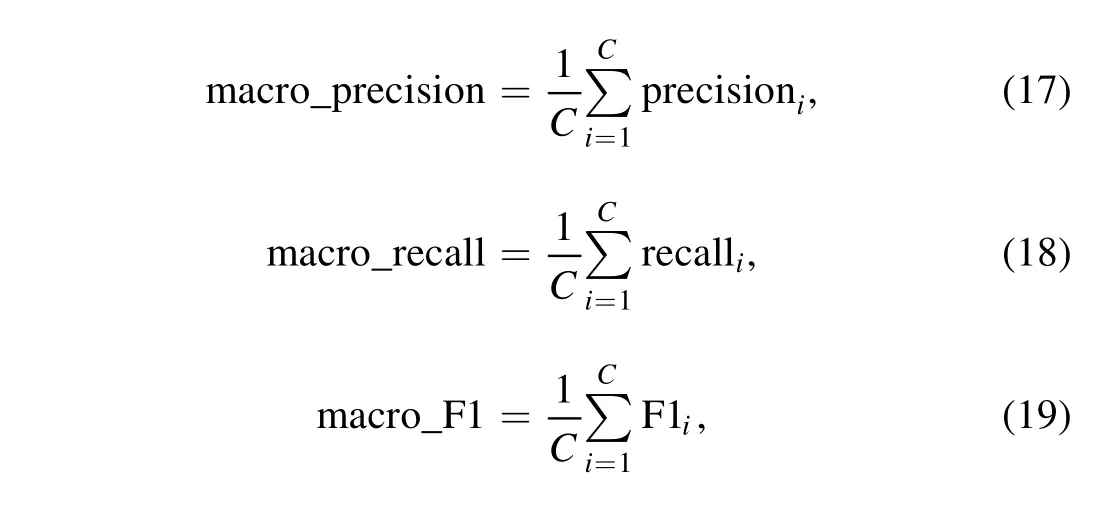
For the multi-classification task of galaxy morphologies,accuracy is the ratio of the number of correctly predicted samples to the total number of samples, and it measures the overall accuracy of the model’s prediction.Precision, recall,and F1-score are calculated by taking the non-weighted average of the metrics for each class, known as macro_precision,macro_recall, and macro_F1 respectively.The calculation equations are as follows:where C represents the number of galaxy classes.

Figure 4.Examples of GZ2 images depicting different types of galaxies.
3.Experiment
3.1.Data Preparation
The data used in this study are derived from GZ2, which is publicly available through the Galaxy Zoo Data Challenge Project on Kaggle.3https://www.kaggle.com/c/galaxy-zoo-the-galaxy-challengeThe data set contains 61,578 galaxy images from the SDSS Data Release 7 (DR7) and provides 37 parameters that describe galaxy morphology.The values of these parameters range from 0 to 1 and represent the probability distribution of galaxy morphology across 11 classification tasks in the GZ2 decision tree (Willett et al.2013).A higher value indicates a stronger agreement among volunteer classifiers regarding the given galaxy’s features,suggesting more reliable results.
To simplify the classification task, five types of galaxies,including completely round smooth, in-between smooth(between completely round and cigar-shaped), cigar-shaped smooth, edge-on, and spiral galaxies, were screened by Zhu et al.(2019)based on the sample cleaning and selection criteria of Galaxy Zoo.Examples for each category are depicted in Figure 4.Following the sample cleaning and selection criteria outlined by Zhu et al.(2019), we filtered the aforementioned five types of galaxies, to select reliable manual labels.The specific galaxy data selection criteria are shown in Table 1.The selected data set consists of 28,793 clean galaxy imagesamples, with each sample image having dimensions of 424×424×3 pixels.
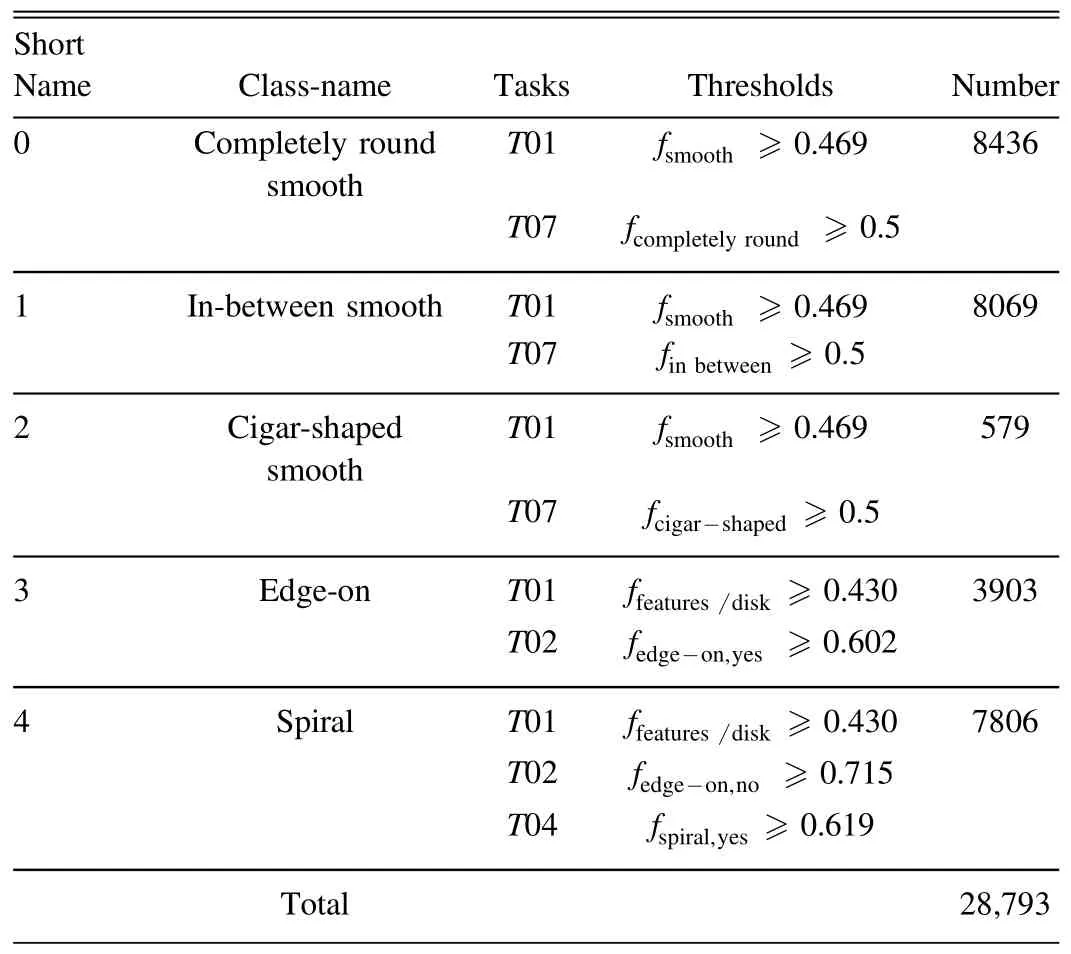
Table 1 Clean Samples Cleaning and Selection Criteria
Within each category, the screened clean samples were split into training and testing sets in a 9:1 ratio.To evaluate the performance of the DTA method with varying labeled data sizes, six unique labeled data sets were constructed as presented in Table 2.
3.2.Data Augmentation
Weak and strong data augmentation were applied to the unlabeled data whereas weak data augmentation was onlyapplied to the labeled data during the semi-supervised training process.

Table 2 Various Sized Labeled Datasets
3.2.1.Weak Data Augmentation
In this experiment,galaxy images were subjected to a variety of weak data augmentations,as depicted in Figure 5,including rotation, cropping, flipping, altering image properties, scaling and translation.In the first step, the image was randomly rotated from 0° to 360° and randomly vertically and horizontally flipped with a probability of 50%.To extract the galaxy morphology data contained in the image’s center and remove extraneous background information surrounding the galaxy, the image was arbitrarily center-cropped to a size of s×s×3 with jittered size in the second phase,where s ∊[160,240].The image’s brightness,contrast,saturation and hue were all randomly altered with an offset range of 0–0.2 in the third step.The image was then translated horizontally or vertically by 0–2 pixels and resized to 98×98×3 pixels.To meet the training requirements of the model,simple center-cropping and scaling were applied to the galaxy images in the validation set.
3.2.2.Strong Data Augmentation
In order to prevent missing important morphological features in galaxy images,we eliminate the procedure of random image cropping from the FixMatch algorithm for strong data augmentation.Similar to weak data augmentation, the strong data augmentation procedure primarily involves larger adjustments to the galaxy images.The galaxy images are flipped and rotated in the initial step, and then the images are subjected to larger-scale jittering for center cropping in the following stage,which results in a randomly selected s×s×3 size, where s ∊[160,280].The third stage involves randomly adjusting the images’hue,saturation,contrast and brightness using an offset that ranges from 0 to 0.4.The images are finally resized to 98×98×3 pixels and moved 0–6 pixels either horizontally or vertically.
3.3.Implementation Details
Using Python 3.8.5 and Pytorch 1.7.1, the SSL of galaxy classification based on the DTA algorithm was implemented in this study.A computer with 16 GB of RAM and 16 GB of VRAM was employed for the experiments, and Conda was utilized for GPU acceleration.To confirm the effectiveness of the DTA algorithm, numerous comparative experiments were carried out.Three types of comparative experiments are included in this study: SSL, imbalanced SSL and supervised learning.For the comparison analysis,relevant algorithms were chosen.FixMatch, MixMatch and ReMixMatch are semisupervised algorithms, while Adsh, DARP and FlexMatch are imbalanced semi-supervised algorithms.
The EfficientNet-G3 deep neural network created by Wu et al.(2022)served as the foundational network in this study.It is a lightweight deep neural network with fewer parameters that is effective at classifying galaxy morphologies.The low parameter count of EfficientNet-G3 can prevent model overfitting in SSL with little labeled data.
EfficientNet-G3 was trained using a batch size of 16 for 50,000 iterations as the baseline network for all experiments.The ratio of unlabeled data to labeled data during the training process was 7:1.The coefficient of λuunsupervised loss was set to 1.The threshold for loss−τ of supervised loss was set to 0.2,and the threshold for info−τ of information entropy was set to 0.4.In the experiments,a stochastic gradient descent(SGD)optimizer with a learning rate of 0.001 and an exponential moving average (EMA) approach with a decay rate of 0.999 were both utilized.The threshold τ0for the class with the largest number of samples was set to 0.95.
4.Results and Discussion
4.1.Results of DTA Algorithm and Baseline Network
Efficient-G3 was our baseline network for both the supervised and semi-supervised method.The results of the supervised learning and DTA algorithm for galaxy classification are compared in Table 3.As shown in Table 3,when there are 100 labeled data samples, the DTA algorithm outperforms supervised learning in accuracy by 12.8% and F1-score by 12.6%.Even with limited labels,SSL is still accurate to 91.8%.It can be concluded that the DTA method considerably enhances the performance of galaxy classification by introducing unlabeled data when there is a limited amount of labeled data available.The performance of supervised classification gradually improves as the quantity of labeled samples rises,eventually producing results comparable to those of semisupervised classification.
The trends in accuracy and F1-score with regard to the quantity of labeled samples are depicted in Figures 6 and 7,respectively.For supervised learning, its performance is significantly affected by the number of tags.Due to the fact that SSL may fully utilize unlabeled data, its performance is typically consistent.There is a slight but not appreciable improvement in performance when labeled data increase from 500 to 5000.

Figure 5.Flowchart of data enhancement.The image is initially randomly rotated and flipped.Then,a jittered central crop of variable size is applied to the image.The brightness, contrast, saturation and color of the cropped image are then altered.Finally, the image is resized to 98×98×3 pixels and subjected to horizontal or vertical translation.

Table 3 Comparisons of DTA Algorithm and Supervised Method (EfficientNet-G3) Utilizing Various-sized Labeled Datasets
4.2.Comparison of DTA Algorithm with Other Semi-Supervised Algorithms
We chose six popular SSL algorithms for the experiment,including FixMatch, MixMatch, ReMixMatch, Adsh, Flex-Match and DARP, for comparison.The comparative experimental results, as shown in Tables 4 and 5, respectively,display the accuracy and F1-score of each model in the galaxy classification task.As shown in Figures 8 and 9, a visual comparison of the results has been provided for a more intuitive understanding.Overall, the DTA algorithm exceeds all other examined algorithms in terms of accuracy and F1-score on most data scales.

Figure 6.Changes in accuracy of Supervised Learning and DTA with size of the labeled data set.The horizontal axis represents the size of the labeled data set, while the classification performance accuracy is represented by the vertical axis.

Table 4 The Classification Accuracy of the DTA Algorithm and other Semi-supervised Algorithms with Different Sizes of Labeled Dataset with Highest Values in Bold

Table 5 Classification F1-scores of the DTA Method and other Semi-supervised Algorithms for Different Sized Labeled Datasets with Highest Values in Bold

Figure 7.Changes in F1-score of Supervised Learning and DTA with size of the labeled data set.The horizontal axis represents the size of the labeled data set, while the classification performance F1-score is represented by the vertical axis.
When the labeled data size is 100, the MixMatch algorithm has the best accuracy and F1-score, but as the galaxy data volume keeps increasing, the F1-score of MixMatch drops sharply.Figure 10 presents the recall rates of MixMatch on each galaxy category under different data scales.MixMatch adopts an aggressive data augmentation strategy, thus introducing more noise to the training set.For most categories with abundant samples, they are less affected by the noise,while for minority categories with fewer samples, the noise leads to a significant performance drop in classification.As the galaxy data volume rises, the classification accuracy gap between minority and majority categories enlarges, and the recall rate for the least populated cigar-shaped smooth galaxies shows a downward trend, reaching 0 recall rates at scales of 1000,2500 and 5000.Therefore,although MixMatch performs the best at a data volume of 100, it does not generalize well to other data scales for galaxy morphology classification.This problem is caused by the MixMatch algorithm itself, which adds a lot of noise to the training set by using different random data augmentations on the same unlabeled data.Because the training strategies of MixMatch and ReMixMatch rely heavily on data augmentation, and their predictions need to be fused from multiple random augmentations of the same image, we keep the original data augmentation methods for MixMatch and ReMixMatch.All of the other algorithms employed in the study used the same data augmentation technique for the comparative analysis.

Figure 8.Accuracy changes with the size of labeled data sets for seven semisupervised methods.The horizontal axis represents the size of the labeled data set used during model training,and the vertical axis represents the classification performance accuracy.Different lines signify different algorithms.
When the labeled data size is 250,DTA achieves the highest F1-score and its accuracy is second only to the MixMatch algorithm.At a data size of 5000,DTA’s F1-score is 1%lower than that of FlexMatch, but its accuracy reaches the highest at 95.6%.Across all data scales, DTA’s accuracy and F1-score are higher than those of FixMatch, ReMixMatch, Adsh, and DARP algorithms.Meanwhile, the accuracy of DTA and FlexMatch steadily increases as labeled data size grows,which closely relates to the change of F1-score, and DTA’s accuracy outperforms that of FlexMatch at all scales.As a result,DTA is a semi-supervised algorithm with good generalizability for classifying galaxy morphology.

Figure 9.F1-score changes with the size of labeled data sets for seven semisupervised methods.The horizontal axis represents the size of the labeled data set used during model training, and the vertical axis signifies the classification performance F1-score.Different lines stand for different algorithms.

Figure 10.Variation in the MixMatch algorithm’s recall rate for various galaxy categories at various labeled data sizes.Different lines indicate various galaxy categories.
4.3.Visualization Analysis of DTA Algorithm and Other Algorithms
As the algorithm designed in this article is based on the FixMatch algorithm, the fixed threshold is optimized to a dynamic threshold to address the performance deterioration brought on by data imbalance.Therefore, our primary interest is investigating how dynamic thresholds affect classification improvement.Figure 11 shows the confusion matrices on the validation set for DTA and other algorithms when the labeled data size is 1000.In the confusion matrix, the proportion of accurate predictions is represented by the diagonal line where the true labels and predicted labels coincide,and the proportion of inaccurate predictions is represented by the other values in the confusion matrix.The confusion matrix of FixMatch in Figure 11 illustrates that FixMatch exhibits a classification accuracy bias in galaxy classification tasks,with the least cigarshaped smooth galaxies performing poorly.With 82.76% of cigar-shaped smooth galaxies misclassified as edge-on galaxies and 6.9% misclassified as in-between smooth galaxies, cigarshaped smooth galaxies are frequently mistaken for the more common edge-on and in-between smooth galaxies.Among them, edge-on galaxies are disk-shaped galaxies seen from the side, some of which have a bulge at the center, and cigarshaped smooth galaxies are a subtype of early-type galaxies,which are smooth and have small ellipticities.To avoid misclassification of cigar-shaped smooth galaxies and edge-on galaxies, this study conducted cleaning and filtering of the samples to obtain clean samples and ensure the correct use of manually labeled categories during model training.FixMatch works badly in classifying cigar-shaped smooth galaxies,which we ascribe to the small amount of learning samples that are available for this category (only 1/6 of the edge-on galaxies).Additionally, since edge-on galaxies and cigarshaped smooth galaxies both have elliptical shapes, the two categories may be mistaken for one another if the model has insufficient training data.
To address the issue of limited learning samples for cigarshaped smooth galaxies,as shown in Figure 12(left),the DTA algorithm dynamically adjusts the pseudo-label confidence threshold for each category during the SSL process.The threshold for cigar-shaped smooth galaxies is significantly lowered.As a result, as shown in Figure 12 (right), more pseudo-labeled learning samples of cigar-shaped smooth galaxies are introduced during the model training process,thereby improving the classification performance for cigarshaped smooth galaxies.The proposed DTA algorithm significantly increases the biased classification issue in FixMatch, as seen in the confusion matrix of DTA in Figure 11 by improving the accurate classification rate of cigar-shaped smooth galaxies by 37.94%.Along with improvements in cigar-shaped galaxy classification, there have also been advancements in the classification accuracy of in-between smooth galaxies.The above analysis demonstrates that the DTA algorithm has a more unbiased classification accuracy.
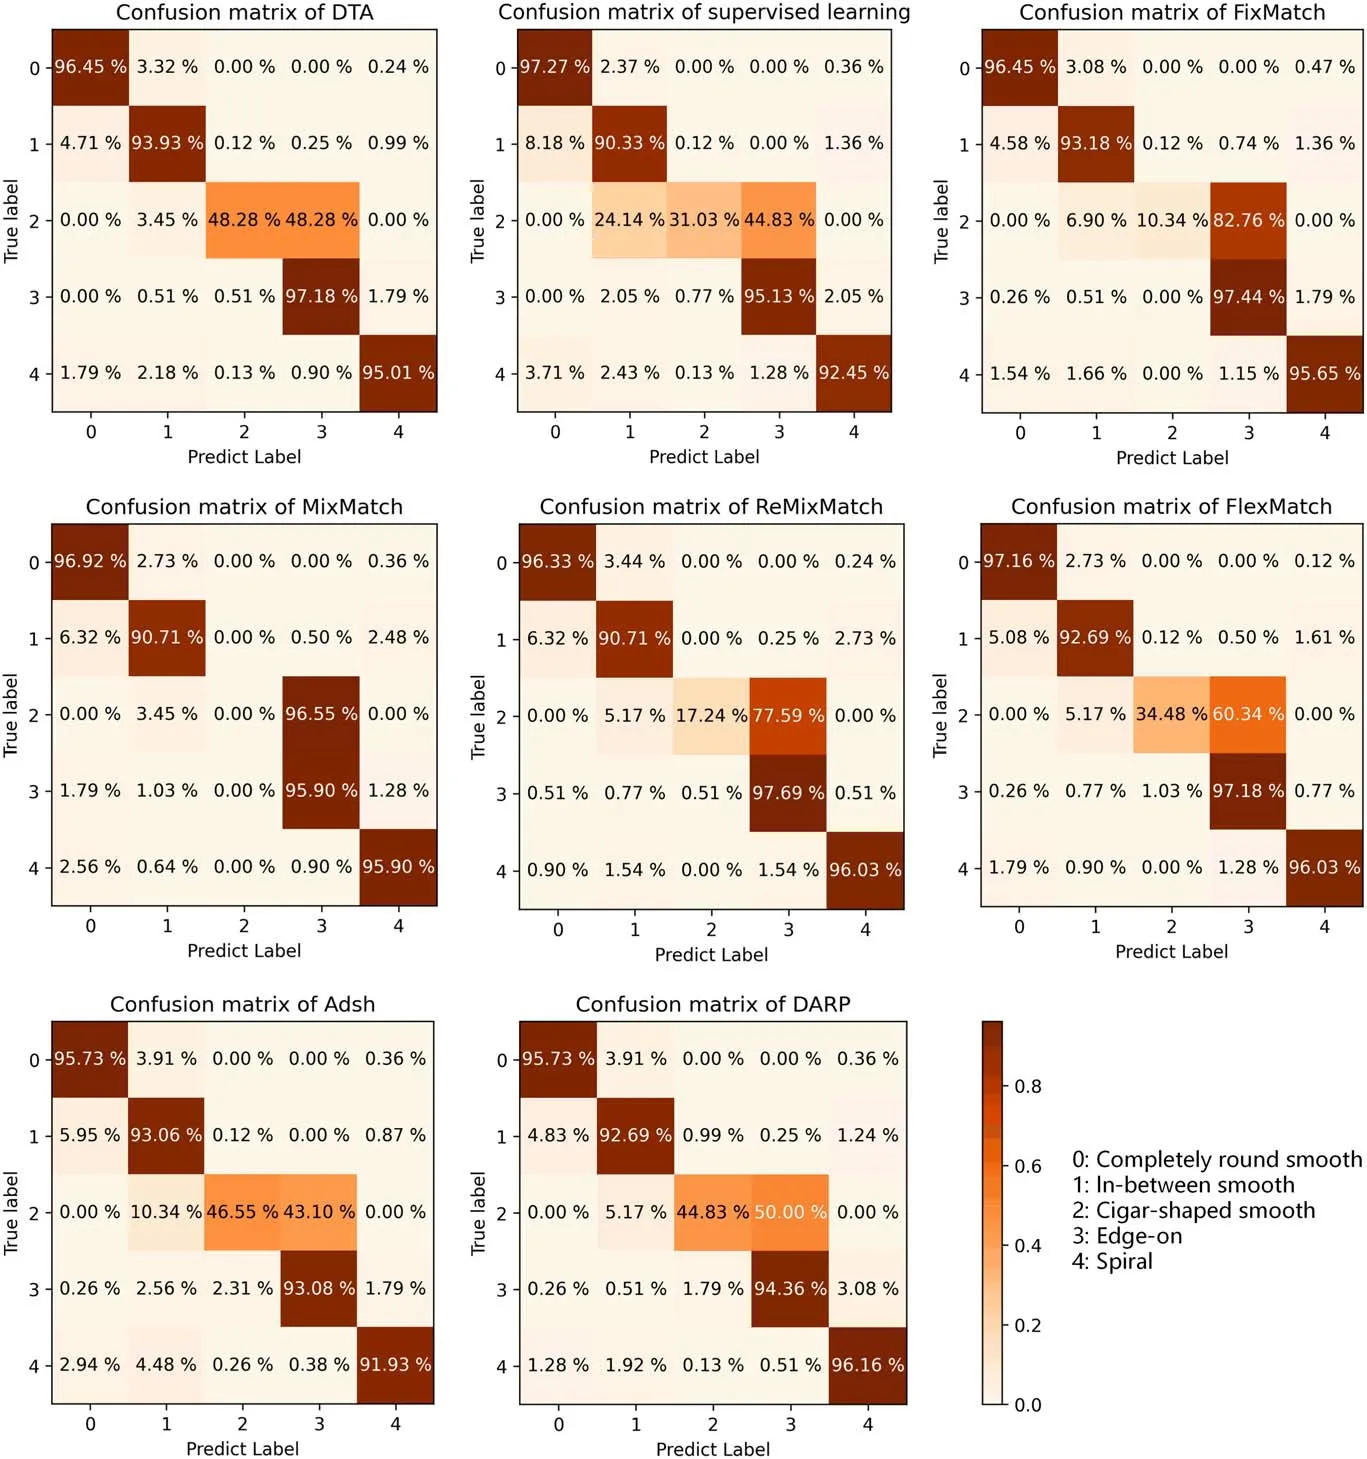
Figure 11.Confusion matrices on the validation data set for DTA and other methods.The predicted proportions are represented by the percentages in the matrix.Each galaxy category, completely round smooth, in-between smooth, cigar-shaped smooth, edge-on and spiral galaxies, is designated by the coded values 0–4.
When comparing the DTA algorithm’s classification performance with that of other algorithms across different galaxy categories, as affirmed in Figure 11, the DTA algorithm outperformed all other algorithms, with a classification accuracy of 48.28%, in the minority class of cigar-shaped smooth galaxies.The DTA algorithm also performed well on other categories of majority galaxies,such as completely round smooth galaxies, where its classification accuracy was higher than that of the ReMixMatch, Adsh and DARP algorithms,reaching 96.45%; in-between smooth galaxies, where it was higher than that of all comparison algorithms, reaching 93.93%; and edge-on galaxies, where it was higher than that of supervised learning, MixMatch, Adsh and DARP algorithms, reaching 97.18%; for spiral galaxies, where it was higher than that of supervised learning and Adsh algorithms,reaching 95.01%.As a result, across all galaxy categories, the DTA algorithm can obtain good classification performance.
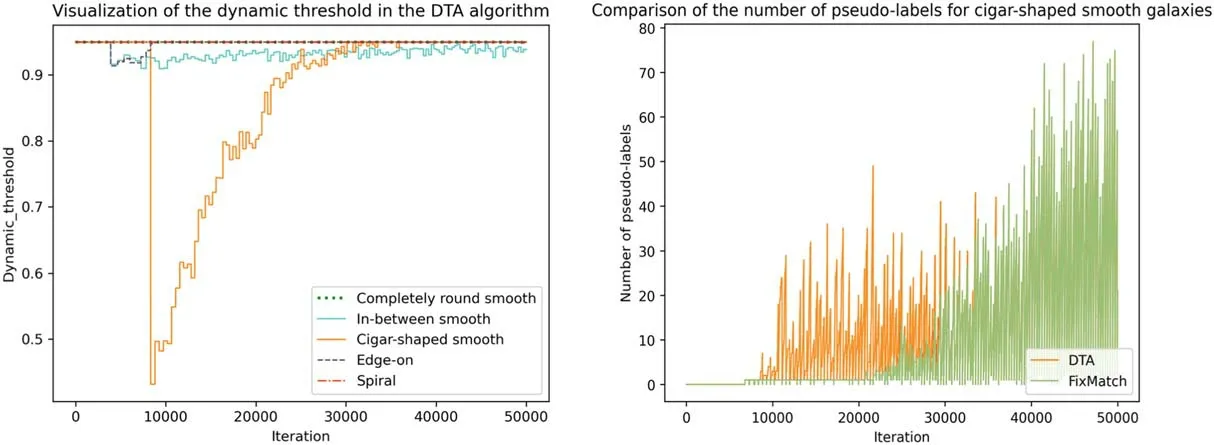
Figure 12.The dynamic threshold and quantity of pseudo-labels vary across iterations.The left graph shows the DTA algorithm’s threshold modifications for various training iterations for different galaxy classifications.The horizontal axis represents the number of iterations in the experiment, while the vertical axis signifies the confidence threshold of pseudo-labels.Different lines represent different types of galaxies.The right graph compares the quantity of pseudo-labels generated by the FixMatch algorithm vs.the DTA algorithm for cigar-shaped smooth galaxies.The vertical axis indicates the quantity of pseudo-labels utilized for cigar-shaped smooth galaxies throughout the model training process, while the horizontal axis indicates the quantity of experimental iterations.
We created a graph showing the change of thresholds versus the number of iterations to explore deeper into the effect of dynamic thresholds on the number of various types of pseudolabels.The dynamic threshold adjustments in the DTA method are displayed in Figure 12 (left).Different lines represent different kinds of galaxies, and the vertical axis signifies the filtering threshold of pseudo-labels.In the early stages of semisupervised training,the DTA algorithm lowers the threshold for cigar-shaped smooth galaxies, which introduces more learning samples (Figure 12 right).The model’s performance has increased as a result of more training samples being included.Analysis reveals that the DTA technique is based on the distribution of samples in various categories, dynamically altering thresholds to make the training samples of each category effectively balanced, enabling the accuracy of each category to be balanced.
5.Conclusions
This study addresses how SSL is used to classify galaxies and proposes the DTA algorithm to deal with the issue of data imbalance.The DTA algorithm implements dynamic thresholds as opposed to the constant threshold of the FixMatch algorithm to improve learning of minority classes in semisupervised training.Based on the distribution of labeled data,the DTA algorithm calculates the classification performance of each type of galaxy data.The DTA algorithm aligns the classification performance of each category of galaxy data with the most prevalent class,and each class’s dynamic threshold is established by the total amount of added pseudo-labels.The experimental results demonstrated that the DTA method outperforms supervised learning and other well-known semisupervised algorithms like FixMatch and MixMatch in terms of enhancing classification performance and lowering classification accuracy bias for various classes.Since there are a lot of unlabeled data in large sky survey projects,the proposed DTA technique is very important for the application of galaxy morphology classification.
The DTA algorithm differs from other semi-supervised algorithms like DARP,ABC and Adsh in that it does not need to take the distribution of unlabeled data into account,preventing the interference brought on by incorrectly estimating the distribution of unlabeled data during semi-supervised training.The DTA algorithm considers how the distribution of labeled data affects the accuracy of fictitious labels for unlabeled data.By taking into account the distribution of labeled data and the percentage of trustworthy pseudo-labels of the most prevalent class,the dynamic threshold for each class is determined.
Although the DTA algorithm considerably enhances the classification performance of classes with only a few samples,the accuracy of classes with small samples is still inferior to that of classes with more samples due to the limited number of samples.In order to achieve the same learning effect for classes with a small number of samples as for the class with the most samples, we will therefore concentrate on promoting the learning of classes with a small number of samples in our future work, such as by introducing a Generative Adversarial Network.
Acknowledgments
This work was supported by China Manned Space Program through its Space Application System,and the National Natural Science Foundation of China(NSFC,grant Nos.11973022 and U1811464),and the Natural Science Foundation of Guangdong Province (No.2020A1515010710).
ORCID iDs
Jinqu Zhang https://orcid.org/0000-0001-6643-4053
 Research in Astronomy and Astrophysics2023年11期
- Research in Astronomy and Astrophysics的其它文章
- Photometric and Spectroscopic Study of Two Low Mass Ratio Contact Binary Systems: CRTS J225828.7-121122 and CRTSJ030053.5+230139
- Injection Spectra of Different Species of Cosmic Rays from AMS-02, ACECRIS and Voyager-1
- The AIMS Site Survey
- A High-Temperature Superconducting Wideband Bandpass Filter at the L Band for Radio Astronomy
- Modified Masses and Parallaxes of Close Binary Systems: HD 39438
- Detecting HI Galaxies with Deep Neural Networks in the Presence of Radio Frequency Interference
