Galaxy Interactions in Filaments and Sheets: Insights from EAGLE Simulations
Apashanka Das, Biswajit Pandey, and Suman Sarkar
1 Department of Physics, Visva-Bharati University, Santiniketan, Birbhum, 731235, India; a.das.cosmo@gmail.com, biswap@visva-bharati.ac.in
2 Department of Physics, Indian Institute of Science Education and Research Tirupati, Tirupati—517507, India
3 Department of Physics, Indian Institute of Technology Kharagpur, Kharagpur, 721302, India; suman2reach@gmail.com
Abstract We study the color and star formation rates of paired galaxies in filaments and sheets using the EAGLE simulations.We find that the major pairs with pair separation <50 kpc are bluer and more star-forming in filamentary environments compared to those hosted in sheet-like environments.This trend reverses beyond a pair separation of ∼50 kpc.The interacting pairs with larger separations (>50 kpc) in filaments are on average redder and low-star-forming compared to those embedded in sheets.The galaxies in filaments and sheets may have different stellar mass and cold gas mass distributions.Using a KS test, we find that for paired galaxies with pair separation <50 kpc, there are no significant differences in these properties in sheets and filaments.The filaments transport gas toward the cluster of galaxies.Some earlier studies find preferential alignment of galaxy pairs with the filament axis.Such alignment of galaxy pairs may lead to different gas accretion efficiency in galaxies residing in filaments and sheets.We propose that the enhancement of star formation rate at smaller pair separation in filaments is caused by the alignment of galaxy pairs.A recent study with SDSS data reports the same findings.The confirmation of these results by the EAGLE simulations suggests that the hydrodynamical simulations are powerful theoretical tools for studying galaxy formation and evolution in the cosmic web.
Key words: methods: data analysis – methods: statistical – galaxies: evolution – galaxies: interactions –(cosmology:) large-scale structure of universe
1.Introduction
Galaxies are the fundamental units of the observed largescale structures in the Universe.Understanding their formation and evolution is one of the primary goals of modern cosmology.The growth of primordial density perturbations via gravitational instability eventually leads to the formation of dark matter halos.Dark matter halos represent peaks in the density field.The halos are surrounded by a diffuse neutral hydrogen distribution after the recombination.They accrete the gas, a process which radiates away their kinetic energy and causes gas to settle down at their centers.The cooling and condensation of gas at the centers of these halos are believed to be the primary mechanism for galaxy formation (Silk 1977;White & Rees 1978).
The formation and evolution of galaxies are expected to be influenced by both the initial conditions at the location of their formation and their interactions with the surrounding environment.Galaxies interact with other galaxies in their neighborhood.The galaxy-galaxy interactions are known to amplify the star formation rate (SFR) in galaxies (Barton et al.2000;Nikolic et al.2004;Woods&Geller 2007;Ellison et al.2010;Patton et al.2011).The environments of galaxies have crucial roles in their evolution.The colors and SFRs of galaxies are strongly affected by the local density of their environment(Gómez et al.2003; Lewis et al.2002).The galaxies become redder and low-star-forming in the higher density environments(Kauffmann et al.2004).The suppression of star formation can be driven by different physical mechanisms.Ram pressure stripping is a common phenomenon in galaxy clusters(Gunn&Gott 1972).Galaxies in high density regions are more likely to encounter harassment (Moore et al.1996, 1998), starvation(Larson et al.1980;Somerville&Primack 1999),strangulation(Gunn & Gott 1972; Balogh et al.2000) and gas expulsion by supernovae, AGN or stellar winds (Cox et al.2004; Murray et al.2005; Springel et al.2005).Star formation in a galaxy may also be quenched through several other routes.The mass(Birnboim & Dekel 2003; Dekel & Birnboim 2006), morphology (Martig et al.2009), presence of a bar (Masters et al.2010) and high angular momentum (Peng 2020) can cause the star formation activity in galaxies to cease.
Many other galaxy properties depend on the environment.Elliptical galaxies are more commonly observed in dense groups and clusters (Oemler 1974; Dressler 1980; Davis &Geller 1976; Guzzo et al.1997; Goto et al.2003).Spiral galaxies mostly occupy intermediate and low density regions of the Universe.These environmental dependencies of clustering are reflected in different statistical measures such as the correlation function (Zehavi et al.2005), genus (Park et al.2005), filamentarity (Pandey & Bharadwaj 2005, 2006), local dimension (Pandey & Sarkar 2020) and mutual information(Pandey & Sarkar 2017; Bhattacharjee et al.2020; Sarkar &Pandey 2020).The environment of a galaxy is generally characterized by the local density.The local density undoubtedly plays a decisive role in galaxy evolution.However, it cannot completely characterize the environment of a galaxy.Early generation redshift surveys revealed that galaxies are part of an all-inclusive network comprising clusters, filaments and sheets surrounded by vast empty regions (Joeveer &Einasto 1978; Gregory & Thompson 1978; Einasto et al.1980; Zeldovich & Shandarin 1982).Galaxies and their host halos are embedded in different environments of the cosmic web (Bond et al.1996).Pandey & Bharadwaj (2008) find that star-forming blue galaxies trace a more filamentary distribution compared to red galaxies.More than 80% of the baryonic budget in the Universe is accounted for by low density gas(warm-hot intergalactic medium,WHIM)in filaments(Tuominen et al.2021;Galarraga-Espinosa et al.2021).Consequently,the gas accretion efficiency of dark matter halos in different environments may differ in a significant manner.Thus, the cosmic web can have a significant impact on the galaxy properties and their evolution.The galaxies that are located in different parts of the cosmic web can experience different physical conditions,such as different densities of gas,different levels of tidal forces, and different frequencies of interactions and mergers.
The interactions between galaxies with comparable masses are known as major interactions.Such interactions trigger new star formation in galaxies.Interacting pairs can be hosted in different morphological environments of the cosmic web.Galaxy pairs are more frequently observed in denser regions.The filaments and sheets, being the denser parts of the cosmic web, can host a significant number of major galaxy pairs.In a recent work, Das et al.(2023) analyze Sloan Digital Sky Survey (SDSS) data to compare the SFR and color of major pairs hosted in filaments and sheets.They find that the major galaxy pairs with separation <50 kpc are relatively high starforming and bluer when hosted in filaments.Contrarily, the major pairs at separations larger than 50 kpc show a significantly higher SFR and bluer color in sheet-like environments.This behavior may be related to the preferential alignment of galaxy pairs with the filament axis reported in a number of recent works (Tempel & Tamm 2015; Mesa et al.2018).Star formation in a galaxy is primarily regulated by its available gas mass.The inflows and outflows (Dekel et al.2009;Davé et al.2012)can significantly modulate the gas mass in a galaxy.Transient events like interactions and mergers can drive the galaxies out of equilibrium.The alignment of galaxy pairs with filament spines may lead to anisotropic accretion and higher gas accretion efficiency in these galaxies.In this work,we intend to verify these findings using hydrodynamical simulations.
The Evolution and Assembly of GaLaxies and their Environments (EAGLE) simulation (McAlpine et al.2016) is a hydrodynamical simulation that studies the galaxy formation and evolution in a cosmological volume.It describes the formation of galaxies by gas falling into dark matter halos and their subsequent cooling and condensation.It would be interesting to study the color and SFR in major pairs in filaments and sheets using EAGLE simulations.In observations, galaxy pairs are usually identified by applying simultaneous cuts on the projected separation and the velocity difference of the galaxies in the rest frame.However, all these pairs may not be undergoing interactions.Some of the pairs identified in observations may not be close in three-dimensions due to chance superpositions in high-density regions like groups and clusters (Alonso et al.2004).Also, we cannot construct a mock catalog for the observational sample of galaxy pairs used in Das et al.(2023)due to the smaller volume of the EAGLE simulations.So, we decided to use the real-space positions of galaxies available in simulation to identify the major pairs.This would avoid any errors in identification of galaxy pairs due to the projection effects.We identify the geometric environments of galaxy pairs using the local dimension (Sarkar & Bharadwaj 2009).Our primary aim of this work is to study interaction induced star formation in filaments and sheets using EAGLE simulations.This would help us to assess the roles of filaments and sheets in galaxy evolution.
We organize the structure of the paper as follows: we describe the data and method of analysis in Section 2 and present the results and conclusions in Section 3.
2.Data and Method of Analysis
2.1.EAGLE simulation data
The EAGLE simulation (McAlpine et al.2016) is a set of cosmological hydrodynamical simulations in periodic, cubic comoving volumes ranging from side of length 25 to 100 Mpc.Such a simulation tracks the evolution of both baryons and dark matter in the Universe from a redshift of 127 to 0.The simulation adopts a flat ΛCDM cosmology with ΩΛ=0.693,Ωm=0.307, Ωb=0.04825 and H0=67.77 km−1s−1Mpc−1(Planck Collaboration et al.2014).

We determine the morphological environment of the galaxies in the EAGLE simulation by estimating their local dimension (Section 2.2).We use GalaxyID to cross match these galaxies with our pair sample.The cross-matching yields a total of 2537 galaxies in major pairs.We find that 373 and 276 out of these galaxies are residing in filaments and sheetsrespectively.It may be noted that we cannot determine the local dimension of all the galaxies in the simulation.

Table 1 This Table Shows the Definition of Different Geometric Environments Based on the Local Dimension (D) of the Galaxies
2.2.Geometry of the Local Environment
We characterize the different geometric environments of the cosmic web using the local dimension (Sarkar & Bharadwaj 2009).The local dimension is a simple measure based on the galaxy counts within spheres of different radii centered on a galaxy.The galaxy counts within a sphere of radius R centered on a galaxy can be written as,
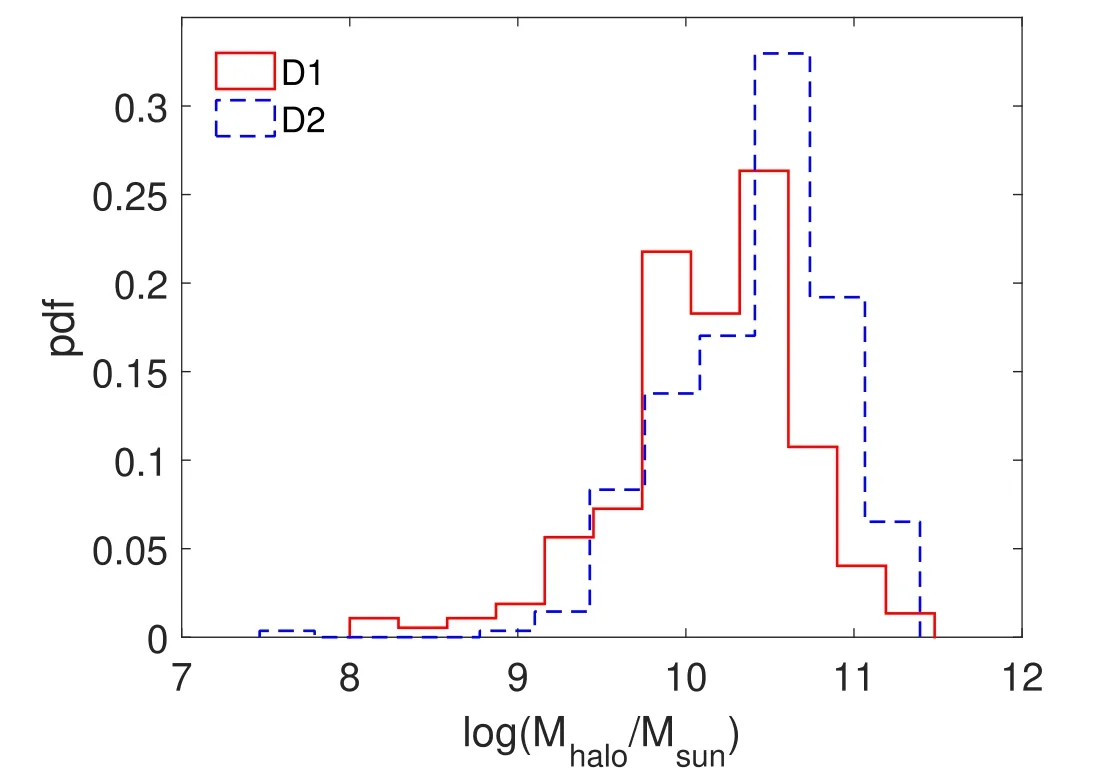
where D is the local dimension and A is an arbitrary constant.The number counts N( The local dimension D describes the morphology of the embedding environment.Ideally, a filamentary environment should have D=1 and a sheet-like environment should have D=2.A homogeneous distribution in three-dimensions is represented by D=3.However, the filaments, sheets, clusters and voids are not idealized structures and they can have a wide variety of shapes and sizes.Each geometric environment is assigned a range of local dimension as listed in Table 1.A nearly straight filament is represented by a D1 type environment.Similarly, a D2 type environment represents a twodimensional sheet-like structure.A D3 type environment is embedded in a 3D distribution with a homogeneous nature.The galaxies can also reside near the junction of different types of morphological environments.D1.5 and D2.5 can be treated as intermediate environments. Figure 1.The left panel of this figure plots the cumulative mean u–r color as a function of pair separation for major pairs residing in D1 and D2 type environments.The right panel displays the cumulative mean SFR for the same pairs in two different environments.We use 10 Jackknife samples to estimate the 1σ error bars shown at each data point. The cumulative mean of the u–r color for the major galaxy pairs as a function of the pair separation is plotted in the left panel of Figure 1.We compare the results for the major pairs in filaments and sheets in the same panel. This affirms that the major pairs with pair separation r<50 kpc are on average bluer in a filamentary environment compared to those residing in a sheet-like environment.However, this trend only persists up to a pair separation of∼50 kpc.A crossover of the two curves corresponding to D1 and D2 type environments is observed at r ∼50 kpc.The major pairs with pair separation r>50 kpc are significantly redder in filaments compared to those located in sheets.We also analyze the SFR in major pairs residing in filaments and sheets and show the results in the right panel of Figure 1.We find that the major pairs at closer pair separation(<50 kpc)in filaments are comparatively more star-forming than those located in sheets.We see an exactly opposite trend for the major pairs with larger pair separation (>50 kpc).The colors of the galaxies are strongly correlated with their SFR (Baldry et al.2009) and the results depicted in the two panels of Figure 1 are consistent with each other.It is also interesting that the crossover is observed at nearly the same pair separation(∼50 kpc)for both color and SFR.We estimate the 1σ error bars at each pair separation using 10 Jackknife samples drawn from the original data sets. The stellar mass (Birnboim & Dekel 2003; Dekel &Birnboim 2006; Bamford et al.2009) and the available cold gas mass content (Saintonge et al.2012; Violino et al.2018;Thorp et al.2022) also play a very important role in deciding the SFR in galaxies.We test if the differences occurring in u–r color and SFR of galaxies in major pairs residing in D1 and D2 type environments arise due to the differences in their stellar mass and cold gas content.We apply a Kolmogorov-Smirnov(KS) test to compare the distributions of stellar mass and cold gas mass of major paired galaxies in D1 and D2 type environments.The probability distribution functions of the two properties in D1 and D2 type environments are visualized in the two panels of Figure 2.We first carry out the test for the major pairs with all possible pair separations.We then conduct separate tests for the major pairs with pair separation >50 kpc and <50 kpc.The results for the KS test are tabulated in Table 2.We note that the null hypothesis for all the major pairs can be rejected at the 90%and 99%confidence levels for stellar mass and cold gas mass respectively.This implies that the stellar mass distribution of galaxies in major pairs residing in D1 and D2 type environments is likely to be drawn from the same parent population.However, the galaxies in major pairs from filaments and sheets have a significantly different cold gas mass distribution.We also arrive at the same conclusions for the major pairs with r>50 kpc.Interestingly,the results for the major pairs with r<50 kpc suggest that the null hypothesis for stellar mass can be rejected at a very low confidence level(<60%), whereas for cold gas mass, it can be rejected at the≤90% confidence level.Thus, stellar mass of major pair galaxies with r<50 kpc in D1 and D2 type environments is highly likely to be drawn from the same underlying population.This clearly shows that stellar mass and available cold gas mass of the paired galaxies are not responsible for the differences observed in their u–r color and SFR in D1 and D2 type environments at smaller pair separations (r<50 kpc). Figure 2.The left panel displays the probability distribution function of log( M s tellar Msun )for major pairs in D1 and D2 type environments.The right panel features the probability distribution function of Masscoldgas for the same pairs. Table 2 This Table Shows the Summary of the Kolmogorov–Smirnov Tests carried out for a Comparison of log( M s tellar Msun )and Masscoldgas of major pairs in filaments and sheets Each galaxy is believed to have formed within a dark matter halo.The properties of the galaxy are expected to be intimately connected to the mass of the dark matter halo.In fact,the mass of the dark matter halo is believed to be the most important parameter that determines the properties of a galaxy(Corray&Sheth 2002).The amount of substructures in dark matter halos increases with increasing halo mass (Gao et al.2004; Pandey et al.2013).There are observational evidences in favor of the correlations between substructure and star formation fraction in galaxy clusters (Bravo-Alfaro et al.2009; Cohen et al.2014).Substructures can also influence the stellar population in the galaxy (Helmi 2020).We depict the distributions of halo masses in the paired galaxies in filaments and sheets in Figure 3.The halo masses are obtained within the same aperture as the galaxies.We perform a KS test to find that the halo mass distributions of the paired galaxies in sheets and filaments are significantly different(Table 3).We ascertain that the halo masses of the paired galaxies in sheets are relatively more massive than those residing in the filaments.The effects of the halo mass may also come from the virial shock heating of the halo gas that becomes important at masses greater than 1012MSun(Birnboim & Dekel 2003).Such heating can suppress the supply of cold gas by preventing cold streams from the intergalactic medium.However, we find that none of the paired galaxies in filaments and sheets in our sample reside in such a massive dark matter halo.At low masses, the supernova feedback may expel or heat the gas reservoir and quench the star formation (Kaviraj et al.2007).The halo mass may have a role in shaping the physical properties of the galaxy pairs in filaments and sheets, but it is difficult to explain the crossovers observed in Figure 3 using these differences in the halo mass distributions. Figure 3.This figure displays the distributions of the halo mass of paired galaxies in sheets and filaments. Table 3 This Table Shows Kolmogorov–Smirnov Statistic DKS for Comparison of log( M h alo Msun )of Major Pairs Residing in D1 and D2 type Environments The filaments appear at the intersection of sheets and are generally denser compared to the sheets.Studies with N-body simulations suggest a successive flow of matter from voids to sheets,sheets to filaments and filaments to clusters(Ramachandra & Shandarin 2015; Galárraga-Espinosa et al.2023).A number of earlier studies find that the galaxy pairs are preferentially aligned with the filament axis (Tempel &Tamm 2015; Mesa et al.2018).The alignment signal is reported to be stronger for closer pairs residing near the filament spine.The anisotropic accretion along the filaments may significantly influence the gas accretion efficiency in these aligned galaxy pairs and trigger interaction induced star formation in them.Contrarily, the major pairs with r>50 kpc show less star-formation in filaments than in sheets.The filaments are generally denser than the sheets.The D1 type galaxies are embedded in a high density environment as compared to the D2 type galaxies(Pandey&Sarkar 2020).The galaxies in denser environments are known to be redder and less star-forming (Lewis et al.2002; Gómez et al.2003;Kauffmann et al.2004).So, naively one would expect the galaxies in a filamentary environment to be less star-forming and redder compared to the galaxies in a sheet-like environment.We find that this is true for the galaxies in major pairs with separation larger than 50 kpc.However, the galaxies in major pairs at closer pair separation exhibit a strikingly opposite behavior. We do not analyze the alignment of the galaxy pairs in our study.The individual sheets and filaments cannot be identified using the local dimension.We plan to carry out a detailed study of the galaxy pair alignment with different identification techniques of the cosmic web in a future work. The EAGLE simulation provides two definitions for the position of galaxies.These are based on the center of mass and the location of the minimum of the gravitational potential.The two positions do not coincide for some galaxies.In this work,we use the center of mass to define the position of galaxies.We also repeat our analysis considering the minimum of the gravitational potential as the position of a galaxy.We show the results of this analysis in Figure 4.The main findings of our analysis remain unchanged with this alternative definition of galaxy position.Further,it is important to ensure that the major pairs considered in our analysis do not belong to the galaxy groups.We measure the distances to the 5th nearest neighbors for the paired galaxies in sheets and filaments and find that ∼20% of them have their 5th nearest neighbor within a distance of 500 kpc–1 Mpc.We discard these galaxy pairs and repeat our analysis.The results of this analysis are displayed in Figure 5.We find that discarding such galaxy pairs does not alter our results. The results reported in this work are very similar to the results obtained in a recent study(Das et al.2023)of the color and SFR of major pairs in filaments and sheets using the SDSS data.Das et al.(2023) rely on a volume limited sample of galaxies (Mr≤−19) for their analysis and find a crossover in these properties at nearly the same length scale(∼50 kpc).It is interesting to note that we observe exactly the same trend in the EAGLE simulation data.This provides strong theoretical support to the observational findings that large-scale structures like sheets and filaments affect galaxy interactions.This also indicates that the galaxy properties are modulated by the geometry of their large-scale environment. Finally,we conclude that the filaments play a significant role in deciding the color and SFR in galaxies.The observed differences in the color and SFR of major pairs in filaments and sheets cannot be interpreted in terms of the differences in the local density and the stellar mass distributions.The interacting galaxy pairs with smaller pair separation can trigger star formation.The filaments provide a favorable environment for such interactions.This makes the interacting galaxies bluer in filaments compared to those found in sheets. Figure 4.Same as Figure 1 but when the galaxy positions are defined by the location of the minimum of the gravitational potential instead of the center of mass. Figure 5.Same as Figure 1 but after discarding the major pairs for which the 5th nearest neighbor lies within a distance of 500 kpc–1 Mpc. Acknowledgments B.P.acknowledges financial support from the SERB, DST,Government of India through the project CRG/2019/001110 and support from IUCAA, Pune through the associateship program.S.S.acknowledges DST, Government of India for support through a National Post Doctoral Fellowship(N-PDF). The authors acknowledge the Virgo Consortium for making their simulation data publicly available.The EAGLE simulations were performed using the DiRAC-2 facility at Durham,managed by the ICC, and the PRACE facility Curie based in France at TGCC, CEA, Bruyères-le-Châtel.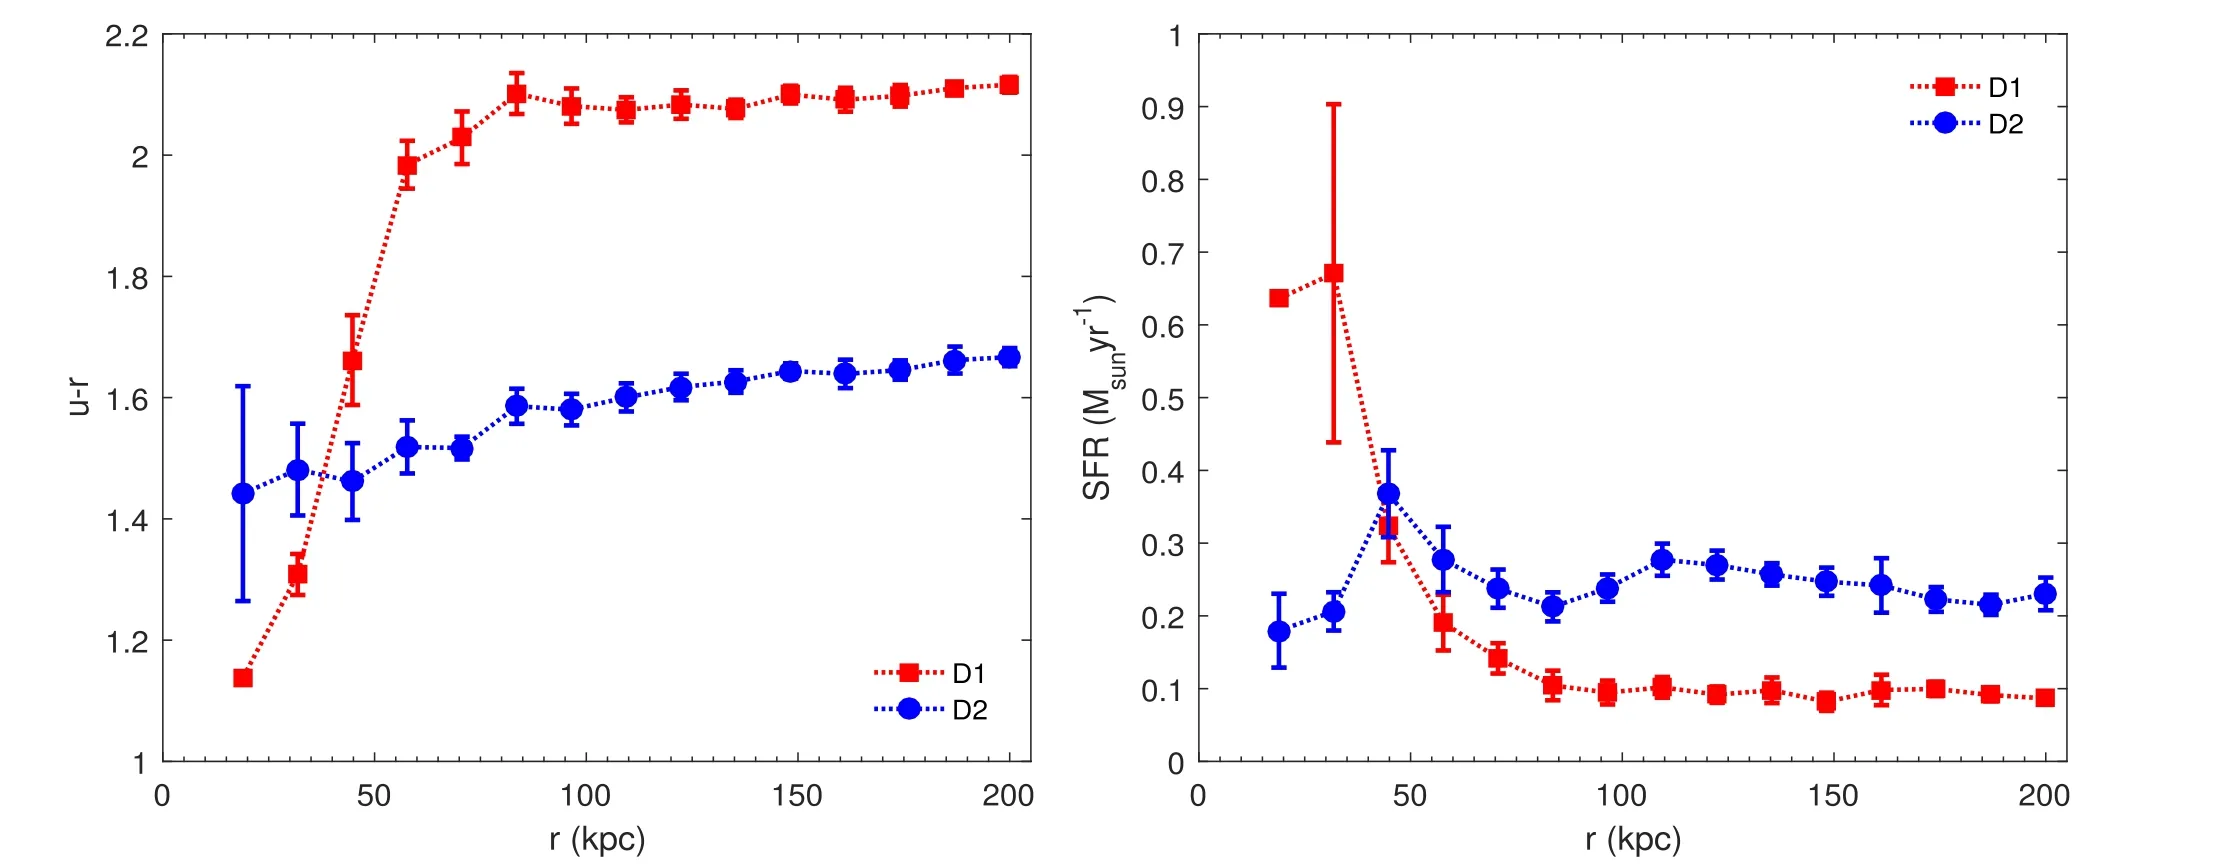
3.Results and Conclusions




 Research in Astronomy and Astrophysics2023年11期
- Research in Astronomy and Astrophysics的其它文章
- Photometric and Spectroscopic Study of Two Low Mass Ratio Contact Binary Systems: CRTS J225828.7-121122 and CRTSJ030053.5+230139
- Injection Spectra of Different Species of Cosmic Rays from AMS-02, ACECRIS and Voyager-1
- The AIMS Site Survey
- A High-Temperature Superconducting Wideband Bandpass Filter at the L Band for Radio Astronomy
- Modified Masses and Parallaxes of Close Binary Systems: HD 39438
- Detecting HI Galaxies with Deep Neural Networks in the Presence of Radio Frequency Interference
