Assessing the impact of manufacturing agglomeration on environmental pollution in Beijing-Tianjin-Hebei region using spatial panel data model
ZHANG Ting-ting
International Commercial Institute,Tianjin Foreign Studies University,Tianjin 300011,CHINA
Abstract: The Beijing-Tianjin-Hebei region is the vanguard of economic development in northern China.Its manufacturing industry is more and more developed,but environmental pollution is also more serious.Based on the data of 13 cities in Beijing-Tianjin-Hebei region from 2017 to 2021,the paper verifies the impact of manufacturing agglomeration on environmental pollution.Both manufacturing agglomeration and environmental pollution are dependent on spatial distribution.Therefore,the paper selects spatial econometric model to study.First,the spatial lag model and spatial error model are constructed,and then the spatial lag model is selected through the results of OLS regression,LM Test and Hausman test,and the empirical process is carried out.Finally,the empirical results are analyzed and the conclusion is drawn.
Key words: manufacturing agglomeration;environmental pollution;impact,Beijing-Tianjin-Hebei region
1 Introduction
The manufacturing industry is the leading part of the national economy.Beijing,Tianjin and Hebei are the traditional developed areas of China’s manufacturing industry,and have a relatively high level of manufacturing technology.In 2017,Chinese government set up Xiongan new area to undertake the non-capital functions of Beijing.In this context,industrial transfer,especially manufacturing transfer,is inevitable,and the shift of manufacturing center is often accompanied by the shift of environmental pollution center.Wen(2004)has revealed that environmental pollution can be seen as a by-product of economic growth.According to the study results of Grossman and Krueger (1995),if we want to solve environmental problems,we must solve the contradiction between industrial agglomeration and environmental protection.At the same time,referring to the economic model of Nemat (1994),we should also pay attention to the pressure of the cluster center on the surrounding environment.With the increasing environmental protection efforts,it is particularly necessary to clarify the relationship between manufacturing agglomeration and environmental pollution in Beijing Tianjin Hebei region for promoting regional economic development and protecting the local ecological environment.Therefore,this paper will study this problem.
2 Establishment of model
2.1 Variable selection and data source
Kahn (1998) decomposed the factors influencing the household level environmental in the USA that showed an almost perfect kuznets curve based on the data from 1982-1997.The factors including market openness,industrial structure and environmental regulation.Duranton,and Puga(2001) analyzed the influencing factors of environment which including economic development level of the city,manufacturing agglomeration index and technology level.(1)Explained variables:industrial waste water pollution index (IW) and Industrial SO2pollution index (IS).(2) Core explanatory variables: manufacturing agglomeration index (agg,agg2).In order to investigate whether there is a non-linear relationship between manufacturing agglomeration and environmental pollution,referring the results of Duc et al.(2007),this paper also takes the quadratic term(agg2)of manufacturing agglomeration index into the model.(3)Control variables:economic development level (pgd,pgd2),market openness (fdi),industrial structure (stru),technology level (tec),environmental regulation (er).The details are shown in Table 1.All the original data are from theChinaUrbanStatisticalYearbook,2017-2021.

Table 1 Control variable index selection and data source
2.2 Descriptive statistics of the variables
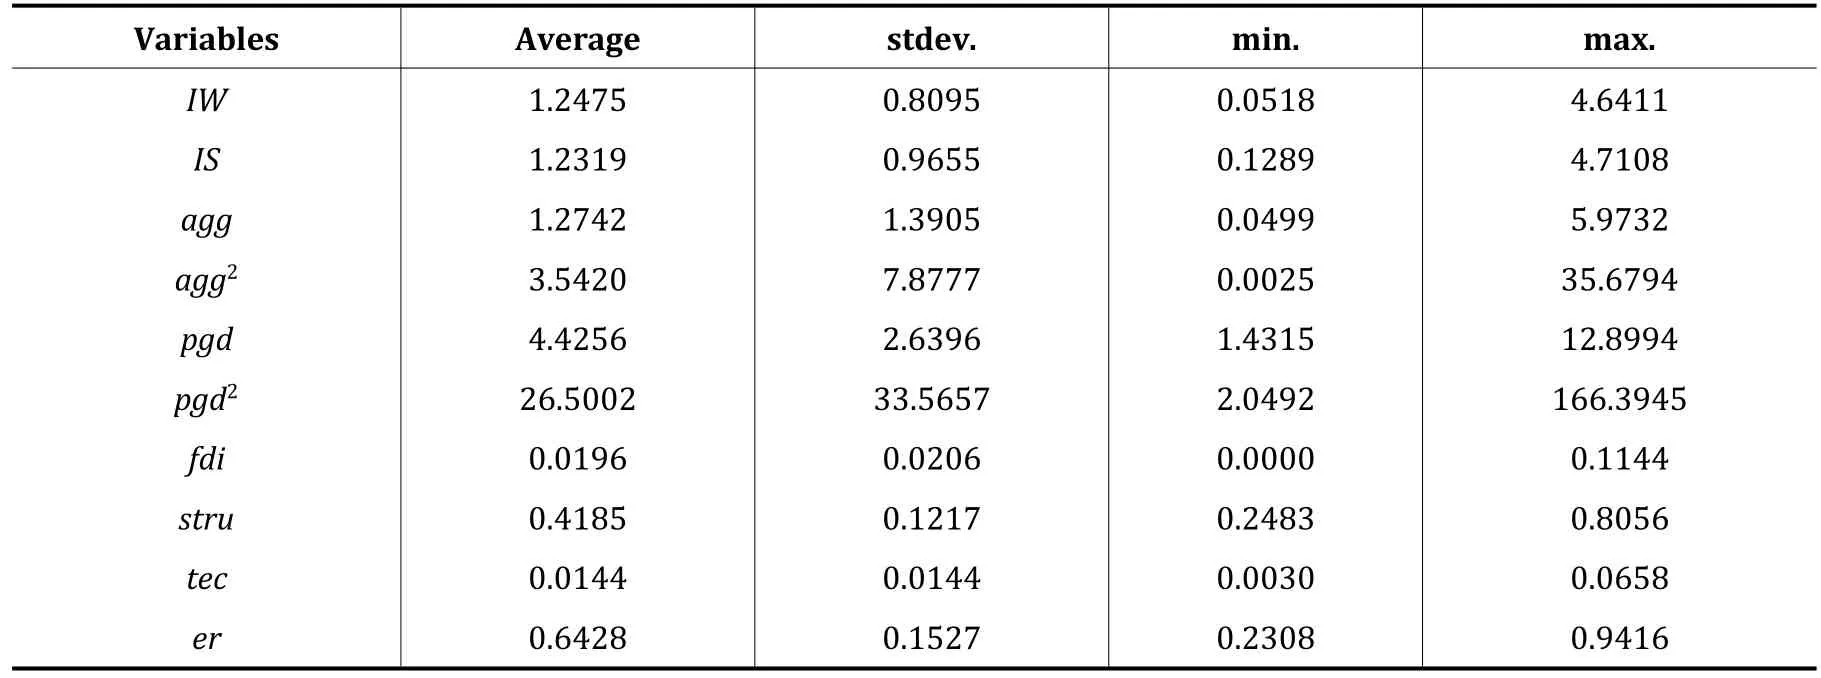
The descriptive statistical results with variables are shown in Table 2.

Table 2 Descriptive statistics of all the variables
2.3 Establishment of model
In the paper,industrial waste water pollution index(IW)and industrial SO2pollution index(IS)are taken as explanatory variables,manufacturing agglomeration index (agg) as core explanatory variables,and economic development level,market development degree,industrial structure,technological progress and environmental regulation as control variables,the econometric model is as follow formula 1 and 2.
In the formula 1 and 2,IWitis industrial waste water pollution index and ISit is industrial SO2pollution index;ρWandρsrepresent the spatial regression coefficients of industrial waste water pollution index and industrial SO2pollution index,that is,the impact of environmental pollution in adjacent areas on the region;Wis the spatial weight matrix,which is represented by 0-1 adjacency matrix.
The Spatial error model is as follows:
Among them,λWandλSare the corresponding spatial error coefficients,which reflect the influence of the error impact of the dependent variable in the adjacent area on the observed values in this area;μitis the random error term;other variables have the same meaning as the spatial lag model.
3 Empirical test and regression
3.1 OLS regression and LM test
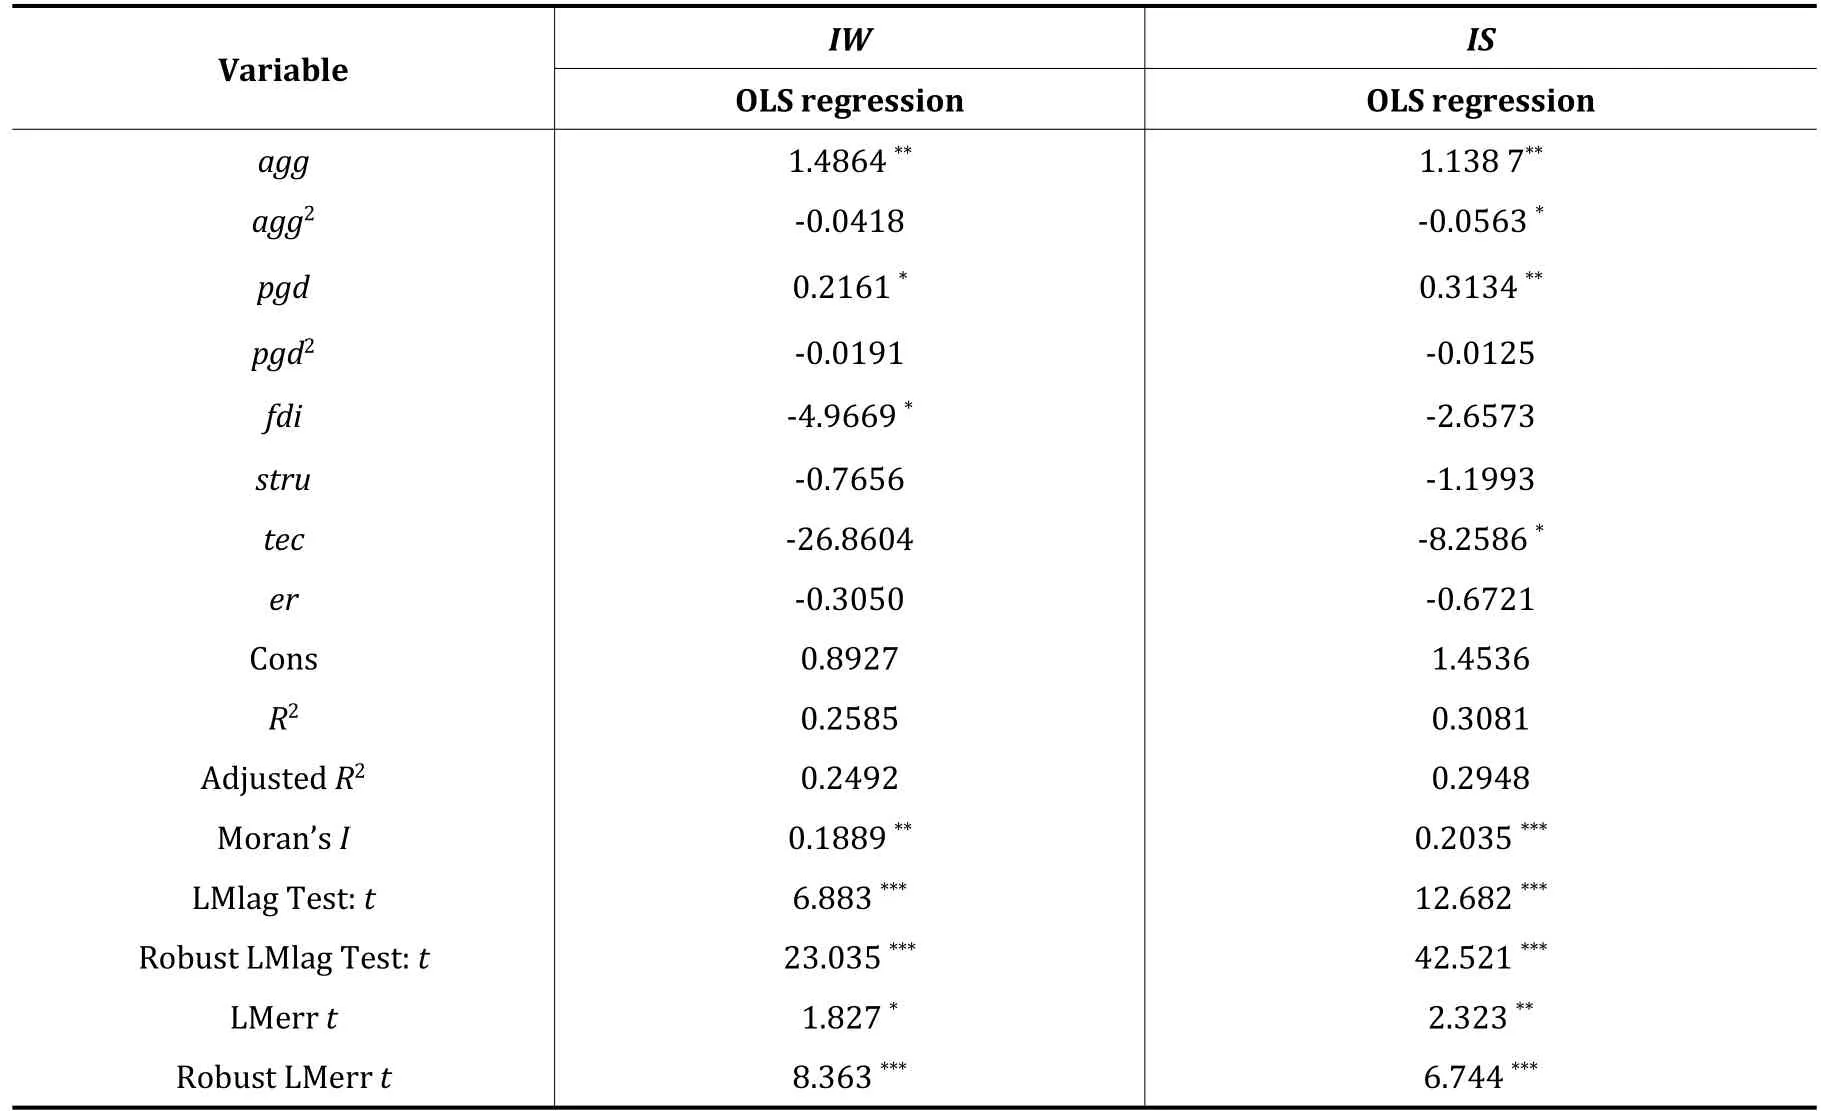
The results of OLS regression and LM test are shown in Table 3.According to Table 3,for the explained variable IW,only the AGG of manufacturing agglomeration,the pgd of economic development level and the FDI of market openness pass the significance test.The other variables are not significant,and the fitting degree is low,which is only 0.2585,but the Moran’s I index is 0.1889,which passes the 5% significance test.This shows that the impact of manufacturing agglomeration on industrial waste water pollution has a significant spatial correlation.

Table 3 The results of OLS regression and LM test
For the explained variable IS,only the parameters of agg,agg2,pgd and tec have passed the significance test.The other variables are not significant.The fitting degree is only 0.3081,but the Moran’s I index is 0.2035,which has passed the 1% significance test.This shows that manufacturing agglomeration also has spatial correlation with industrial SO2pollution.
The above results show that the ordinary least squares(OLS)regression model is not suitable for this study,but the spatial econometric model is suitable for this study.Furthermore,according to the test results of LMlag and LMerr,for the explained variable IW,LMlag is significant at the level of 5%,but LMerr is not significant at the level of 5%.Therefore,LMlag is more significant and the spatial lag model should be used.For the explained variable is,LMlag is significant at the level of 1%,but LMerr is not significant at the level of 1%,so LMlag is more significant,and the spatial lag model should also be used.
3.2 Hausman test
The results of Hausman test is shown in Table 4.

Table 4 Hausman test result
From the Hausman test results,for the explained variableIW,the test results are not significant,accept the original hypothesis,should choose random effect;for the explained variableIS,the test results are significant at the level of 1%,and the fixed effect should be selected instead of the original hypothesis.
3.3 Regression results of spatial econometric model
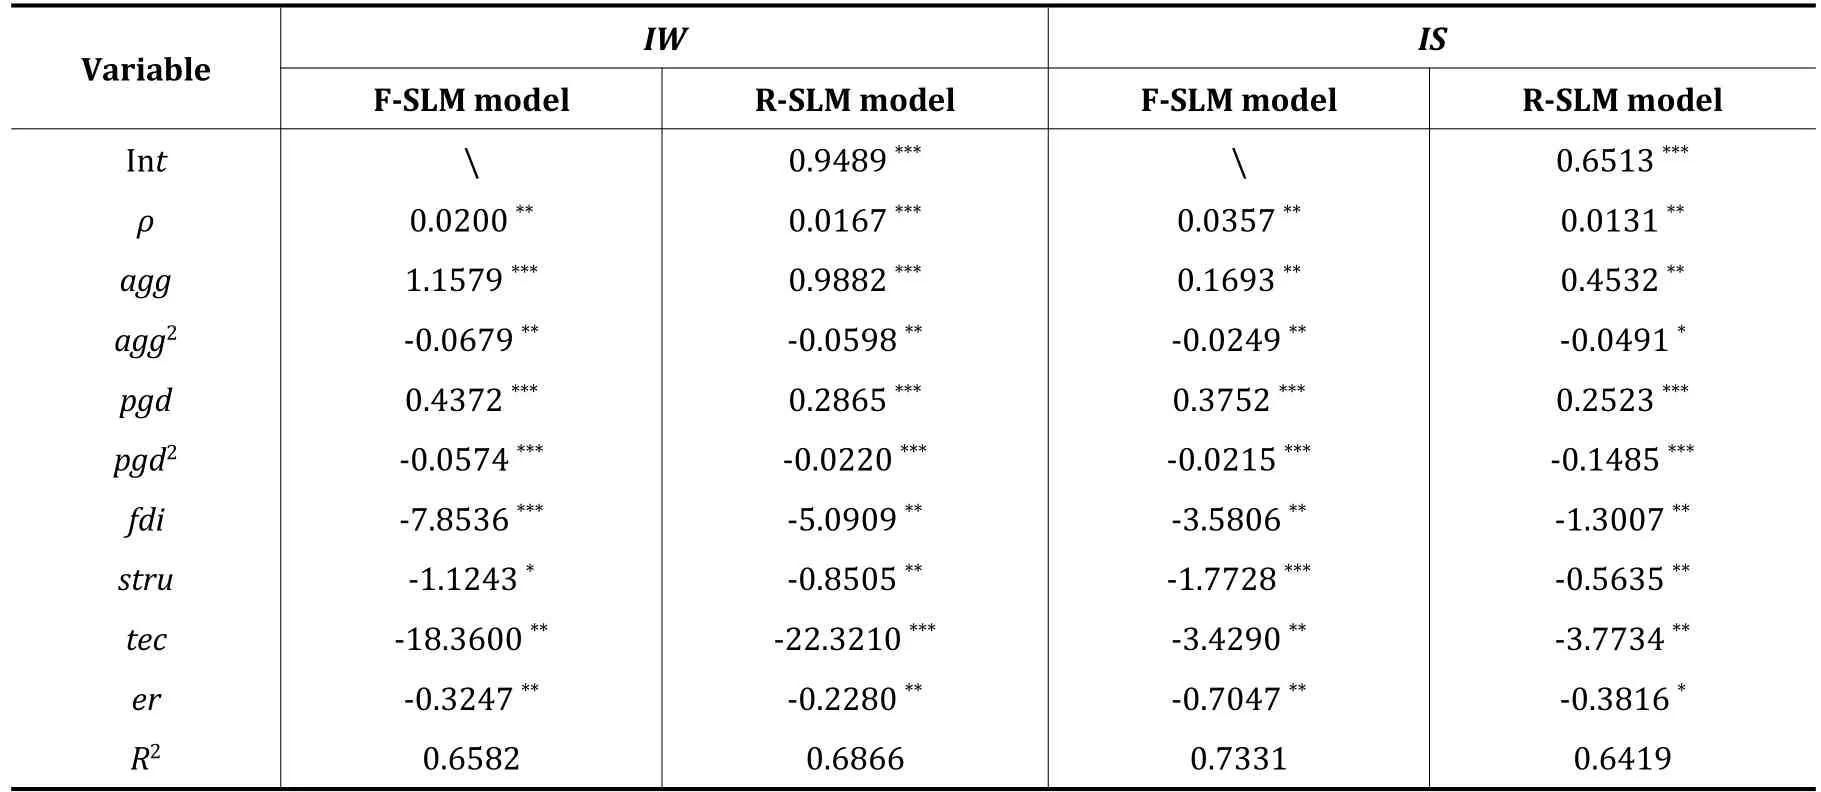
The Regression results of spatial econometric model is shown in Table 5.

Table 5 Regression results of spatial econometric model
4 Analysis of regression results
(1) The agglomeration of environmental pollution exacts.Spatial regression coefficient parameters ρ are all positive and for IW.The parametersρare passed the 1%significance level test.This shows that there is a significant spatial positive correlation between industrial waste water pollution and industrial SO2pollution in Beijing-Tianjin-Hebei region,that is,the environmental pollution in this region is affected by the environmental pollution in adjacent regions.According to the measurement results,the industrial waste water pollution index of the adjacent areas increases by 0.0167%for every 1%increase in the industrial waste water pollution index of the region,and the industrial SO2pollution index of the adjacent areas increases by 0.0357%for every 1%increase in the industrial SO2pollution index of the region.
(2) The manufacturing agglomeration helps to improve the environment.For IW,parameter agg passed 1%significance level test,parameter agg2passed 5%significance level test,and for is,parameter agg and agg2passed 5% significance level test.This shows that there is an inverted U-shaped relationship between manufacturing agglomeration,industrial waste water pollution and industrial SO2pollution in Beijing Tianjin Hebei region during the sample period.At the beginning of this period,manufacturing agglomeration has a negative impact on the environment,but when the level of manufacturing agglomeration reaches a certain stage,it will have a negative impact on the environment.
(3) The environmental quality will eventually improve with economic development.The parameter estimates of the first term pgd and the second term pgd2of the economic development level are both positive and negative,and all pass the 1%significance level test.This shows that the effect of economic development on environmental pollution is to intensify and then restrain,and the overall development of the environment is inverted"U"type.That is,with the improvement of economic development level,the environmental condition is firstly manifested as the deterioration of environmental quality.When the economy develops to a certain extent,the environmental quality will also be improved.
(4) The inflow of foreign capital will reduce environmental pollution.The parameters of FDI are negative,and they all pass the 5%significance level test.This reflects that the inflow of foreign capital will reduce environmental pollution.
(5) The increase of the proportion of the tertiary industry will reduce environmental pollution.For IW,the parameter stru passed the 5% significance level test,for is,the parameter stru passed the 1% significance level test.This shows that the increase of the proportion of the tertiary industry will reduce environmental pollution.
(6) The technological progress helps to improve the environment.For IW,the parameter tec passed 1%significance level test,for is,the parameter tec passed 5%significance level test.This shows that technological progress helps to improve the environment.
(7) Environmental regulation plays a positive role in environmental governance.The parameter estimates of environmental regulation Er are negative,and all pass the 5%significance level test.This reflects that environmental regulation plays a positive role in environmental governance.
5 Conclusion
The main conclusions of this paper are as follows:
Firstly,the agglomeration degree of manufacturing industry in Beijing Tianjin Hebei region is more and more obvious,and the development level of manufacturing industry varies greatly among cities.This results is as same as the study findings by Barrios et al.(2004) which have revealed the role of the agglomeration degree of manufacturing industry,according the comparative study of Greece,Ireland,and Spain.The development level of manufacturing industry in Tianjin is the highest,and its leading position is more consolidated.The manufacturing industry has transferred from Beijing and Tangshan to Tianjin,Shijiazhuang and Cangzhou.In terms of industries,there are both over competitive industries and complementary industries among the cities in Beijing-Tianjin-Hebei region,and Beijing has obvious advantages in high-end manufacturing industry,while Tianjin and Hebei mainly develop traditional manufacturing industry.
Secondly,the environmental pollution in Beijing-Tianjin-Hebei region increased first and then decreased,and the degree of pollution in each city was different.In terms of pollutants,Tianjin,Tangshan,Shijiazhuang and Xingtai are more seriously polluted by industrial wastewater,Tangshan,Handan,Tianjin and Shijiazhuang are more seriously polluted by industrial SO2,and Tangshan,Handan,Tianjin and Xingtai are more seriously polluted by industrial smoke and dust.
Thirdly,in the sample period,there is an inverted “U” relationship between manufacturing agglomeration and environmental pollution.The regression results show that for IW and is,the first coefficient of manufacturing agglomeration index is positive,and the second coefficient is negative.This shows that there is an inverted U-shaped relationship between manufacturing agglomeration and industrial waste water pollution and industrial SO2pollution,that is as same as the research conclusion by Eskeland and Harrison(2003).The manufacturing agglomeration effect on environmental pollution is to aggravate first and then reduce.
Fourthly,there is an inverted “U” relationship between economic development and environmental pollution (Virkanen,1998) and there is a negative correlation between market openness (Ellison & Glaeser,1994),industrial structure,technological progress,environmental regulation (Anow,2006) and environmental pollution.According to the empirical results,the primary coefficient of economic development level is positive,the secondary coefficient is negative,and the coefficients of foreign direct investment,industrial structure,technological progress and environmental regulation are negative.Therefore,there is an inverted "U" relationship between economic development and environmental pollution.
- Ecological Economy的其它文章
- Carbon emission reduction effect and mechanism test of carbon emission trading pilot
- Spatial and temporal heterogeneity of the impact of per capita income on household indirect carbon emissions in western China
- Structural characteristics and influencing factors of spatial correlation network for regional high-quality development in China
- Determinates of the competitiveness of provincial forest health care industry in China
- NDVI characteristics and precipitation sensitivity of urban agglomeration in Central Shanxi Basin
- Guide to Authors

