Lumbar spine localisation method based on feature fusion
Yonghong Zhang| Ning Hu | Zhuofu Li | Xuquan Ji |Shanshan Liu | Youyang Sha | Xiongkang Song | Jian Zhang | Lei Hu |Weishi Li
1Robotics Institute,School of Mechanical Engineering and Automation, Beihang University,Beijing,China
2Beijing Zhuzheng Robot Co.,LTD, Beijing,China
3Department of Mechanical,Aerospace and Biomedical Engineering, University of Tennessee,Knoxville,Tennessee,USA
4Department of Orthopaedics,Peking University Third Hospital, Beijing,China
5Engineering Research Center of Bone and Joint Precision Medicine,Ministry of Education, Beijing,China
6Beijing Key Laboratory of Spinal Disease Research,Beijing,China
7School of Biological Science and Medical Engineering, Beihang University,Beijing,China
8Department of Computer Science, University of Warwick,Coventry,UK
Abstract To eliminate unnecessary background information, such as soft tissues in original CT images and the adverse impact of the similarity of adjacent spines on lumbar image segmentation and surgical path planning, a two-stage approach for localising lumbar segments is proposed.First, based on the multi-scale feature fusion technology, a nonlinear regression method is used to achieve accurate localisation of the overall spatial region of the lumbar spine,effectively eliminating useless background information, such as soft tissues.In the second stage, we directly realised the precise positioning of each segment in the lumbar spine space region based on the non-linear regression method,thus effectively eliminating the interference caused by the adjacent spine.The 3D Intersection over Union (3D_IOU) is used as the main evaluation indicator for the positioning accuracy.On an open dataset, 3D_IOU values of 0.8339 ± 0.0990 and 0.8559 ± 0.0332 in the first and second stages, respectively is achieved.In addition, the average time required for the proposed method in the two stages is 0.3274 and 0.2105 s respectively.Therefore, the proposed method performs very well in terms of both precision and speed and can effectively improve the accuracy of lumbar image segmentation and the effect of surgical path planning.
K E Y W O R D S CT image, lumbar spatial orientation, multi-scale information fusion
1 | INTRODUCTION
Lumbar spine disease is a very common type of spinal disease that is often associated with pain.In particular, lumbar spinal stenosis (LSS) is a very common disease of the lumbar spine that can lead to back and lower limb pain, mobility problems and other disabilities[1].In the United States,LSS is the most common reason for spinal surgery in people over the age of 65 [2].Computed tomography (CT) images have irreplaceable advantages in the diagnosis and treatment of LSS, particularly with the rapid development of artificial intelligence and robot technology, the autonomous planning of robotic surgical path based on preoperative CT images has become a research hotspot [3, 4].The autonomous planning of the robotic surgical path requires accurate localisation, segmentation and 3D reconstruction of the lumbar.However, due to the large number of CT image data and the interference of the soft tissue, thoracic vertebra, pelvis and other useless background information, it is very difficult to segment the lumbar spine directly from the original image.Therefore, a feasible and effective method to accurately locate the lumbar region before image segmentation of the lumbar spine is required.
Several studies have demonstrated the effectiveness of this method.Janssens et al.developed cascaded 3D Fully Convolutional Networks (FCNs), which first locates the whole region of the lumbar spine to achieve accurate segmentation of the lumbar spine [5].Sekuboyina et al.employed a multilayered perceptron performing non-linear regression to locate the lumbar region using the Global context and achieved precise segmentation of the five lumbar vertebrae [6].Both methods locate the whole region of the lumbar spine, and directly segment each segment of the spine as different targets for image segmentation.Although,this method can effectively reduce the interference from unnecessary background information such as soft tissue, it still has the problem of poor effect because of the large amount of information in the whole lumbar region and the high degree of similarity between the spinal segments.As shown in Figure 1,L3 and L4 are prone to ambiguity and segmentation errors due to their high structural similarity.
In order to solve the above problems, Payer et al.developed a three-stage automatic segmentation method of the spine, namely the first positioning for the whole area of the spine, then using the heatmap regression algorithm to detect and position the landmarks of each spine.Finally, a series of large enough bounding boxes with a fixed size were used to surround each section of the spine, and the precise segmentation of each section of the spine is realised in this bounding box [7].However, this method did not consider compression fractures and the differences in spinal morphology of each patient, resulting in inadequate robustness.Lessmann et al.determined the spatial position of each spine and effectively eliminated the interference of adjacent vertebrae by assigning corresponding logical rules to the algorithm, sliding sampling in the CT image using a sliding window, and determine whether there is a complete spinal segment within the window[8].Although the method is valid, the complicated logical operation process and sliding sampling results in low efficiency.
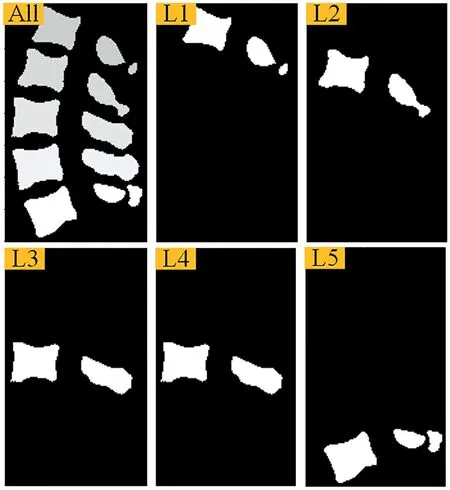
F I G U R E 1 Effect of structural similarity on lumbar image segmentation
The spatial localisation of lumbar vertebrae is similar to target detection in natural image processing.In recent years,target detection has become a research hotpot.In the field of two-dimensional natural image processing, target detection algorithms, such as RCNN series [9–11] and Yolo series[12–15] have emerged.However, there are few studies in the field of medical image processing, particularly in the field of three-dimension medical image processing.At present,most of the related studies are based on the improvement of the natural image object detection algorithm.Vos et al.proposed a method of 2D slice target localisation based on multiple directions to achieve 3D target localisation [16].However, this method loses 3D spatial information and requires multiple positioning, making less accurate and efficient.Xu et al.proposed a CT image organ localisation algorithm based on Faster RCNN[11],the method is completely based on 3D operation,which is more consistent with the high-dimensional features of CT images [17].However, this method produces a large number of anchor boxes during operation,and the final target area needs to be obtained through post-processing,resulting in low operation efficiency.
To efficiently and accurately locate the spatial region of each lumbar vertebra, we propose a two-stage method; in this approach, the overall spatial region of the lumbar vertebra is located first, and the spatial region of each lumbar vertebra within the overall region is subsequently determined.This method fully combines the particularity of lumbar number fixation in lumbar positioning task.Based on multi-scale feature fusion technology, it adopts the method of non-linear regression output coordinate information of the target area directly;it also does not produce candidate boxes,and there is no need to obtain the target area via post-processing.Hence,this approach offers a significant advantage in terms of the positioning precision and efficiency.In addition,we propose a new loss function, which can greatly improve the training effect of the algorithm.
The remainder of this paper is organised as follows.Section 2 introduces the two-stage method and the loss function in detail.Section 3 details the network training.Section 4 presents the evaluation of the validity and feasibility of the proposed method through comparative algorithm experiments.The fifth part will discuss our research.Finally, we will summarise our work.
2 | METHODS
As illustrated in Figure 2, we used two stages to achieve precise localisation of the lumbar spatial region.In the first stage, the lumbar rough positioning network (LRP-Net) used multi-scale feature fusion and non-linear regression to process raw CT images to achieve precise localisation of the global region of the lumbar spine, so as to effectively eliminate useless background information such as soft tissue in the original CT image.In the second stage,the lumbar multitarget detection network (LMD-Net) was used to accurately locate each lumbar spatial region within the global region of the lumbar spine using non-linear regression methods.Through the above method, each lumbar vertebra can be accurately intercepted from the original CT image, providing a good foundation for image segmentation and independent surgical path planning.
2.1 | Overall regional positioning of lumbar spine
We used LRP-Net to locate the entire lumbar spine region in the original CT image.For the convenience of expression, the whole lumbar region is represented by ROILumbar(a cuboid).This cuboid size is determined by the body's diagonal coordinates and can be expressed as (z_min, z_max, y_min,y_max, x_min and x_max).Thereafter, we performed direct regression on ROILumbarto obtain six coordinate data.The LRP-Net structure is illustrated in Figure 3.
LRP-Net consists of two sections: the Backbone network and the 3D-Roi Regression network.The Backbone network is mainly used to extract the features of CT images, which is improved on U-Net [19] under the inspiration of Payer et al.[7].The 3D-Roi Regression network conducts a series of processing on the feature map output by the Backbone network, and finally outputs ROILumbarthrough non-linear regression.
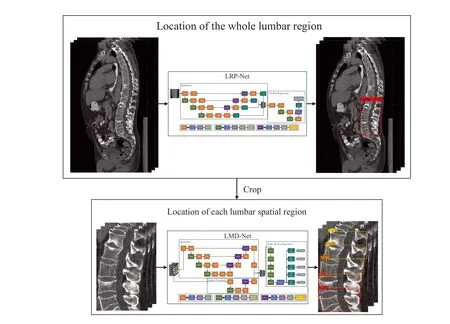
F I G U R E 2 Overall plan of lumbar spine positioning
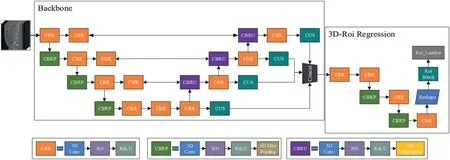
F I G U R E 3 Structure diagram of LRP-Net

F I G U R E 4 Our Continuous Upsampling(CUS)module automatically obtains the required continuous upsampling times according to the input and output sizes, and ensure that the input feature images reach the target size through continuous upsampling.The CUS module contains N - 1 upsampling modules with an upsampling multiplier of two and an adaptive fine-tuning upsampling module
The encoder of the Backbone network consists of four layers, each layer includes two CBR (Convolution + BatchNorm + ReLU) modules and one CBRP(Convolution+ BatchNorm + Re-LU + Pooling) module.To extract features more effectively, we added the CBR module before Max Pooling and formed the CBRP module.
In the decoder, each layer includes a CBRU (Convolution + BatchNorm + ReLU + Upsampling) module, a CBR module and a CUS(Continuous Upsampling)module.Similarly,to extract features more effectively,we add a CBR module for feature extraction before the upsampling operation.The encoder extracts shallow features, which contain sufficient spatial location information; by contrast, the decoder extracts deeper semantic information.Through feature channel stacking, deep and shallow feature information can be fused, and a fusion feature map with rich spatial location and semantic information can be obtained.To prevent the channel dimension from increasing,we reduce the number of feature channels and feature fusion through a three-dimensional convolution operation after splicing.Because the feature map size of each layer in the decoder is different, feature fusion cannot be realised directly via stacking on the dimension of feature channel.To preserve the information in each feature map,we first need to increase the size of the smaller feature maps and then perform the stack operation once all images are unified.We added the CUS module in Backbone network, which can quickly realise the size amplification of each layer's feature map of the decoder through continuous upsampling and also unify the size of each layer to the same size as that of the input image.The corresponding structure is presented in Figure 4.
To prevent feature information loss caused by continuous up-sampling, a three-dimensional convolution operation is performed on the amplified feature graph obtained from upsampling, and the number of output feature channels is set to CUS_Count.In the 3D-Roi Regression network,we arrange the CBR module and CBRP module alternately, to obtain concise feature information and realise the shrinkage of feature images; notably, this reduces the computational complexity in the subsequent non-linear regression of all connected layers.Finally,we realise the non-linear regression through three fully connected layers and determine ROILumbar.
2.2 | Spatial orientation of each lumbar vertebrae
We used ROILumbarto crop the original CT image to obtain a local image that includes the whole lumbar spine and serves as input to LMD-Net.We represent these five lumbar regions as follows: ROIL1, ROIL2…ROIL5.These five areas can also be described in the same manner as ROILumbar.In the second stage, we treat the spatial positioning of five lumbar vertebrae as a regression problem, and LMD-Net obtains the respective coordinates of ROIL1, ROIL2…ROIL5by non-linear regression.The LMD-Net structure is illustrated in Figure 5.
The LMD-Net network includes three parts:the Backbone,Feature Extraction and Multi 3D-Roi Regression networks.Among them,the Backbone network can effectively extract the deep features of local CT images, to realise the general spatial orientation of the five lumbar spines.The Feature Extraction network is responsible for extracting the shallow features of local CT images.Thereafter,pixel superposition and fusion are carried out on the feature map output by the Backbone and Feature Extraction networks.The Multi 3D-Roi Regression network processes the fusion feature images, so as to obtain ROIL1, ROIL2…ROIL5.
LMD-Net's Backbone network is roughly the same as that of LRP-Net, albeit with two main differences:
(1) The fusion of the feature images corresponding to the encoder and decoder is realised via pixel-by-pixel addition,rather than channel stacking.Owing to the higher complexity of LMD-Net and the small difference in the sizes of the input images for the two networks, the hardware level will be higher if the feature channel dimensions are stacked.Hence, we chose to add them in a pixel-bypixel manner to achieve feature fusion.
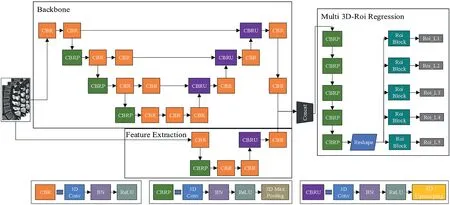
F I G U R E 5 LMD-Net network structure diagram
(2) The size and pixel superposition of the four-layer feature maps during feature fusion are not uniform.In LMD-Net,feature fusion is realised by adding feature images output via the Feature Extraction and Backbone networks in a pixel-by-pixel manner.
Backbone in LMD-Net is mainly used to realise the sketchy spatial orientation of each lumbar spine.Inspired by Payer et al.[7,18],we make use of Backbone to do heatmap regression for the lumbar landmark (the central point of the vertebral canal close to the cone), and L2 Loss is used to minimise the difference between the heatmap predicted by network and the target heatmap.As Backbone provides ‘inspiration’ for spatial orientation of lumbar spine, it is necessary to pre-train the Backbone network before the overall training of LMD-Net.The feature map of the local image processed by the Backbone network is shown in Figure 6.
The feature map output by the Backbone network is a feature map with stronger features in the region of the lumbar landmark, which expresses accurate spatial orientation information of the lumbar spine,but it is weak in expressing the size information of the lumbar spine.Therefore, it is necessary to extract the lumbar spine size information in local CT images through the Feature Extraction network.This network is relatively shallow and has a strong ability to extract details;therefore,it is able to extract information about the size of the spine by obtaining information about the edges of the spine.On adding the feature map output using the Backbone network and Feature Extraction network in a pixel-by-pixel manner,the fusion of the position feature and size feature can be realised.Subsequently,a fusion feature image can be obtained, which can effectively realise the spatial orientation of ROIL1,ROIL2…ROIL5.
2.3 | 3D‐MseCIOULoss
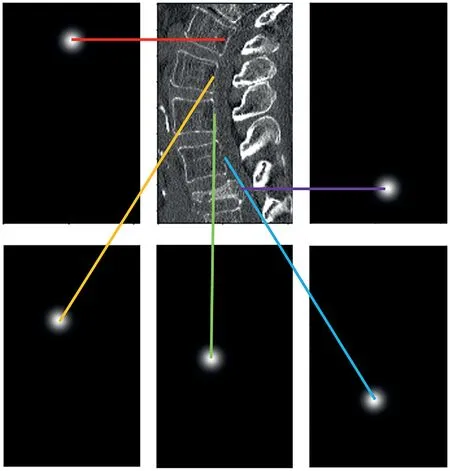
F I G U R E 6 Feature map of the lumbar by Backbone of LMD-Net,there are five channels in total,and the light spot of each channel represents the general location of each lumbar landmark
In LRP-Net and LMD-Net,the spatial location is achieved by non-linear regression.Inspired by complete-IoU Loss [20](which is improved on the basis of IoU Loss[21]),we extend it to three-dimensional space to obtain 3D_CIOULoss.The process calculation method is as follows
where
where, VInteris the volume of the intersection of the space region cuboid ROIPrepredicted by the network and the real target space region cuboid ROITar.VPreis the volume of ROIPre,and VTaris the volume of ROITar.Some parameters of the abovementioned formula(such as DisCenand ZDisPre)are marked in Figure 7.3D_CIOULoss is generally very effective;however, when the network is not initialised correctly,3D_CIOULoss fails to effectively optimise the network.However,MSELoss does not require high random initialisation of the network; however, it does not consider the correlation between coordinates.Hence, its supervised learning effect on the network is inferior to that of 3D_CIOULoss.Thus, we combine the advantages of both and design 3D_MseCIOULoss.The calculation method is as follows:
MSELoss in 3D_MseCIOULoss can effectively optimise the network during the initial stages of network training.When the network is optimised to a certain extent, 3D_CIOULoss can make full use of information, such as the coordinates,shapes and centre distance between ROI_Pre and ROI_Tar and realise effective network learning optimisation.The effects of MSELoss and 3D_CIOULoss on network training can be adjusted by varying the weight coefficientsαandβ.In general,∂<βand ∂is very small.
3 | NETWORK TRAINING DETAILS
Because the orientation format of CT images should be the same, we redirected all CT images to RAI.As LRP-Net and LMD-Net both contain full connection layers, the size of the input image is fixed.The input image being resampled by LRPNet is 224×112×112 (dimension order according to ITK:(z,y,x)), and the input image being resampled by LMD-Net is 192 ×96 ×96,all resampling processes are given cubic spline interpolation function.Whereas the Ground Truth Box of lumbar is automatically obtained by the label of image segmentation corresponding to CT images in the Verse2020 dataset[22–24].The Backbone network of LMD-Net needs to be pre-trained by heatmap regression of the lumbar Landmark to achieve the purpose design of network.The Verse2020 dataset contains multiple Landmarks of CT images.We convert all coordinates to the RAI format with Spacing=(1,1,1);based on this, the target heatmap is generated.We use MSELoss to supervise and reduce the difference between the heatmap generated by LMD-Net prediction and the target heatmap.The calculation method for generating the target thermal map is as follows:

F I G U R E 7 ROIPre and ROITar can be represented by two cuboids.The proposed algorithm aims to maximise the 3D_IOU between ROIPre and ROITar
where Gi(x,σ) represents the target heatmap of theith channel, and ˙xirepresents the coordinates of theith Landmark.The function of Backbone network in LMD-Net provides ‘inspiration’ for spatial orientation of ROIL1,ROIL2…ROIL5.Although the detection accuracy of Landmark is reduced on setting a larger value forσ, the probability of ambiguity is reduced considerably[18].Therefore,we setσ=5 during the pre-training of the Backbone of LMD-Net to generate the target heatmap.In addition, we improve the contrast between the spine and soft tissue by adjusting the window width and position of the CT images.This calculation method can be expressed as follows:
where MinBound=-200 and MaxBound=600.As shown in Figure 8, adjustment of window width and window position can effectively improve the contrast between the spine and the surrounding background.
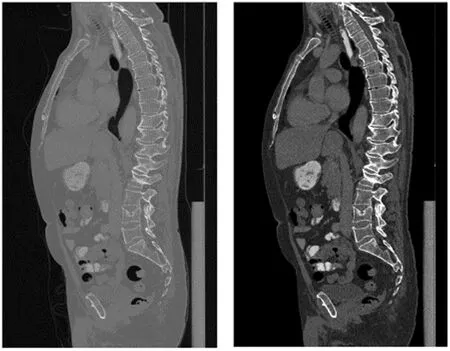
F I G U R E 8 Window width and window position adjustment
Due to the limited number of CT images in the data set,we enhance the random date in the training process.We perform random grey scale transformation, random elastic transformation, and random rotation on the image.As LRP-Net and LMD-Net are both processing 3D CT images, the operations in them are all 3D operation.Parameters related to the convolution operation in LRP-Net and LMD-Net are set as kernel size=3 ×3 ×3, stride=1 ×1 ×1, padding=1×1 ×1.This ensures that the size of the image will not change due to the convolution operation.All pooling operations in the network are Max Pooling, and all parameters are set to kernel size=2 ×2 ×2,stride=2 ×2 ×2.The size of each dimension of the image halves after this pooling operation.The upsampling operation parameters in the network (except the fine-tuning upsampling in CUS module) are scale_-factor=2 and mode=‘trilinear’.In the network,the activation function of the Backbone network output of LRP-Net and LMD-Net is Softmax, and the others are ReLU.To train the network more stably,we added a BatchNormal layer after each convolution operation [25].In LMD-Net, the spatial orientation of ROIL1, ROIL2…ROIL5is inspired by the Backbone network using heatmap regression; hence, the number of output feature channels for the Backbone and the Feature Extraction network of LMD-Net is set to five.The feature map of each channel is responsible for probing the spatial region of a lumbar spine.
For training, we set the weight coefficient in 3D_Mse-CIOULoss(∂=0.01 andβ=1).Through experimentation,it can be found that 3D_MseCIOULoss can achieve excellent performance under this setting.
During the training, 250 groups of CT data including lumbar spine from the Verse2020 dataset were randomly divided into training and verification sets, with 80% used for the training set and 20% used for the verification set.Our network training and verification were conducted on a server equipped with four NVIDIA Quadro RTX6000 graphics cards.We called two of them, and trained was performed for a total of 200 rounds;each round was also verified.The 200 rounds of LRP-Net training required 83 h, whereas the 200 rounds of LMD-Net training required 17 h.
4 | EXPERIMENT AND RESULTS
We tested our algorithm using 76 CT images from the Verse2020 dataset containing the lumbar region that did not participate in the training process as a test set.We conducted a number of experiments to test our method,including:①Effect of increasing channel number on LRP-Net and its positioning accuracy; ②Comparison between LRP-Net and other algorithms; ③Effect of increasing the channel number on LMDNet and its positioning accuracy; ④Comparison between LMD-Net and other algorithms; ⑤Comparison of LRP-Net and LMD-Net with other algorithms in operation speed.
We used Yolov3 [14], Faster RCNN [11], CenterNet [26]and the organ location algorithm for CT images proposed by Xu et al.[17] as our comparison algorithms to test the spatial localisation ability of LRP-Net and LMD-Net for the lumbar spine.These comparison algorithms were also trained and tested on the Verse2020 dataset.Moreover, according to the characteristics of each algorithm, we adjusted the corresponding hyper-parameters to achieve better training results.The corresponding algorithms obtained by the 3D extension were named 3D-Yolo, 3D-FasterRCNN, 3D-CenterNet and method of Xu et al [17].
4.1 | Evaluation indicators
The objective of this task is to detect the five lumbar spatial regions ROIL1, ROIL2…ROIL5, that can be named directly from their respective spatial position.Therefore, there is no need to classify them through the network algorithms.Hence,we use 3D IOU, DisCen(distance between ROIPrecentre coordinates and ROITarcentre coordinates) and SSP (Shape similarity parameter between ROIPreand ROITar) to comprehensively evaluate the network accuracy.Among them,3D IOU is the main evaluation indicator of the network accuracy, and DisCenand SSP are supplementary evaluation indicators.To verify the speed advantage of our algorithm compared with other algorithms, the average positioning time of the spine in each group of CT data in the test set was used as an evaluation indicator to evaluate the operation speed of our algorithm.
3D IOU can describe the overlap between ROIPreand ROITar, and its calculation method has been listed.As shown in Figure 9, DisCencan describe the distance between the centre of ROIPreand ROITar, particularly in the case of the same 3D IOU parameter,the smaller the DisCen,the better the ROIPre.We used Euclidean distance to calculate DisCen.As shown in Figure 10, SSP can effectively describe the similarity of shapes between ROIPreand ROITar, and SSP ∈(0,1].The larger the SSP, the greater the similarity between ROIPreand ROITarin terms of the shape, and vice versa.When 3D IOU and DisCenare the same, the larger the SSP, the better the detection effect of ROIPre.The SSP is calculated as
where

F I G U R E 9 3D_IOU between ROIPre and ROITar in group (a) andgroup (b) is the same, but the DisCen of group (b) is smaller, so the effect of group (b) is better than that of group (a)
4.2 | LRP‐Net test results
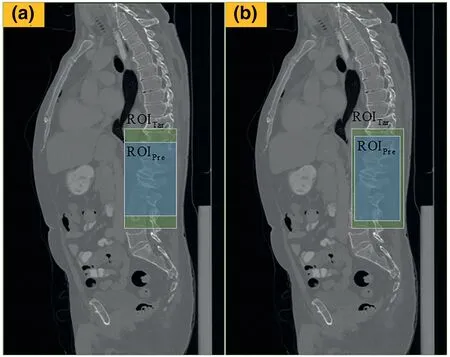
F I G U R E 1 0 3D_IOU and DisCen between ROIPre and ROITar ingroup (a) and group (b) are the same, but SSP of group (b) is larger, so the effect of group (b) is better than that of group (a)

T A B L E 1 Positioning results of ROILumbar by LRP-Net under the two strategies
It can be seen from Table 1 that LRP-Net with a fixed number of feature channels has a higher positioning accuracy for ROILumbarwhen the model sizes of the two strategies are the same.Therefore, a fixed number of feature channels is adopted in LRP-Net.
To visualise the distribution of the three evaluation indicators of LRP-Net on the positioning effect of ROILumbar,we drew the corresponding distribution histogram, as illustrated in Figure 11.
From the above statistics, it is evident that LRP-Net has a concentrated distribution of the detecting effect on ROILumbar,with 3D_IOU in the range of (0.7,0.9), DisCenin the range of(0.5,3.9) and SSP in the range of (0.8,1.0).It is evident that LRP-Net is both accurate and robust.
Finally, the positioning effect of LRP-Net on the whole lumbar region is illustrated in Figure 12;the figure in the upper left side of the box depicts the 3D_IOU.It is evident that LRPNet localised well for ROILumbarin CT images with high noise and surgery history.
4.3 | Comparison of experimental results between LRP‐Net and other algorithms

F I G U R E 1 1 Distribution of LRP-Net detection accuracy

F I G U R E 1 2 Positioning effect of LRP-Net
To demonstrate the effectiveness of LRP-Net, we used the four comparison algorithms selected above to conduct comparison experiments with LRP-Net.The positioning effect of each algorithm for ROILumbaris shown in Table 2.
As shown in Table 2, compared with other algorithms,LRP-Net has a greater advantage in the localisation effect of ROILumbar,and because it can be clearly shown from 3D_IOU,we did not calculate DisCenand SSP extra.
4.4 | LMD‐Net test results
Similar to LRP-Net, we used a fixed number of feature channels in the Backbone network of LMD-Net and set it to 48.To verify the effectiveness of our method, we tested the effect of increasing the number of feature channels on LMDNet.Assuming that the model size is roughly the same under the two strategies of changing and fixing channel numbers,we set the change process of the feature channel number in each stage of the encoder as 8→16→32→64.The localisation effects of LMD-Net on ROIL1,ROIL2…ROIL5under the two strategies were tested.We adopted the average level of LMDNet's positioning effect for ROIL1, ROIL2…ROIL5under the two strategies as the evaluation object, calculated three positioning accuracy evaluation indicators, and obtained the corresponding statistics.The average level is the average value of 3D_IOU located by LMD-Net on ROIL1, ROIL2…ROIL5in the same group of CT.The test results are shown in Table 3.It can be seen from Table 3 that increasing the number of feature channels has little impact on the effect of LMDNet, and may even lead to a slight decline in performance.Therefore, we chose to adopt a fixed number of feature channels in the Backbone network.
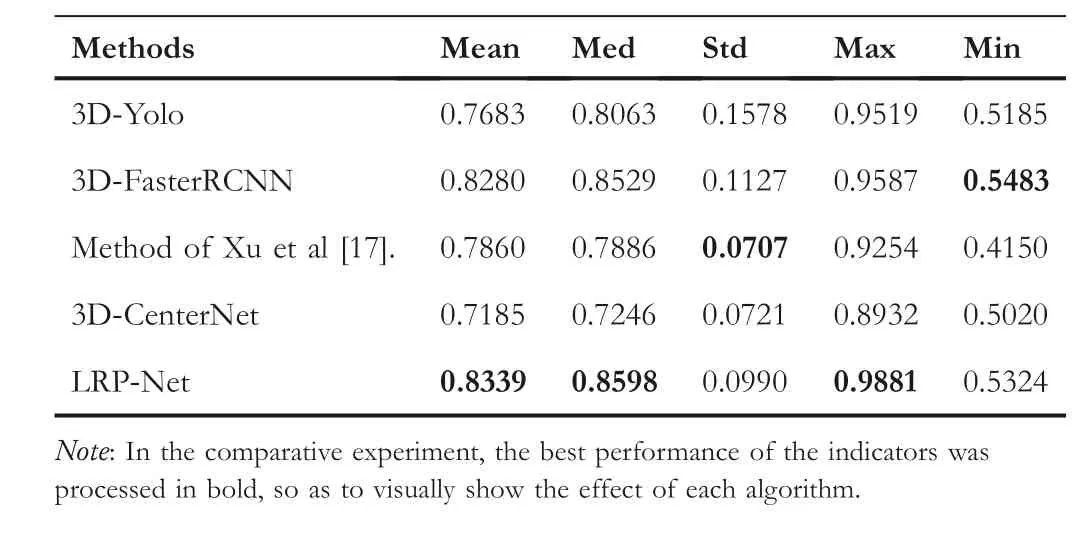
T A B L E 2 3D_IOU statistics of ROILumbar by LRP-Net and other algorithms()
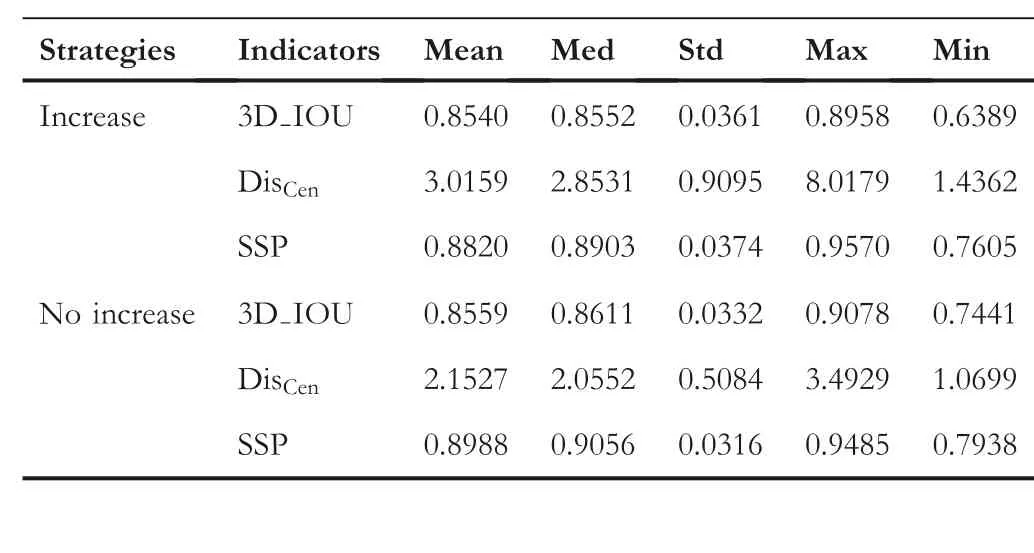
T A B L E 3 Positioning results of ROIL1, ROIL2…ROIL5 by LMDNet under the two strategies
To highlight the positioning effect of LMD-Net on ROIL1,ROIL2…ROIL5in greater detail, we calculated three positioning accuracy indicators of LMD-Net for five lumbar vertebra segments and obtained their statistics.The experimental results are listed in Table 4.
To visualise the difference between the detection effects of LMD-Net on ROIL1, ROIL2…ROIL5, the distribution of detection effect evaluation parameters is plotted in Figure 13.
It is evident from Figure 13 that the 3D_IOU is mainly distributed between (0.8,1.0), DisCenis mainly distributed between(0.5,2.9)and SSP is mainly distributed between(0.8,1.0).In addition, LMD-Net has roughly the same detection ability for each lumbar spine from this distribution index,and there is no evident shortcoming.
The final detection effect of LMD-Net on each lumbar spine is shown in Figure 14,where the image in the upper left side of the box depicts the 3D_IOU.
4.5 | Comparison of experimental results between LMD‐Net and other algorithms
Similar to LRP-Net, we used four selected comparison algorithms to conduct comparison experiments with LMD-Net,and the experimental results are shown in Table 5.

T A B L E 4 LMD-Net localisation results for five lumbar vertebrae

F I G U R E 1 3 LMD-Net detection accuracy distribution of ROIL1, ROIL2…ROIL5
As shown in Table 5, compared with other algorithms,LRP-Net has a greater advantage in the localisation effect of ROIL1, ROIL2…ROIL5, and because it can be clearly shown from 3D_IOU, we did not calculate DisCenand SSP extra.
In addition, to visualise the advantages and disadvantages of the detection ability of each comparison algorithm for ROIL1, ROIL2…ROIL5, we plot the 3D_IOU distribution of each algorithm in Figure 15.
From the above figure,it is evident that LMD-Net is very useful for ROIL1, ROIL2…ROIL5, the detection result is not only higher in accuracy, but also more concentrated in distribution, indicating that our algorithm is more robust.
4.6 | Comparison experiment of algorithm operation speed
Because most current target detection algorithms generate many candidate boxes,it is necessary to obtain the final target space region through non-maximum suppression or the weighting operation.However, the proposed LRP-Net and LMD-Net directly obtains the target region through non-linear regression, and the algorithm structure is relatively simple.Therefore,our algorithm offers significant advantages in terms of the operation speed.To verify the speed advantage of LRPNet and LMD-Net, we conducted a comparative experiment of algorithm speed.We calculated the average time spent by each algorithm to locate the spine in each group of CT images in the test set, and the results were shown in Table 6.
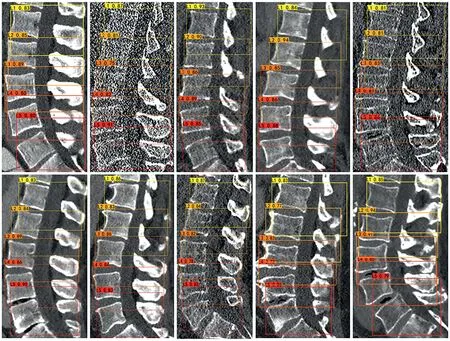
F I G U R E 1 4 Detection effect of LMD-Net on each lumbar spine
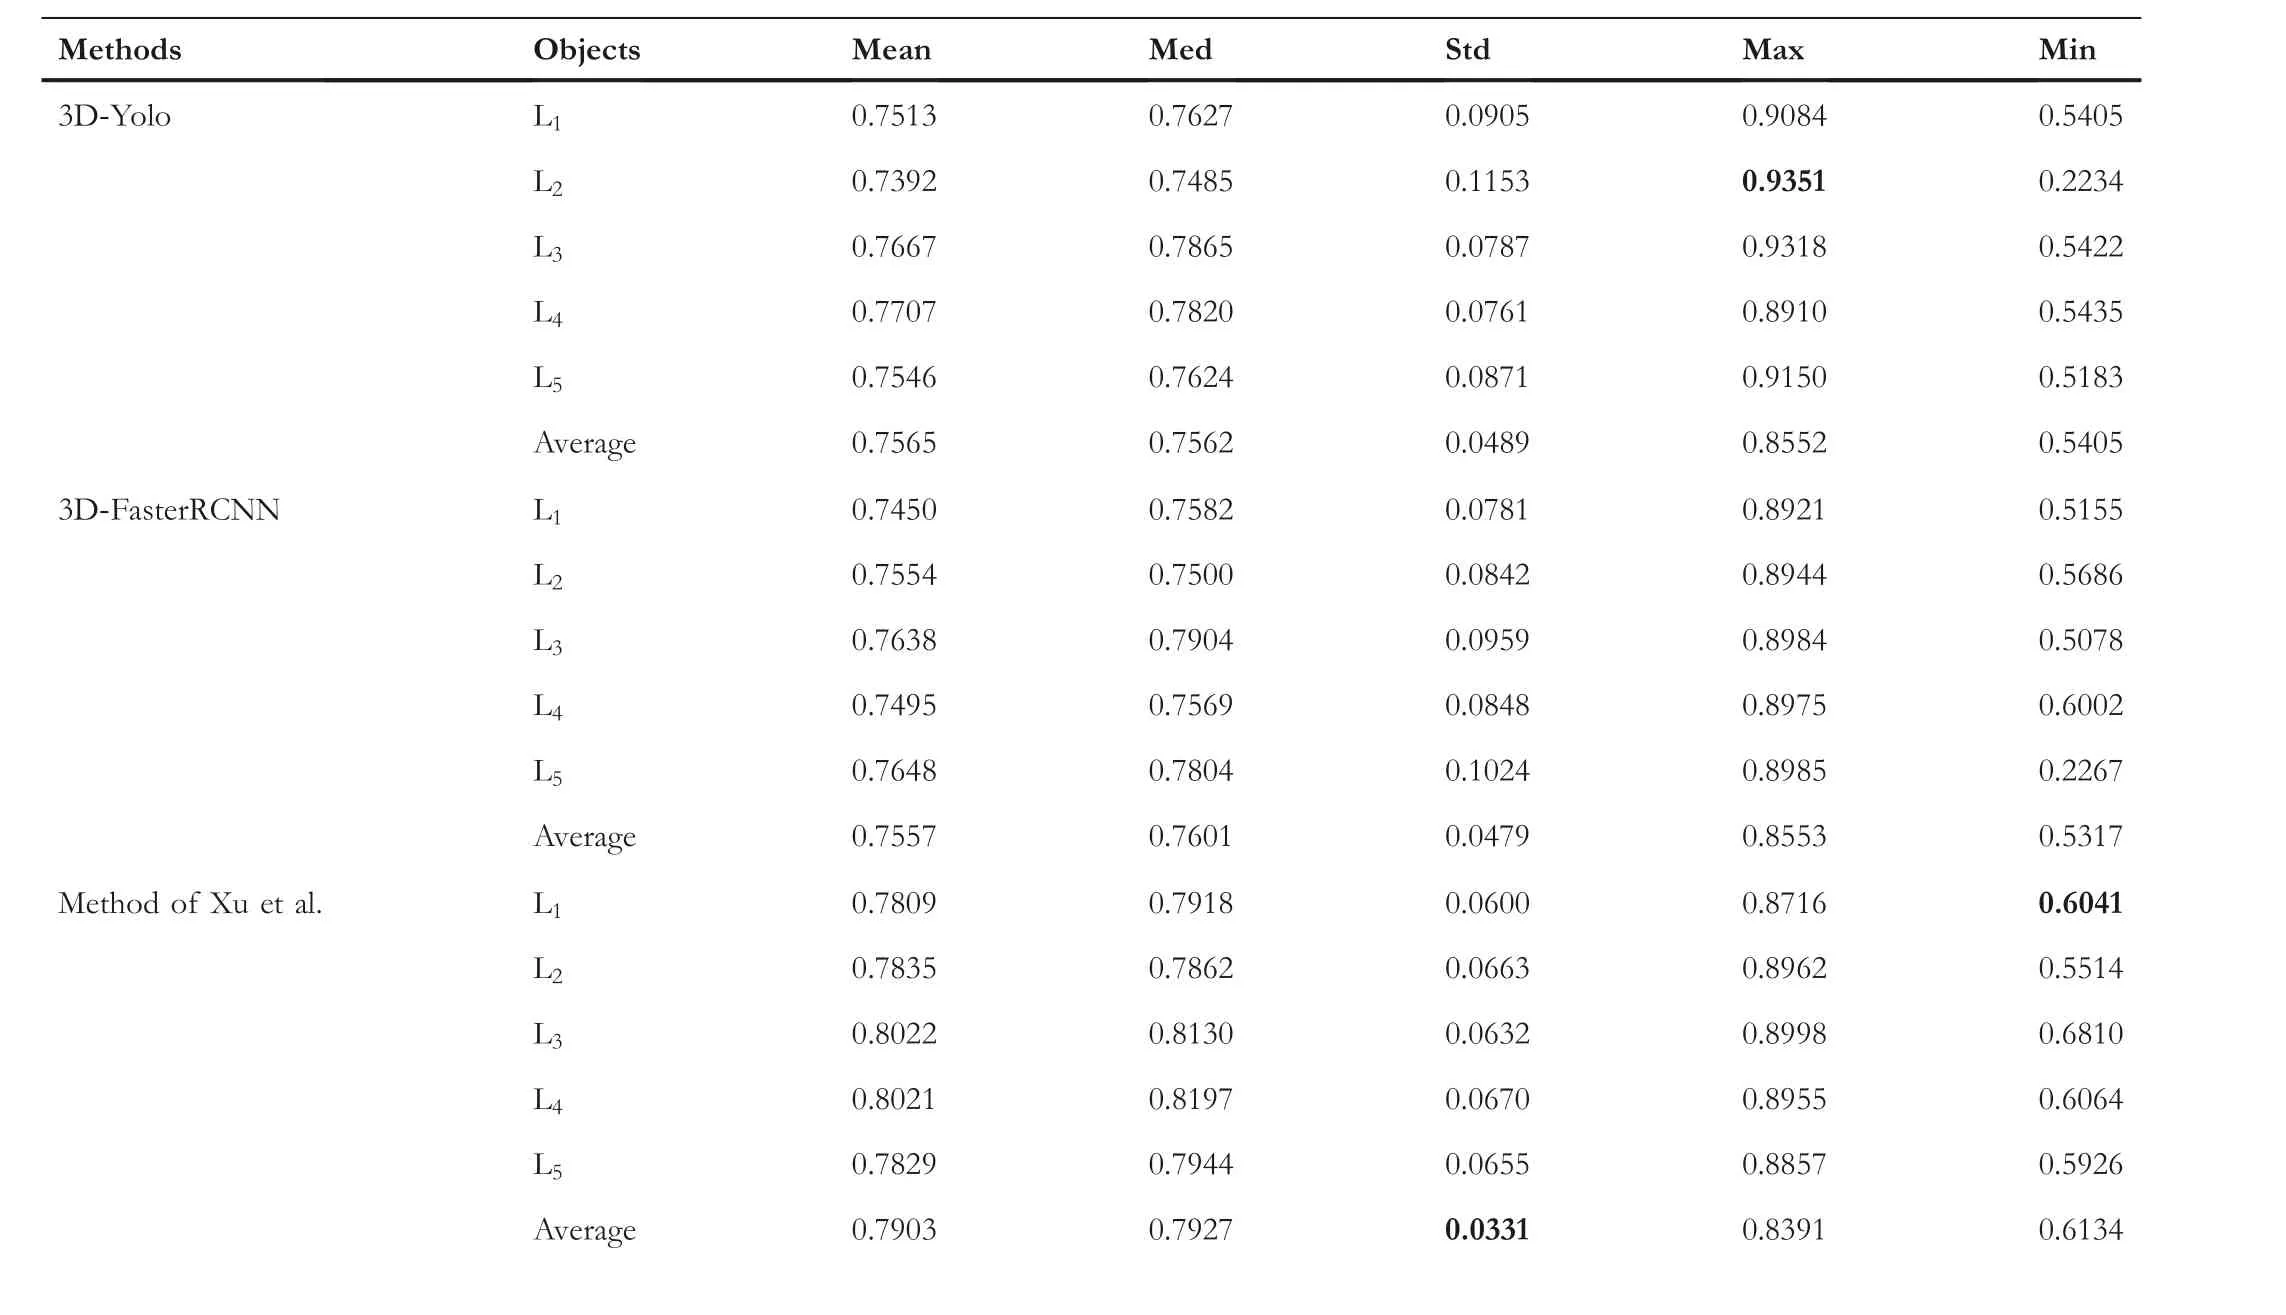
T A B L E 5 3D_IOU statistics of ROIL1, ROIL2…ROIL5 by LMD-Net and other algorithms

TA B L E 5 (Continued)
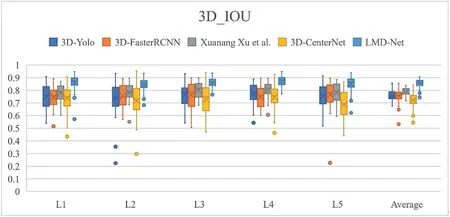
F I G U R E 1 5 3D_IOU box diagram of detection results of ROIL1, ROIL2…ROIL5 by LMD-Net and other algorithms

T A B L E 6 The time spent by each algorithm to achieve spinal localisation (the unit is in seconds)
As can be seen from Table 6, the proposed LRP-Net and LMD-Net have obvious advantages in computing speed compared with other algorithms.
5 | DISCUSSION
The proposed two-stage method for spatial orientation of each lumbar vertebra in CT images shows good accuracy and high computational efficiency.Although our method shows better results in both accuracy and speed than the most advanced methods in the lumbar precise positioning task, there are still some limitations.
First, we have not achieved single-stage direct localisation of each lumbar segment in the original CT image, and as a result our method did not run at maximum efficiency.In addition, both LRP-Net and LMD-Net are robust to lumbar spatial localisation on spinal CT images in the presence of high noise, spinal deformity, compression fracture, and bone cement.However, its lumbar spatial positioning accuracy with metal artefacts left by surgery is a little low.Finally, due to the high dimension of CT images and the three-dimensional operation of the algorithm, the BatchSize cannot be set too high during training, at the same time the hardware requirements are very high.
Therefore, in the future, we will devote ourselves to studying a network algorithm with clever structure, which can not only achieve the precise positioning of the single-stage lumbar space region, but also effectively simplify our network structure and decrease the hardware requirements.In addition, we will enhance the robustness of our algorithm by enriching the data set and adding more random data enhancement methods during training.
6 | CONCLUSION
In this study, to provide a good basis for lumbar image segmentation and surgical path planning,we proposed a two-stage lumbar spatial region localisation method.In addition, two algorithms were proposed, LRP-Net and LMD-Net, which show a high level of accuracy and speed.The 3D_IOU of LRP-Net and LMD-Net can reach 0.8339 ± 0.0990 and 0.8559 ± 0.0332, and the average time of localisation is only 0.3274 and 0.2105 s respectively.Compared with other target detection algorithms,our algorithm has obvious advantages.In addition,3D-MseCIOUloss is proposed,which can effectively supervise the iterative training of LRP-Net and LMD-Net.In the future, we will focus on designing a more ingenious network structure to achieve single-stage lumbar spatial region localisation and also reduce the complexity of the network structure; this is expected to improve the accuracy and efficiency of the algorithm.In addition,we plan to enrich the data set and optimise the network training process to improve the robustness of this algorithm.
ACKNOWLEDGEMENTS
The authors thank all anonymous reviewers for their thorough work and excellent comments that helped us to improve our manuscript.Moreover, the authors also thank the MICCAI 2020 organisers for making the Verse2020 dataset freely available.This work was supported by the Beijing Natural Science Funds-Haidian Original Innovation Joint Fund:L202010 and the National Key Research and Development Program of China: 2018YFB1307604.National Key Research and Development Program of China, Grant/Award Numbers:2018YFB1307604
CONFLICT OF INTEREST
The author declares that they have no conflict of interest.
DATA AVAILABILITY STATEMENT
The data that support the findings of this study are available in verse2020 at https://github.com/anjany/verse.
ORCID
Yonghong Zhanghttps://orcid.org/0000-0002-0622-8503
 CAAI Transactions on Intelligence Technology2023年3期
- CAAI Transactions on Intelligence Technology的其它文章
- Fault diagnosis of rolling bearings with noise signal based on modified kernel principal component analysis and DC-ResNet
- Short‐time wind speed prediction based on Legendre multi‐wavelet neural network
- Iteration dependent interval based open‐closed‐loop iterative learning control for time varying systems with vector relative degree
- Thermoelectric energy harvesting for internet of things devices using machine learning: A review
- An embedded vertical‐federated feature selection algorithm based on particle swarm optimisation
- An activated variable parameter gradient-based neural network for time-variant constrained quadratic programming and its applications
