Genetic susceptibility loci of lung cancer are associated with malignant risk of pulmonary nodules and improve malignancy diagnosis based on CEA levels
Zhi Li ,Liming Lu ,Yibin Deng ,Amei Zhuo ,Fengling Hu ,Wanwen Sun ,Guitian Huang,Linyuan Liu,Boqi Rao,Jiachun Lu,Lei Yang
1The State Key Lab of Respiratory Disease,Institute of Public Health,Guangzhou Medical University,Guangzhou 511436,China;2Center for Medical Laboratory Science,the Affiliated Hospital of Youjiang Medical University for Nationalities,Baise 533000,China;3Physical examination center,Guangzhou First People’s Hospital,Guangzhou 511468,China
Abstract Objective: The heightened prevalence of pulmonary nodules (PN) has escalated its significance as a public health concern.While the precise identification of high-risk PN carriers for malignancy remains an ongoing challenge,genetic variants hold potentials as determinants of disease susceptibility that can aid in diagnosis.Yet,current understanding of the genetic loci associated with malignant PN (MPN) risk is limited.Methods: A frequency-matched case-control study was performed,comprising 247 MPN cases and 412 benign NP (BNP) controls.We genotyped 11 established susceptibility loci for lung cancer in a Chinese cohort.Loci associated with MPN risk were utilized to compute a polygenic risk score (PRS).This PRS was subsequently incorporated into the diagnostic evaluation of MPNs,with emphasis on serum tumor biomarkers.Results: Loci rs10429489G>A,rs17038564A>G,and rs12265047A>G were identified as being associated with an increased risk of MPNs.The PRS,formulated from the cumulative risk effects of these loci,correlated with the malignant risk of PNs in a dose-dependent fashion.A high PRS was found to amplify the MPN risk by 156% in comparison to a low PRS [odds ratio (OR)=2.56,95% confidence interval (95% CI),1.40-4.67].Notably,the PRS was observed to enhance the diagnostic accuracy of serum carcinoembryonic antigen (CEA) in distinguishing MPNs from BPNs,with diagnostic values rising from 0.716 to 0.861 across low-to high-PRS categories.Further bioinformatics investigations pinpointed rs10429489G>A as an expression quantitative trait locus.Conclusions: Loci rs10429489G>A,rs17038564A>G,and rs12265047A>G contribute to MPN risk and augment the diagnostic precision for MPNs based on serum CEA concentrations.
Keywords: Pulmonary nodules;susceptible loci;serum tumor biomarkers;polygenic risk score;diagnosis
Introduction
Pulmonary nodules (PNs) are defined focal lesions in the lungs,either circular or irregular,measuring a diameter of≤30 mm.Recent data indicate a significant rise in the prevalence of individuals diagnosed with PNs.Findings from several low-dose computed tomography (LDCT)screening initiatives report a detection rate ranging from 11.7% to 25.7% among individuals undergoing chest CT scans (1-4).Lung cancer,which is influenced by both environmental and genetic factors,has a heavy economic burden in China (5,6).Although PNs occasionally indicate lung cancer,fewer than 5% of these nodules result in a malignancy diagnosis (7).Nonetheless,carriers of PNs are advised to undertake long-term follow-up examinations,owing to the current absence of reliable tools to differentiate malignant PNs (MPNs) from benign PNs(BPNs).This challenge is further underscored by the misjudgment rate nearing 20% for surgically excised PNs from the MPN cohort (8).This diagnostic ambiguity,paired with the recommended long-term follow-ups,presents both an economic strain and psychological distress on affected individuals,adversely influencing their quality of life.Consequently,pinpointing high-risk malignancy subpopulations among PNs carriers is a pressing need for precise interventions.
Genetic variants stand as pivotal determinants in disease susceptibility,bearing considerable relevance for risk assessment and the identification of high-risk groups.Prior research,notably genome-wide association studies(GWAS),has shed light on susceptibility loci for lung cancer,predominantly in the form of single nucleotide polymorphisms (SNPs) (9-12).Further,polygenic risk scores (PRS) derived from GWAS,which consolidate the effects of these SNPs,have been validated as efficacious tools for discerning high-risk lung cancer subpopulations within extensive cohorts (12).Yet,the extent of influence these GWAS-SNPs exert on the malignant risk associated with PNs remains inadequately explored.Additionally,genetic variants offer promise in enhancing disease screening and diagnosis via biomarkers (13,14).
In this study,we implemented a frequency-matched case-control study,encompassing 247 MPN cases and 412 BPN controls,to probe the correlation between GWASSNPs and the malignant risk of PNs within a southern Chinese demographics.Concurrently,we ascertained the impact of GWAS-PRS in distinguishing between MPNs and BPNs,using tumor biomarker analysis.Our findings underscore specific SNPs as determinants in MPN susceptibility and in distinguishing MPNs from BPNs,using serum carcinoembryonic antigen (CEA)concentrations.
Materials and methods
Study population and sample collection
We implemented a frequency-matched case-control study.A cohort of 247 MPN cases was enlisted from hospitals located in Guangzhou,Dongguan,and Baise City between June 2018 and December 2022.Simultaneously,412 agefrequency matched (±5 years) BPN controls were incorporated from individuals undergoing recurring health evaluations or engaging with the respiratory department during the same time frame.Screening of subjects was facilitated through CT or LDCT,pinpointing PNs between 4 mm and 3 cm.MPNs were verified via surgical intervention followed by pathological assessment.While a subset of BPNs was histopathologically verified as benign,the remaining were ascertained as benign based on experienced medical evaluations coupled with consistent CT findings during a four-year follow-up.Information,including demographic details (age,sex,smoking status),CT images,and serum tumor biomarkers like CEA,were collated from medical archives.Participants were required to furnish an informed consent and donate a one-time 5 mL peripheral blood sample.Ethical approval for this study was obtained from the Ethics Committee of Guangzhou Medical University.
SNP genotyping
We selected the 11 susceptible GWAS-SNPs to lung cancer of Chinese,which were confirmed to be effective tools in discriminating subpopulations at high risk of lung cancer by mega cohorts (12).The SNPs were as follows:rs10429489G>A,rs17038564A>G,rs12265047A>G,rs1200 399C>T,rs1853837C>A,rs2293607T>C,rs3817963T>C,rs5879422insGT,rs11375254delA,rs55768116C>T and rs401681C>T.Genomic DNA extraction was performed from blood samples using the TIANamp Genomic DNA Kit (Tiangen Biotech,Beijing).Subsequent genotyping was carried out on an ABI7500 polymerase chain reaction(PCR) apparatus (Applied Biosystems,USA) via the TaqMan real-time polymerase chain reaction.Detailed primer and probe information is available inSupplementary Table S1.
Statistical analysis
The Hardy-Weinberg equilibrium (HWE) of the control group’s allele frequency distribution was ascertained using the Chi-square goodness of fit test. Differences in demographic features,SNP genotype frequency distributions,and serum tumor markers between cases and controls were gauged using the Chi-square or Mann-Whitney test.Post adjustment for age,sex,and smoking status,the association between SNPs and PNs’ malignant risk was determined through logistic regression.PRS derivation utilized the odds ratio-weighted genetic risk score (OR-GRS) methodology (15).Akaike’s information criterion (AIC) aided in the selection of the optimal genetic-effect model.A multiplicative interaction model was proposed to discern potential gene-environment interactions impacting MPN risk.The statistical power was calculated by using the PS software (Version 3.0.5;developed by William D. Dupont and Walton D.Plummer; Nashville,Tennessee USA). The receiver operating characteristic (ROC) curve enabled evaluation of serum tumor markers’ diagnostic potency,specifically the area under the ROC curve (AUC),in distinguishing MPNs from BPNs.The expression quantitative trait loci (eQTL)assessment of candidate SNPs was executed within the GTEx database (https://www.gtexportal.org).Data analyses were facilitated using IBM SPSS Statistics software(Version 25.0;IBM Corp.,Chicago,IL,USA) and R Project for Statistical Computing (Version 4.0.3;University of Auckland,New Zealand).A P value less than 0.05 was deemed statistically significant.
Results
Subject’s demographic characteristics
Table 1presents the demographic features of the study participants.The cases and controls showed no significant disparities in the distribution of age,sex,or family history of cancer.However,a higher frequency of smokers was observed among cases compared to controls (P<0.001).Additionally,a higher prevalence of partial solid nodules and ground glass nodules was evident in cases relative to controls (P<0.001).

Table 1 Demographic and clinical characteristics of case-control study
Association between GWAS-SNP and malignant risk of PNs
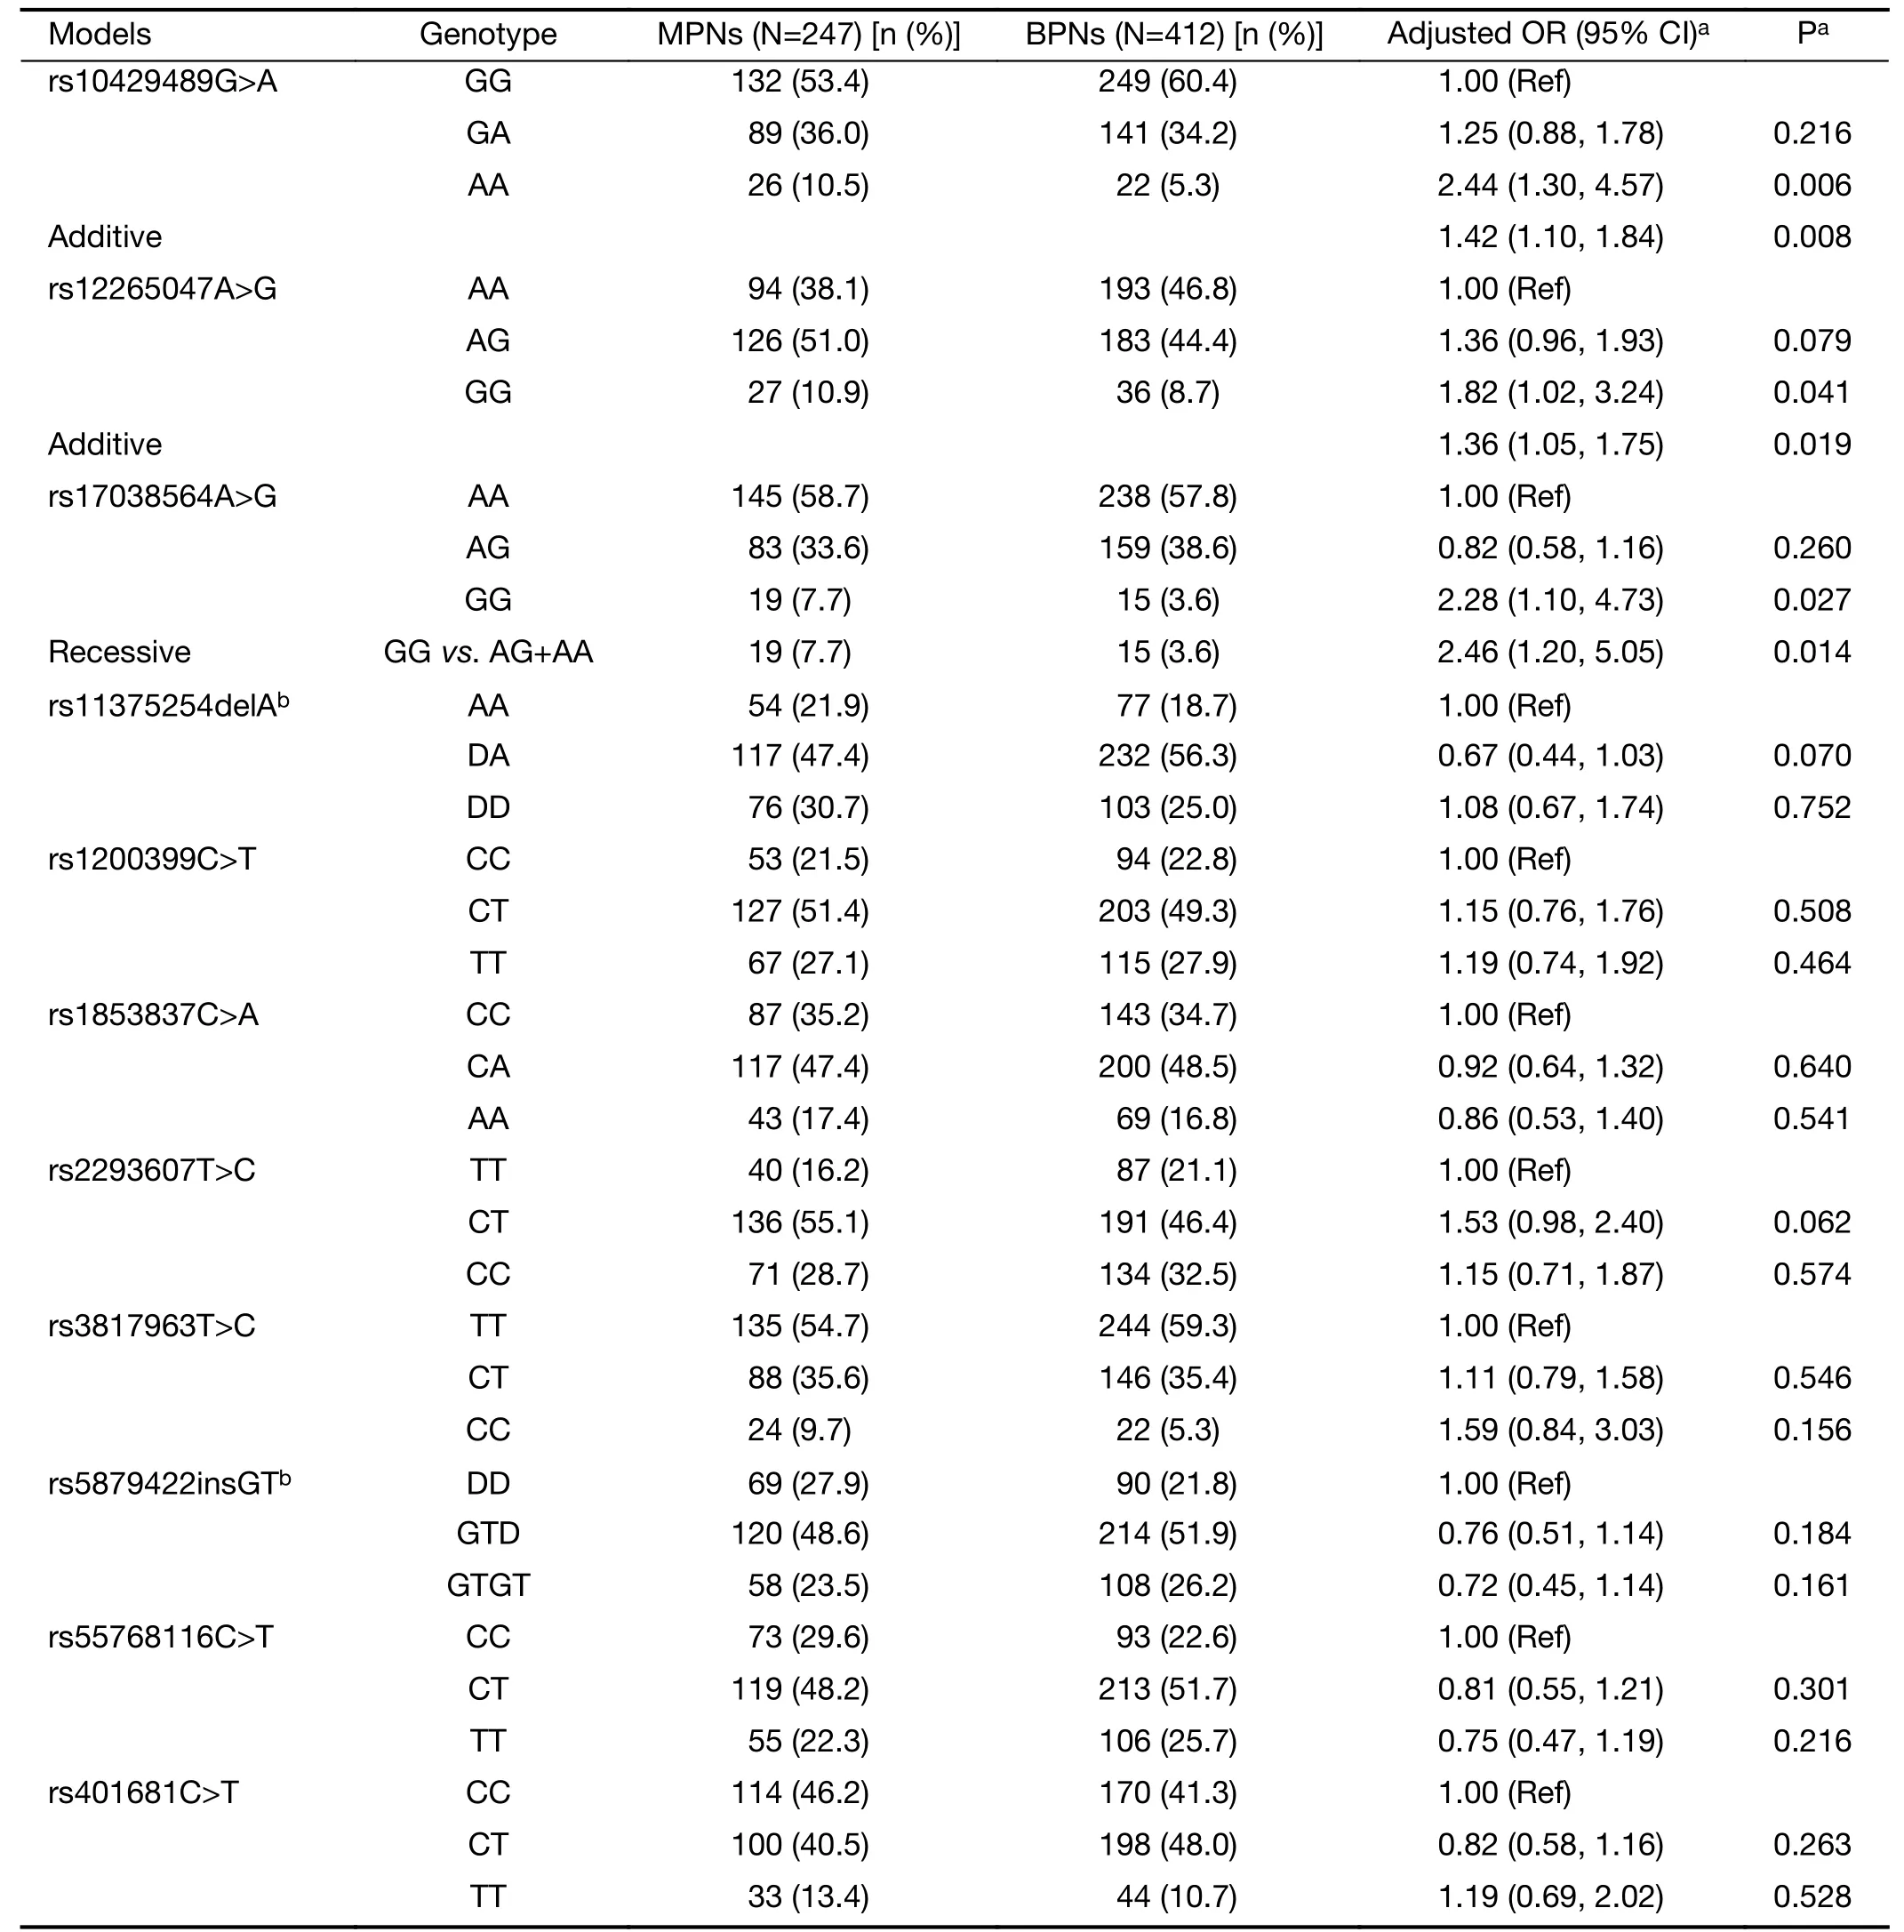
Table 2details the genotype distributions of the 11 SNPs for both cases and controls.Genotype frequencies of these SNPs in control subjects conformed to the HWE (P>0.05 for all).Among the evaluated SNPs,rs10429489G>A,rs12265047A>G,and rs17038564A>G demonstrated significant genotype frequency differences between cases and controls,whereas the remainder did not.Based on the smallest AIC value,the impact of rs10429489G>A and rs12265047A>G on MPN risk most closely aligned with the additive genetic model.A dose-response relationship with the A allele for rs10429489G>A [odds ratio (OR)=1.42,95% confidence interval (95% CI),1.10-1.84] and G allele for rs12265047A>G (OR=1.36,95% CI,1.05-1.75) was observed.In contrast,rs17038564A>G best fit the recessive model,where rs17038564GG genotype carriers exhibited a 1.46-fold increased MPN risk compared to rs17038564A (AA+AG) genotype carriers(OR=2.46,95% CI,1.20-5.05).
Generation of PRS and malignant risk of PNs
Risk effects of rs10429489G>A,rs12265047A>G,and rs17038564A>G,as modulated by OR,informed the PRS construction.As presented inTable 3,a dose-response relationship between MPN risk and PRS was observed(Ptrend<0.001).Participants with a PRS>0.90 faced the highest MPN risk compared to those with a PRS of 0,resulting in an adjusted OR of 2.56 (95% CI,1.40-4.67).Furthermore,participants with a PRS between 0.62 and 0.90 exhibited an elevated MPN risk (OR=1.57,95% CI,1.00-2.46).In contrast,no significant risk elevation was noted for participants with a PRS<0.62.For analysis purposes,subjects with PRS>0.90 were categorized as high PRS,those between 0.62 and 0.90 as intermediate PRS,and those <0.62 as low PRS.Subsequent stratified analysis highlighted that the risk effect of intermediate or high PRS was more pronounced in non-smokers and those with solid PNs (Table 4). No discernible interaction between demographic features and PRS influencing MPN risk was identified.

Table 2 Associations of GWAS-SNPs with malignant risk of PNs
CEA displays different diagnostic accuracy in distinguishing MPNs from BPNs among different PRS group
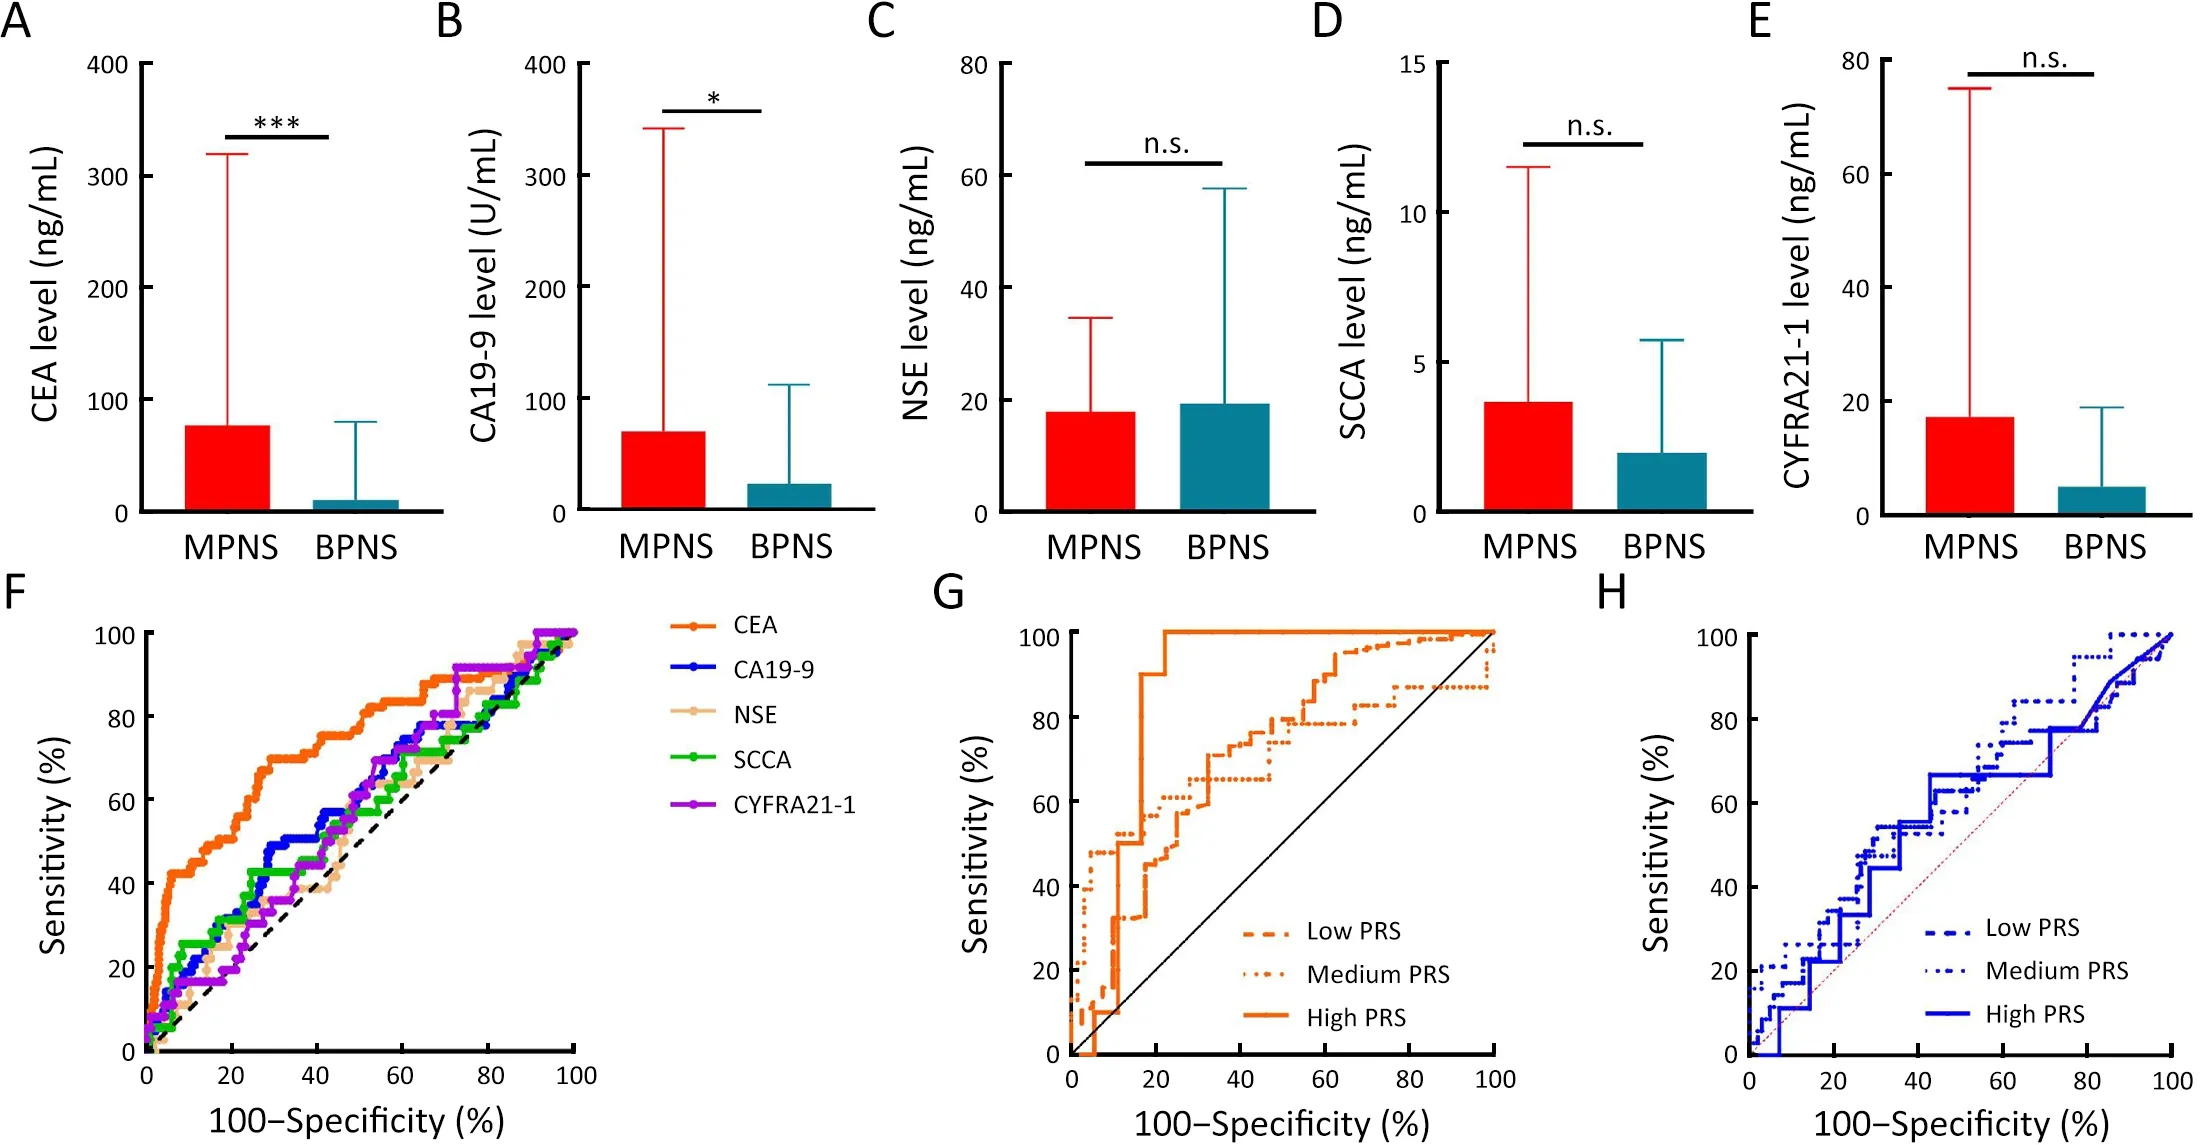
Serum tumor biomarkers,including CEA,have been documented as effective tools in evaluating PNs to aid in distinguishing malignant from benign presentations(16,17).However,the diagnostic efficacy of these markers,especially in screening populations,remains suboptimal.Initial comparisons were made between the levels of CEA,neuron-specific enolase (NSE),carbohydrate antigen 19-9(CA19-9),squamous cell carcinoma antigen (SCCA),and cytokeratin 19 fragment (CYFRA21-1) across MPN cases and BPN controls.Elevated levels of CEA and CA19-9,but not of NSE,SCCA,or CYFRA21-1,were significantly observed in cases compared to controls (Figure 1A-E).CEA levels demonstrated moderate diagnostic accuracy in differentiating MPN cases from BPN controls (AUC=0.731,95% CI,0.660-0.803;Figure 1F).Although CA19-9 could distinguish MPNs from BPNs,its diagnostic precision was limited (AUC=0.587,95% CI,0.501-0.673).Subsequent analysis of CEA and CA19-9 diagnostic accuracy was conducted across various PRS groups.Notably,CEA’s AUC value in distinguishing MPNs from BPNs was markedly elevated in high-PRS subjects(AUC=0.861,95% CI,0.714-1.000) compared to intermediate-(AUC=0.701,95% CI,0.552-0.849) and low-(AUC=0.716,95% CI,0.622-0.810) PRS groups(Figure 1G).The diagnostic precision of CA19-9 in identifying MPNs remained unaffected by PRS (Figure 1H).
We performed an eQTL analysis of rs10429489G>A,rs17038564A>G and rs12265047A>G in lung tissues derived from 515 healthy individuals,utilizing the GTEx database.The results (Figure 2) indicated a significant association between rs10429489G>A and methylthioadenosine phosphorylase (MTAP) expression,modulated in an A allele dose-dependent manner (P=0.005).In contrast,no significant associations were observed between rs17038564A>G and actin related protein 2 (ACTR2),or rs12265047A>G and vesicle transport through interaction with T-SNAREs 1A (VTI1A).
Discussion
Genetic variants have been identified as potential biomarkers for assessing disease risk within populations and for pinpointing high-risk cohorts,thereby amplifying the efficacy of population screening.While PNs are emerging as a global health concern,limited knowledge exists regarding genetic loci associated with their malignant risk.In our research,we discerned three SNPs,previously established through GWAS for lung cancer susceptibility,to be significantly tied to the malignant risk of PNs.A PRS formulated using these three SNPs demonstrated its utility in enhancing the precision of serum CEA in differentiating MNPs from BPNs.To our understanding,this represents the inaugural study highlighting susceptible loci for MPNs.

Figure 1 Impact of polygenic risk score on diagnostic value of MPNs using serum tumor biomarkers.(A-E) Differences in serum level of CEA (A),CA19-9 (B),NSE (C),SCCA (D),and CYFRA21-1 (E) among MPN cases and BPN controls;(F) ROC curves for tumor biomarkers on distinguishing MPNs from BPNs;(G,H) ROC curves for CEA (G) and CA19-9 (H) on distinguishing MPNs from BPNs in individuals with different PRS.MPN,malignant pulmonary nodule;CEA,carcinoembryonic antigen;CA19-9,carbohydrate antigen 19-9;NSE,neuron-specific enolase;SCCA,squamous cell carcinoma antigen;CYFRA21-1,cytokeratin 19 fragment;BPN,benign pulmonary nodule;ROC,receiver operating characteristic;PRS,polygenic risk score;n.s.,non-significant.Data are presented as .*,P<0.05;***,P<0.001;P values were calculated by the Mann-Whitney test.

Figure 2 Expression quantitative trait loci (eQTL) analysis of candidate SNPs.(A) rs10429489G>A with P=0.005;(B) rs17038564A>G with P=0.683;(C) rs12265047A>G with P=0.837.
Previous expansive cohort studies that amalgamate GWAS have validated the SNPs we selected for their efficacy in assessing lung cancer risk across both Chinese and European demographics (12).Nonetheless,despite MPNs representing an early stage of lung cancer,these SNPs might not be directly linked to MPN risk due to two reasons.Firstly,considering MPNs manifest as an initial phase of lung cancer,previous studies might have inadvertently included MPN cases within their control groups.Secondly,the presence of nodules within the controls remains uncertain.In our analysis,only three of the selected GWAS-SNPs were found to be correlated with MPN risk.The alleles A of rs10429489G>A,G of rs12265047A>G,and G of rs17038564A>G have been previously documented to elevate the risk for lung adenocarcinoma and non-small cell lung cancer (12,18,19).Aligning with previous findings,our study substantiates these alleles as risk factors for MPNs.Furthermore,our eQTL analysis revealed that rs10429489G>A,positioned at the 5’-untranslated region of MTAP,inversely correlates with MTAP expression in lung tissues,following an A allele dose-response trajectory.MTAP is integral to the purine and methionine synthesis salvage pathway (20).Accumulating evidence posits MTAP as a potential tumor suppressor in lung cancer.Its diminished or absent expression in lung cancer samples significantly influences therapeutic responsiveness and prognosticates unfavorable outcomes (20-26).Overexpression of MTAP has been observed to inhibit proliferative,migratory,and invasive phenotypes of lung cancer cells (27).Consequently,the association between rs10429489A and elevated MPN risk,given its linkage to reduced MTAP expression,is plausible.Although ACTR2 has been implicated in the progression of lung cancer (28,29),rs12265047A>G,situated at the 3’-untranslated region of ACTR2,according to GTEx lung data,does not impact ACTR2 expression.The relationship between rs17038564A>G and the risk of both lung cancer and MPNs remains ambiguous,given its location within the intron region of VTI1A and the currently undefined role of VTI1A in lung cancer.
The escalating adoption of chest CT scans and LDCT screenings has amplified the detection rate of PNs considerably.Recent advancements have facilitated the precise characterization of PNs through innovative biomarkers such as cell-free DNA methylation markers(30).However,these methodologies,owing to their intricacy and high costs,are not suitable for categorizing PNs deemed to possess a low malignant risk as identified through screenings.Despite CEA’s long-standing utilization as a tumor marker for delineating PNs,its diagnostic accuracy,as expressed by AUC,typically falls within a low to moderate range,spanning from 0.54 to 0.77(31-39).Notably,our findings underscore the enhanced diagnostic precision of CEA for MPNs within individuals possessing a high PRS,indicating the utility of PRS in enhancing PNs assessment via serum CEA.
There are some limitations in this study.Firstly,its casecontrol design,rooted in hospital data,inherently introduces potential biases,such as selection bias.We lacked an additional dataset to validate our findings.Secondly,the study participants were predominantly from Guangdong province,and the overall sample size was constrained.Lastly,a dearth of functional analyses precluded the provision of a biological rationale substantiating the observed associations.However,the study power is strong.We have achieved a 95.8% study power (two-sided test,α=0.05) to detect an OR of 2.56 for the high PRS (which occurred at a frequency of 7.5% in the controls) compared with the lowest PRS,and a 72.1%study power to detect an OR of 1.57 for the intermediate PRS (which occurred at a frequency of 24.3% in the controls) compared with the lowest PRS.When we combined the high and intermediate PRS,the study power was 97.0%.We also analyzed false-positive report probability (FPRP) of the association between the PRS and MPN risk,under the assumption of a prior probability of 0.05 as well as 2 and 1.5 as the prior OR for high PRS and intermediate PRS,respectively with the method by Wacholderet al.(40).The FPRP for the risk effect of high PRS and intermediate PRS was 0.086 and 0.191,respectively,which are lower than the preset FPRP-level criterion 0.20,suggesting that our finding is note-worthy.
Conclusions
This research discerned an association of rs10429489G>A,rs17038564A>G,and rs12265047A>G with the malignant predisposition of PNs.The PRS,derived from these three SNPs,emerged as an indicator for evaluating both the malignant potential of PNs and the diagnostic accuracy of MPNs via CEA.It is imperative to corroborate these findings through expansive studies spanning diverse ethnic groups.
Acknowledgements
This study was supported by the National Natural Science Foundation of China (No.82073628,81871876 and 82173609).
Footnote
Conflicts of Interest: The authors have no conflicts of interest to declare.
 Chinese Journal of Cancer Research2023年5期
- Chinese Journal of Cancer Research的其它文章
- OpenNAU: An open-source platform for normalizing,analyzing,and visualizing cancer untargeted metabolomics data
- Genetic abnormalities assist in pathological diagnosis and EBVpositive cell density impact survival in Chinese angioimmunoblastic T-cell lymphoma patients
- Baseline radiologic features as predictors of efficacy in patients with pancreatic neuroendocrine tumors with liver metastases receiving surufatinib
- A novel multimodal prediction model based on DNA methylation biomarkers and low-dose computed tomography images for identifying early-stage lung cancer
- Update of latest data for combined therapy for esophageal cancer using radiotherapy and immunotherapy: A focus on efficacy,safety,and biomarkers
- Inspired by novel radiopharmaceuticals: Rush hour of nuclear medicine
