
Preparation of a beam emission spectroscopy diagnostic based on a Lymanalpha line to diagnose core and edge-plasma density fluctuation on the HL-2A tokamak
2023-11-19 13:32YiYU余羿YixuanZHOU周艺轩RuiKE柯锐LinNIE聂林ChijieXIAO肖池阶JiquanLI李继全GuangzhouHAO郝广周MinXU许敏ZhibinWANG王志斌andJianCHEN陈坚
Plasma Science and Technology 2023年11期
Yi YU (余羿) ,Yixuan ZHOU (周艺轩) ,Rui KE (柯锐) ,Lin NIE (聂林) ,Chijie XIAO (肖池阶) ,Jiquan LI (李继全) ,Guangzhou HAO (郝广周),Min XU (许敏),Zhibin WANG (王志斌) and Jian CHEN (陈坚)
1 Sino-French Institute of Nuclear Engineering and Technology,Sun Yat-sen University,Zhuhai 519082,People’s Republic of China
2 Southwestern Institute of Physics,Chengdu 610041,People’s Republic of China
3 State Key Laboratory of Nuclear Physics and Technology,School of Physics,Peking University,Beijing 100871,People’s Republic of China
Abstract In this article,the design of a Lyman-alpha-based beam emission spectroscopy(LAB)diagnostic on the HL-2A tokamak has been proposed for the first time.The purpose of this novel diagnostic is to measure density fluctuations of tokamak plasma.The light-collection system of LAB,which consists of the first mirror and two groups of coaxial double-mirror telescopes,can realize a twosegmented viewing field of ρ=0-0.2 and ρ=0.75-1,which is optimized to measure plasma density fluctuation,not only in the edge transport barrier region but also in the internal transport barrier region,to investigate the underlying physics of turbulence in tokamaks.Spectrometers are developed to separate out the Doppler-shifted target line (122.03 and 122.17 nm) from the background Lyman-alpha line (121.53 nm).Here,30 Core-LAB channels and 30 Edge-LAB channels are under development on the HL-2A tokamak.It has high radial spatial resolutions of about 2.7 mm and 3.3 mm for the core and edge channels,respectively.Taking the high light intensity of this Lyman-alpha line into account,temporal resolution of 200 kHz can be ensured by broad bandwidth amplifiers.This high spatio-temporal resolution makes LAB a potential keen tool to experimentally investigate tokamak plasma physics.
Keywords: tokamak diagnostic,LAB,BES,plasma density fluctuation
1.Introduction
Plasma turbulence is one of the main obstacles that stops people from understanding fusion physics.In large tokamaks,it can induce strong particle and energy transport,resulting in bad confinement.Physical understanding of many turbulence phenomena is still left open.This unsatisfactory understanding comes partly from the lack of diagnostics for turbulent plasma parameters.In recent years,diagnostics which have high spatial and temporal resolutions have been developed on tokamaks,including some novel kinds,such as ultrafast charge exchange recombination spectroscopy [1],to reveal underlying turbulence physics.Among these diagnostics,beam emission spectroscopy (BES) based on heating neutral beam injection (NBI) [2-4] or diagnosing NBI [5-7]works as a keen tool for turbulence investigation,providing the two-dimensional evolution of density fluctuation profiles.Its strong ability to describe plasma behavior in detail and robust compatibility to radiation,which means that the influence of neutron and gamma rays on the detector could be reduced by using fiber,make it a widely used spectroscopic diagnostic on almost all of the large tokamaks;it is also considered for measuring various plasma parameters and possibly plasma turbulence on ITER [8].
A 48-channel BES diagnostic has been developed on the HL-2A tokamak recently for edge-plasma turbulence studies[9].This BES system has a high spatial resolution of about 0.8 cm (radial) × 1.2 cm (poloidal).Pronounced 2 kHz edge coherent oscillation(ECO)[10]has been found by BES in the edge transport barrier;however,unfortunately,the detailed information about ECO has not been studied because there are only one or two BES channels deployed in the pedestal region that take the 0.8 cm radial spatial resolution into account.The internal transport barrier (ITB) has also been investigated on the HL-2A tokamak[11],which locates in the core plasma of ρ ≤0.2.Here,ρ refers to the plasma normalized radius.BES shows its incapability in this ITB region,not only because of its limited channels but also its limited radial resolution,which is not high enough for describing detailed ITB profiles.
In this article,the full design of a novel diagnostic,which is called Lyman-alpha-based BES (LAB) is presented.The idea of LAB is the pursuit of significant improvement of spatial resolution compared with BES.This improvement comes mainly from different target lines of these two diagnostics.Traditional BES collects the visible Balmer-alpha line,while LAB collects the Lyman-alpha line,which is a kind of vacuum ultraviolet (VUV) line.It is curious that although LAB could have much better spatial resolution,all of the beam emission diagnostics worldwide collect the Balmer-alpha line,which can be traced back to the early works of pioneers [2,12].The idea of LAB was firstly proposed as early as 2001 [13],but this idea has still been brilliant in conception.This is reasonable because of the great challenge from the fabrication of optical components and detectors at the time when BES was invented.Great progresses in optics,detection techniques,material science and vacuum equipment in recent years make LAB development possible.
The rest of this article is arranged as follows.In section 2,the main ideas of BES and LAB are briefly described,and the detailed design of LAB is presented in section 3.In section 4,the discussion and conclusion are presented.
2.Principle of BES and LAB
When a neutral beam is injected into deuterium plasma,the atoms will emit several groups of lines during the de-excitation process.On the HL-2A tokamak,BES detects the intensity of the n=3→2 Doppler-shifted Balmer-alpha line(λBal=656.10 nm,unshifted).A sketch of this BES system is shown in figure 1(a).The view line is set in the red-shift direction,and the shifted wavelength Δλ is related not only to the NBI energy E,which is determined by the typical 45 keV extraction voltage of the NBI system on HL-2A,but also to the angleθbetween the viewing line and the beam line,which is about 53.26° for the edge and 40.68° for the core.
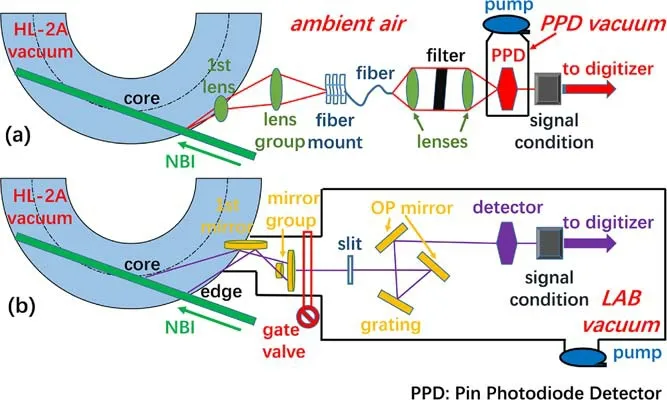
Figure 1.Sketches of(a)BES and(b)LAB on the HL-2A tokamak.
The Balmer-alpha line is collected by the first lens and is then imaged on the nonplanar surface of the fiber mount array by the lens group.A total of 48 fiber mount channels have been selected in recent HL-2A campaigns,which are located at the image part of the edge plasma.The 48 fiber bundles are fixed on the mount to transmit the light from the light-collection lenses to the devices far from the HL-2A vacuum vessel.The ability to separate out the red-shifted Balmeralpha line from the unshifted background line is crucial for a BES diagnostic.
This shift can be derived by the Doppler shift formula
wherevDstands for the speed of deuterium atoms,andcstands for the light speed.For the case mentioned above,it is easy to obtain
and
where λ0stands for the wavelength of the unshifted line,and mDstands for the mass of a deuterium atom.Substituting the parameters of BES and NBI,we can get the Doppler shift ΔλBaland the shifted wavelength λshiftfor BES: ΔλBal=2.71 nm and λshift=658.81 nm,respectively.It is easy to separate out this shifted line from the background Balmeralpha line by deploying a narrow-band filter in the light path,which has a central wavelength of 658.81 nm,as shown in figure 1(a).Then,the filtered light is transmitted into a lownoise high-efficiency pin photodiode detector(PPD).To keep it working in a low-temperature environment to achieve a decent signal to noise ratio of over 5 (20-100 kHz) without being covered by the air condensate water,this PPD is locatedin a small vacuum chamber.It is to be noted here that,except for this PPD and the first lens,all of the BES components work in the ambient air.Other components,such as the signal conditions,amplifiers and digitizer,are not discussed here for simplicity.

Table 1.The differences between BES and LAB on HL-2A.
The spatial resolution of a BES channel is determined by many factors[13],including the hardware design,such as the optics and plasma parameters.Although one can effectively enhance the spatial resolution of BES via careful optical design,it is impossible to enhance it infinitely.The atoms will move along the beam injection direction with the speed υDwhile they de-excite.The moving distance during the lifetime τBaldetermines the upper limit of the spatial resolution RBES|uppof BES.For the 656.10 nm Balmer-alpha line,the lifetime constant is about 5 ns [14],taking the rate of the n=3→2 transition and local plasma density and temperature into account [14-16].For an edge BES channel,the upper limit is RBES|upp=υD·τBal·cosα ≈7.6 mm,where α stands for the angle between the NBI line and the cross section.The best spatial resolution of the HL-2A BES system is 7.6 mm technically.Therefore,if another emission line,which has a shorter time constant,works as a substitute to the Balmeralpha line as the target line for diagnosis,the spatial resolution can be enhanced.After comparison,the Lyman-alpha line is chosen,which has a wavelength of 121.53 nm.The time constant of this line is τLym=2.1 ns,which implies that the upper spatial resolution is RLAB|upp=υD·τLym·cosα≈3.3 mm for an Edge-LAB channel (α≈43.12°) at R=2.05 m.For a core channel (R=1.73 m),where α≈54.05°,LAB has a higher upper spatial resolution of RLAB|upp=υD·τLym·cosα≈2.7 mm.The misalignment between the sightline and the magnetic field line in the plasma edge is evaluated to be similar to that in[17]for the reference shot on HL-2A.
3.Design of LAB
As discussed above,LAB has a much higher upper or,in other words,theoretical spatial resolution than BES.Except for this advantage,another thing to be noted here is that the transition rate of the Lyman-alpha line is 4.7×10⁸s-1,which is over ten times larger than that of the Balmer-alpha line (4.4×10⁷s-1).This characteristic endows LAB with probably much larger signal intensity than that of BES.
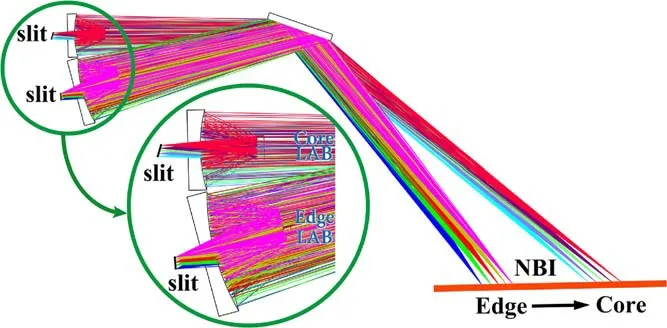
Figure 2.The design of the light-collection system,which consists of a reflection mirror and two coaxial telescopes.
The optical and technical design of the full LAB system on HL-2A has been completed and the sketch is drawn in figure 1(b).Although both BES and LAB collect the deuterium de-excitation lines,these two systems show great differences,as listed in table 1.To develop an optical diagnostic on a large tokamak,first,the viewing area is confirmed.To meet the diagnosing requirement to investigate the underlying physics of the double transport barrier,the viewing area of LAB ranges from the tokamak edge to the core.This viewing range makes the simple preparation of the 20-channel Edge-LAB optics in [17] inadequate.
There is almost no transparent material for the Lymanalpha line,which makes the light-collection system of LAB thoroughly different to that of BES.Lenses cannot be used in the LAB optical path.Instead,reflecting mirrors work as the main components,as shown in figure 1.Off-axis collection systems with three or four reflecting mirrors have been carefully designed for LAB.The main advantage of the(three or) four-mirror system is to realize a large viewing area,which covers from ρ=r/a=0 to 1.Unfortunately,this collection system cannot be efficiently optimized,although different types of aspheric mirrors and toroidal mirrors are used.The difficulty mainly comes from the limited space around the diagnosing port,the direction of light emission,a suitable magnification of~1/4,and the large first mirror.The magnification refers to the size of an image relative to the size of the object creating it.The best optimization result is proven to be that which has a maximum root mean square (RMS)radius of 1257 μm on the image plane,which is too large to use for LAB.High(eight)order toroidal mirrors are also used,which can effectively improve the maximum RMS radius up to 501 μm,which is still unacceptable,and this design results in a very large fourth mirror,which is about 500 mm.Based on these attempts,a combined light-collection mirror group is designed,which has two separated optical paths,as shown in figure 2.Light emitted from the core plasma and that from the edge are both reflected by the first mirror,while collected by different coaxial telescopes.Each group is a double-reflection mirror system,which consists of one ellipsoid mirror and one hyperbolic mirror.First,it effectively solves the problems which the off-axis (three or) four-mirror system faces.Second,it loses benefits which the off-axis(three or)four-mirror system provides.The off-axis (three or) four-mirror has a higher efficiency of light collection because of its unobstructed sight and noninterference between light from different viewing areas.It ensures a large viewing area,which covers from ρ=r/a=0 to 1,as mentioned above.It is a quite different story for the current design of the separated coaxial telescope system,as shown in figure 2.This lightcollection system has two telescopes,and each of the telescopes has its own viewing area.As a result of careful design,one telescope can collect light from the core plasma and the other from the edge.Therefore,this system cannot diagnose plasma from the core to the edge;specifically,it cannot provide the full radial profile of plasma density fluctuation.Going back to the very purpose of a developing diagnostic for the double-barrier physics,this optical design is opportunistic but effective.Thus,the viewing area for LAB is,two-segmented and the light-collection optical path is divided into two parts,i.e.a path for Core-LAB channels and a path for Edge-LAB channels.Here,30 detection channels are used to detect light emission from the core plasma,and the other 30 channels are used to detect that from the edge.The viewing areas of these 60 channels are shown in figure 3 and listed in table 2,where ρ is normalized at R0=1.65 m and a=0.4 m.As a result of this two-segmented distribution,the edge transport barrier (ETB) and ITB locations of typical HL-2A shots are covered.
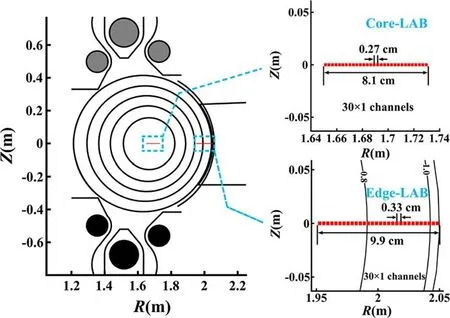
Figure 3.The two-segmented viewing area of LAB.

Table 2. The parameters of the LAB channels.
The style and parameters of the coaxial double-telescope system are carefully designed.The first mirror is a plane mirror with a size of 300 mm × 194 mm.The parameters of the aspheric mirrors in the two telescopes for the Core-LAB channels and Edge-LAB channels are listed in table 3.The spot diagrams of ten typical lines of sight of collection optics are shown in figure 4.As analyzed by ray-tracing,the maximum RMS radius is smaller than 80 μm,which meets the requirements of diagnosis.

Table 3. The parameters of aspheric mirrors in the two telescopes.
Central shielding is taken into account to evaluate the efficiency of light collection,which is 91% for the coaxial double-mirror optical path of the Core-LAB and 76%for that of the Edge-LAB,calculated by ray-tracing.The efficiency of light collection refers to the ratio of the amount of radiation reaching the image plane to the total amount of radiation received by the first mirror.The total luminous flux of the core branch is about 50% to that of the edge branch because of the smaller receivable angle of light.
MgF2is one of the few materials which has fairly good transmissivity for the 121 nm Lyman-alpha line.A doublelayer film,i.e.a MgF2film and an aluminium film,is chosen as the reflecting film coated on top of the mirrors.The reflectance of the mirrors is simulated and drawn in figure 5.AOI is the abbreviation for angle of incidence in figure 5.In this figure,0°,56° and 69.6° are the typical incident angles onto the double-mirror system,the plane mirror for light from edge plasma and the plane mirror for light from core plasma,respectively.A reflectance of higher than 80% can be conservatively expected.Glass-ceramic is used as the substrate material to make the mirrors due to its low coefficient of thermal expansion,high strength and high toughness.
Fibers are often used to transmit the Balmer-alpha line in BES,as shown in figure 1(a).This method is not suitable for LAB because the Lyman-alpha line lies in the VUV band.All components should be located in vacuum,as shown in figure 1(b),including the transmission optical paths,the lightcollection mirrors and other components (spectrometer and detector),which will be discussed in the following sections.A lens group with a sandwiched filter[4]is the most frequently used component to filter out the unshifted background Balmer-alpha line in BES.It is easy to get a filter which has a bandwidth of about 1 nm with 70% peak transmission to distinguish the 2.40 nm Doppler shift of the Balmer-alpha line on the HL-2A tokamak [4].The Doppler shift of the Lymanalpha line can be calculated using formula (1).The typical value ofθfor the edge channels is 53.26°,and the shifted wavelength is λedge=121.53+0.50 nm=122.03 nm.Similarly,the shifted wavelength for the core channels is λcore=121.53+0.64 nm=122.17 nm,with a typicalθof 40.68°.It is too difficult to use filters to separate lines which have such a small wavelength difference of about half a nanometer in the VUV spectral region.A VUV spectrometer is designed and fabricated to solve this key problem.

Figure 4.Spot diagrams of LAB collection optics.

Figure 5. Reflectance of the mirrors in the light-collection optical path of LAB.
Two spectrometers are developed to separately deal with light from core plasma and light from edge plasma,located in the LAB vacuum and following their own telescopes.Their size is significantly limited by the space around the diagnosing port and the space inside the LAB vacuum.A crisscrossed Czerny-Turner spectrometer [18] is chosen,not only for its compact structure but also for its attractive imaging performance with coma correction and a flattened spectral field.The parameters of the optical components in these two spectrometers,such as off-axis paraboloid mirrors and gratings,are the same,except for the size.The simulated optical paths inside the spectrometers are shown in figure 6(a:Core-LAB) and (b: Edge-LAB).The incident lines,including the Lyman-alpha line (green) and shifted Lyman-alpha line(blue),which are mixed together,inject into the spectrometer from the slit.The collimators are designed to be off-axis paraboloid mirrors with a focal length of 347 mm and an offaxis angle of 22°.Large-sized diffraction gratings are fabricated for the spectrometers as the main components to separate the shifted and unshifted lines from each other.Then,the lines are induced onto focusing mirrors,which are off-axis paraboloid mirrors with a focal length of 347 mm and an offaxis angle of 10°.Finally,the shifted and unshifted lines shape their own images,which are spatially separated on the imaging surface,partially zoomed in by light-blue ellipses in figures 6(a) and (b).The parameters of the collimating and focusing mirrors are listed in table 4.Large-sized gratings are fabricated for the spectrometers of the Core-and Edge-LABs and the parameters are listed in table 5.Based on such a design,the final parameters of the spectrometers are listed in table 6.
Two customized detector arrays,each of which consists of 30 absolute extreme ultraviolet (AXUV) silicon photodiode units,are located in the optical path following the spectrometers.The responsivity of the detector is 0.16 A W-1at the wavelength of 122 nm.As marked by the small red circles in figure 6,the spatial separation of the shifted and unshifted lines should be large enough to meet the detection requirements of the detector arrays.The simulated diffraction images of the shifted(blue)and unshifted(green)lines on one detector array for Core-LAB are shown in figure 7(a).It can be clearly seen that the two images are well separated and the shifted light can be efficiently collected by the AXUV units.The images of the edge plasma are worse compared with those of the core plasma,but they are still clearly separated,as shown in figure 7(b).This result is reasonable because of much higher luminous flux of the edge channels,which induces larger aberration and dispersion spots.The detected photon flux of Core-LAB is estimated to be about 4 × 10¹⁰photons/s/channel.

Figure 6. The optical paths inside the spectrometers: (a) Core-LAB and (b) Edge-LAB.

Figure 7.Diffraction images of the shifted (blue) and unshifted(green)Lyman-alpha lines on the detector arrays:(a)Core-LAB and(b) Edge-LAB.

Table 5.The parameters of the gratings for the LAB spectrometers.
The detected signal is sent to the digitizer after signal conditioning.The preamplifier board circuit includes two stages;the first stage has a gain of 2.5×10⁷V A-1,and the second stage has a gain of 2 V A-1.The overall gain of the signal amplifiers is 5 × 10⁷V A-1with a bandwidth of 200 kHz.The amplified analog signal is converted to a digital signal,and then a photoelectric conversion technique is applied before transmitting the signal to the fiber digitizer through a 15 m long twin-core fiber.After being identified and processed by the fiber digitizer,the signal is stored in the HL-2A database.
Based on the parameter selection of the above key components,the fully engineered design of the LAB system has been accomplished.Except for the requirements from the optical path,the main engineering difficulty comes from the narrow space around the HL-2A viewing port.Figure 8 shows the three-dimensional graph of the LAB system,which is almost a limit state design to meet the requirements from optics,space,vacuum and physical goals.

Figure 8.The engineering design of the LAB system on HL-2A.
4.Conclusion and discussion
For the current LAB system,which is under development,it has only 60 detection channels with a two-segmented viewing area of ρ=0-0.2 and 0.75-1.This is a matter of expediency to meet the research requirements of double-barrier physics in tokamak plasmas.This LAB cannot provide the full radial profile of plasma density fluctuation.This defect comes from the unsatisfied design of the light-collection mirror group.In principle,an off-axis four-mirror system can meet the requirements of diagnosis if a more complicated mirror surface is adopted,such as a free-form surface.Because of optimization variables and limitations from tokamak plasma,such as the distance,the viewing angle and the space around the diagnosing port,the optimal solution of the off-axis fourmirror system using a free-form surface has not been found and it will be explored in the near future.
The difficulty with the development of LAB comes mainly from two aspects.One is the short wavelength,and the other is the VUV character of the Lyman-alpha line.The indistinguishable small Doppler shift,which is proportional to the short wavelength,makes the filter system in traditional BES impotent.Spectroscopy systems work as substitutes,which greatly increases the complexity.A large grating with a size of up to 190 mm×210 mm and a delicate grating constant of up to 1/3600 mm greatly increases the difficulty associated with LAB development and the price.The VUV character brings extra work related to vacuum pumping,which increases the requirements of the outgassing properties of the material and components in the LAB vacuum and poses risks to the main HL-2A vacuum.The limited space near the LAB port also increases the difficulty in the design and vacuum maintenance.
In summary,the first LAB diagnostic has been designed and it will be tested on the HL-2A tokamak in the 2023 experimental campaign.It is hoped to provide a way to diagnose core and edge-plasma density fluctuation with a high spatial resolution of about 3 mm.
Acknowledgments
The authors would like to thank the HL-2A group for their extensive support.This work is supported by the National Key R&D Program of China (Nos.2022YFE03100002,2017YFE0301201 and 2018YFE0303102),Sichuan Science and Technology Program (Nos.2022JDJQ0038 and 2020JDTD0030),and National Natural Science Foundation of China (No.12205087).
 Plasma Science and Technology2023年11期
- Plasma Science and Technology的其它文章
- Preparation of highly efficient antibacterial non-woven by facile plasma-induced graft polymerizing of DADMAC
- Multiple chemical warfare agent simulant decontamination by self-driven microplasma
- Wet flashover voltage improvement of the ceramics with dielectric barrier discharge
- Experimental and numerical investigation on the uniformity of nanosecond pulsed dielectric barrier discharge influenced by pulse parameters
- Investigation of phase modulation and propagation-route effect from unmatched large-scale structures for Doppler reflectometry measurement through 2D full-wave modeling
- SOLPS-ITER drift modeling of neon impurity seeded plasmas in EAST with favorable and unfavorable toroidal magnetic field direction