
Geographic patterns of taxonomic and phylogenetic β-diversity of angiosperm genera in regional floras across the world
2023-11-14 05:46:00HongQianShenhuaQian
植物多样性 2023年5期
Hong Qian ,Shenhua Qian
a Research and Collections Center, Illinois State Museum,1011 East Ash Street, Springfield, IL 62703, USA
b Key Laboratory of the Three Gorges Reservoir Region's Eco-Environment, Ministry of Education, Chongqing University, Chongqing 400045, China
Keywords:Angiosperm Beta diversity Flowering plant Latitudinal gradient Phylogenetic relatedness
ABSTRACT Beta diversity (β-diversity) is the scalar between local (α) and regional (γ) diversity.Understanding geographic patterns of β-diversity is central to ecology,biogeography,and conservation biology.A full understanding of the origin and maintenance of geographic patterns of β-diversity requires exploring both taxonomic and phylogenetic β-diversity,as well as their respective turnover and nestedness components,and exploring phylogenetic β-diversity at different evolutionary depths.In this study,we explore and map geographic patterns of β-diversity for angiosperm genera in regional floras across the world.We examine both taxonomic and phylogenetic β-diversity and their constituent components,and both tip-weighted and basal-weighted phylogenetic β-diversity,and relate them to latitude.On the one hand,our study found that the global distribution of β-diversity is highly heterogeneous.This is the case for both taxonomic and phylogenetic β-diversity,and for both tip-weighted and basal-weighted phylogenetic β-diversity.On the other hand,our study found that there are highly consistent geographic patterns among different metrics of β-diversity.In most cases,metrics of β-diversity are negatively associated with latitude,particularly in the Northern Hemisphere.Different metrics of taxonomic βdiversity are strongly and positively correlated with their counterparts of phylogenetic β-diversity.
1.Introduction
Beta diversity,or β-diversity,quantifies the change in species composition across space or time.The proportion of species shared between two areas often decreases with increasing the distance separating them (Nekola and White,1999).For a given geographic distance separating two areas,β-diversity can differ greatly between different regions (e.g.,temperate versus tropical regions)(McFadden et al.,2019;Qian et al.,2020).Understanding geographic patterns of β-diversity is central to both conceptual questions of ecology and biogeography (such as the origin and distribution of biodiversity) and to applied issues of conservation biology (Whittaker,1972;McKnight et al.,2007;Buckley and Jetz,2008).Alpha diversity (α-diversity),which describes species richness within single sites,and β-diversity together determine species richness at a regional extent such as a continent or biogeographic region(i.e.,gamma diversity or γ-diversity)(Whittaker,1972).For a given α-diversity,greater β-diversity between areas within a region would lead to greater γ-diversity in the region.It is thought that higher species diversity in tropical regions than in temperate regions is because β-diversity is higher in tropical regions,compared to temperate regions (Stevens,1989).
Classical measures of β-diversity focus on species-centric metrics of β-diversity,i.e.,taxonomic β-diversity (Koleff et al.,2003).Total β-diversity between areas can be quantified by dissimilarity indices such as the Sørensen dissimilarity index(Baselga,2010).Total β-diversity measured by a dissimilarity index consists of two components: species turnover and species nestedness.Species turnover represents species replacement between areas whereas species nestedness represents the degree to which the species in the area with fewer species is a subset of the species in the area with more species (Baselga,2010).A full understanding of the origin and maintenance of geographic patterns of β-diversity in a region requires investigating the relative importance of each of these two components to total β-diversity(Baselga,2010;Qian et al.,2020).
While metrics of taxonomic β-diversity are useful to measure the degrees of overlap and distinctness of species between areas,they do not account for evolutionary history,e.g.,phylogenetic relatedness between species (Graham and Fine,2008).Incorporating information regarding differences in evolutionary history between species in a study of β-diversity can help understand the ecological and evolutionary mechanisms structuring communities (Ives and Helmus,2010).Phylogenetic β-diversity metrics,which are based on phylogenetic relatedness among species,can detect community similarity when two focal communities share no species.Examining taxonomic and phylogenetic β-diversity simultaneously can provide insights into both contemporary ecological and historical(evolutionary) mechanisms shaping variation in species diversity and composition among biological assemblages(Graham and Fine,2008;Peixoto et al.,2017;C′assia-Silva et al.,2019;Qian et al.,2020).Analogous to taxonomic β-diversity,which measures change in species composition across space,phylogenetic β-diversity measures the extent to which assemblages differ in terms of the evolutionary relationships of its members(Graham and Fine,2008).
Angiosperms (i.e.,flowering plants) are major components of most terrestrial ecosystems across the world.A recent study (i.e.,Xu et al.,2023)has investigated geographic patterns of β-diversity for angiosperm trees in the world.However,a large portion of the world's land was not included in their study.Furthermore,their study only included angiosperm tree species,which account for less than 20%of all angiosperm species in the world(Qian et al.,2019b,2022).It is unknown how well the geographic patterns of angiosperm trees observed in their study can represent geographic patterns of overall angiosperm species.Several studies have investigated geographic patterns of β-diversity in angiosperm at regional scales(e.g.,Qian et al.,2013,2020,2021),but such studies for overall angiosperms at a global scale remain lacking.
In this study,we explore and map geographic patterns of β-diversity for angiosperm genera in regional floras across the world.We examine both taxonomic and phylogenetic β-diversity and their constituent components,and both tip-weighted and basalweighted phylogenetic β-diversity.Previous studies have shown that β-diversity decreases with increasing latitude within regions or continents(e.g.,Qian et al.,2020,2021).Accordingly,we test this hypothesis by examining the relationships of β-diversity and their constituent components with latitude at a global scale and for the Northern and Southern Hemispheres separately.This study fills a critical knowledge gap.
2.Materials and methods
2.1.Angiosperm assemblage data
Geographic units of this study were the 420 geographic standard units (Liu et al.,2023).Each geographic unit was,on average,366,179 km2.Data of native angiosperm genera in each geographic unit were compiled based on the plant database of the Floristic Map of the World (FMW) available at https://en.geodata.pku.edu.cn/index.php?c=content&a=list&catid=199,which was used in Liu et al.(2023),and the database of the World Checklist of Vascular Plants (WCVP;accessible via Plants of World Online at https://powo.science.kew.org/;Brown et al.,2023).Specifically,we matched geographic units between the two data sources,used the package rWCVP(Brown et al.,2023)to extract genus lists of native angiosperms from WCVP for each of the geographic units,used the genus lists derived from WCVP to filter out non-native genera in each geographic unit in the FMW data,and expanded and updated the FMW data with the WCVP data by adding those genera that are present as native in WCVP but absent from the FMW data for those geographic units that were perfectly matched between the two data sources.As a result,a total of 13,814 genera of angiosperms were included in the 420 geographic units.
2.2.Phylogenetic tree
We generated a genus-level phylogenetic tree for angiosperms using the functions build.nodes.1 and Scenario 3 of the package U.PhyloMaker (Jin and Qian,2023) and the megatree GBOTB.extended.WCVP.tre(Jin and Qian,2022,2023),which was an updated version of the megatree GBOTB.tre generated by Smith and Brown(2018),as a backbone phylogeny.We pruned to resulting phylogenetic tree to retain one tip per genus.For a genus with multiple species,a tip of the most inclusive cluster of the genus was used to represent the genus.Phylogenetic trees generated by U.PhyloMaker or its sister packages(Qian and Jin,2016;Jin and Qian,2019,2022)have been commonly used in studies on phylogenetic diversity and structure in regional and global floras(e.g.,Qian and Jin,2021;Yue and Li,2021;Zhang et al.,2021;Huang et al.,2023;Qian,2023;Zhou et al.,2023).
2.3.Metrics of taxonomic and phylogenetic β-diversity
We used the Sørensen dissimilarity index(βsor)to measure both taxonomic and phylogenetic β-diversity.We partitioned βsorinto two components: turnover (βsim) and nestedness (βnes).βsimis the Simpson dissimilarity index;it quantifies β-diversity due to turnover(or replacement) of species between geographic units;thus it quantifies true turnover of species without the influence of difference in species richness between geographic units.βnesquantifies βdiversity resulting from nestedness of species between geographic units.βsorand its two components are defined as follows (Baselga,2010): βsor=(b+c)/(2a+b+c),βsim=min(b,c)/[a+min(b,c)],and βnes=βsor-βsim,where,when taxonomic β-diversity is concerned,ais the number of species shared by the two localities,bis the number of species unique to one locality andcis the number of species unique to the other locality (Baselga,2010);when phylogenetic β-diversity is considered,shared and unique species are replaced with shared and unique branch lengths,respectively(Leprieur et al.,2012).We denoted β-diversity and its two components as βsor.tax,βsim.taxand βnes.taxfor taxonomic β-diversity,and as βsor.phy,βsim.phyand βnes.phyfor phylogenetic β-diversity.Both βsor.taxand βsor.phyvary from 0(all species or branch lengths shared by the two sites)to 1(no species or branch lengths shared by the two sites).
The ratio of βnesto βsor(i.e.,βratio=βnes/βsor) represents the relative influence of turnover and nestedness on total β-diversity(Dobrovolski et al.,2012;Peixoto et al.,2017).We calculated βratiofor both taxonomic and phylogenetic β-diversity(Dobrovolski et al.,2012;see also Peixoto et al.,2017;Pinto-Ledezma et al.,2018;Qian et al.,2020).A value of βratiosmaller than 0.5 indicates that β-diversity is determined mainly by turnover whereas a value of βratiogreater than 0.5 indicates that nestedness is the more important component than turnover in driving β-diversity(Dobrovolski et al.,2012).βratiofor taxonomic and phylogenetic β-diversity was denoted as βratio.taxand βratio.phy,respectively.
Phylogenetic β-diversity deviation (βdev) from taxonomic β-diversity was calculated as:βdev=(βsor.tax-βsor.phy)/βsor.tax(Qian et al.,2020).βdevmeasures the extent to which the dissimilarity in the species composition between two communities mirrors differences at deeper phylogenetic levels.βdevreflects the degree of lineage exchanges between localities over time (Peixoto et al.,2017;Pinto-Ledezma et al.,2018).When values of βdevare compared across a geographic region,βdevidentifies places where turnover of phylogenetic lineages is high or low with respect to turnover of species.
βsor.phyis a tip-weighted metric of phylogenetic β-diversity and is more sensitive to turnover near the tips of the phylogeny (i.e.,more recently diverged clades) (Swenson,2011).In contrast,βmpd(also called Dpwin the literature;e.g.,Swenson,2011;McFadden et al.,2019;Qian et al.,2021) measures the mean pairwise phylogenetic distance between all species pairs in two assemblages(Webb et al.,2008;Swenson,2011).Thus,βmpdmeasures turnover of deeper nodes of the phylogeny,compared with βsor.phy.βmpdis a basal-weighted metric of phylogenetic β-diversity(Swenson,2011;McFadden et al.,2019).In addition to exploring geographic patterns of tip-weighted phylogenetic β-diversity (i.e.,βsor.phy) reflecting shallow evolutionary history,we also explored geographic patterns of basal-weighted phylogenetic β-diversity (i.e.,βmpd) reflecting deep evolutionary history.We used the formula for Dpwin Swenson(2011) to calculate βmpd.
We used the following R packages in computing β-diversity metrics: betapart (Baselga and Orme,2012),vegan (Dixon,2003),picante(Kembel et al.,2010),and PhyloMeasures(Tsirogiannis and Sandel,2016).
2.4.Data analysis
We used a neighborhood approach (also called moving window approach) to determine β-diversity for each of the 420 geographic units.Specifically,we calculated the average β-diversity between a focal geographic unit and each of its six closest neighboring geographic units.This approach,or a similar one,has been commonly used in β-diversity studies (e.g.,McFadden et al.,2019;Qian et al.,2020,2021).In our preliminary analyses,we also calculated the average β-diversity between a focal geographic unit and each of its four closest neighboring geographic units,and found that the average values of β-diversity metrics based on the four closest neighboring geographic units were highly correlated with those based on the six closest neighboring geographic units(e.g.,correlation coefficient is 0.967 for βsor.tax),indicating that the approach of using the six closest neighboring geographic units in our study would be sufficiently robust.We did not use a larger number of the closest neighboring geographic units to avoid or minimize the inclusion of neighboring geographic units that were far away from the focal geographic unit.In this study,on average,the distance between the centroid of each geographic unit and the centroids of its six closest neighboring geographic units was 718 km.
We related β-diversity to latitude (the centroid of each geographic unit).We considered a correlation (Spearman's rank correlation coefficient,rs)to be strong for|rs|>0.66,moderate for 0.66 ≥|rs| >0.33,and weak for |rs| ≤0.33 (Qian et al.,2019a).We used SYSTAT v.7 (Wilkinson et al.,1992) for statistical analyses.
3.Results
3.1.Total β-diversity
Total taxonomic β-diversity (βsor.tax) was strongly correlated to total phylogenetic β-diversity(βsor.phy)(rs=0.994,P<0.001).As a result,geographic patterns of taxonomic β-diversity are very similar to those of phylogenetic β-diversity (Fig.1).Regions with high total β-diversity were located in a belt including northern Africa,Arabian Peninsula,eastward to India and eastern Himalaya,which were followed by northeastern North America,southern South America,southern Africa,Madagascar,and several regions in Oceania(Fig.1).Regions with low total β-diversity were located in Brazil,southeastern North America,northern Eurasia,and southeastern China (Fig.1).

Fig.1. Geographic patterns of total taxonomic and phylogenetic β-diversity (βsor.tax and βsor.phy) for angiosperm genera in regional floras in the world.
3.2.Turnover component of β-diversity
The turnover component of taxonomic β-diversity(βsim.tax)was also strongly correlated with that of phylogenetic β-diversity(βsim.phy) (rs=0.977,P<0.001).Geographic patterns of the turnover component of taxonomic β-diversity (βsim.tax) were similar to those of phylogenetic β-diversity(βsim.phy) (Fig.2).They were,to a large degree,similar to those of total β-diversity (compare Fig.2 with Fig.1).Correlation coefficient was 0.774 (P<0.001) between βsim.taxand βsor.tax,and was 0.728(P<0.001) between βsim.phyand βsor.phy.
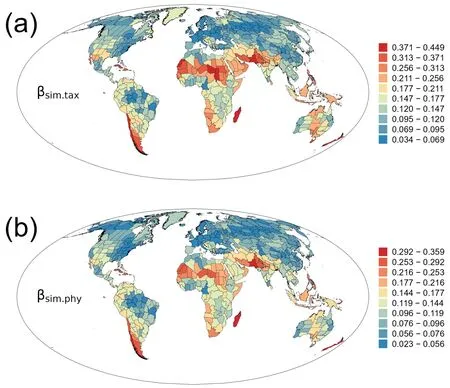
Fig.2. Geographic patterns of the turnover components of taxonomic and phylogenetic β-diversity (βsim.tax and βsim.phy) for angiosperm genera in regional floras in the world.
3.3.Nestedness component of β-diversity
The nestedness component of taxonomic β-diversity (βnes.tax)was strongly correlated to that of phylogenetic β-diversity(βnes.phy)(r=0.978,P<0.001).Geographic patterns of the nestedness component of taxonomic β-diversity(βnes.tax)were similar to those of phylogenetic β-diversity (βnes.phy) (Fig.3).They were,to some degree,similar to those of total β-diversity (compare Fig.3 with Fig.1)and those of the turnover component of β-diversity(compare Fig.3 with Fig.2).Coefficients of correlation of βnes.taxwith βsor.taxand βsim.taxwere 0.740 and 0.220,respectively,and coefficients of correlation of βnes.phywith βsor.phyand βsim.phywere 0.792 and 0.224,respectively(P<0.05 in all cases).

Fig.3. Geographic patterns of the nestedness components of taxonomic and phylogenetic β-diversity (βnes.tax and βnes.phy) for angiosperm genera in regional floras in the world.
3.4.Ratio of nestedness to total β-diversity
Geographic patterns of βratio,which quantifies how much the nestedness components contribute to total β-diversity,were highly congruent between taxonomic and phylogenetic β-diversity(r=0.961,P<0.001).The ratio was,in general,high in regions in northern North America,at mid latitudes in Eurasia,western China,and tropical Africa (Fig.4).The vast majority of these regions had values of βratio.taxand βratio.phylarger than 0.5.
3.5.Deviation between phylogenetic and taxonomic β-diversity
Deviation between phylogenetic and taxonomic β-diversity(i.e.,βdev) was positive in all regions across the world (Fig.5).Regions with high values of βdevwas primarily located in North America,northern Eurasia,northeastern Africa,and Brazil (Fig.5),whereas regions with low values of βdevwas primarily located in mid latitudes of Asia and Indo-China,northern and southern South America,northwestern and central Africa,and eastern Australia(Fig.5).
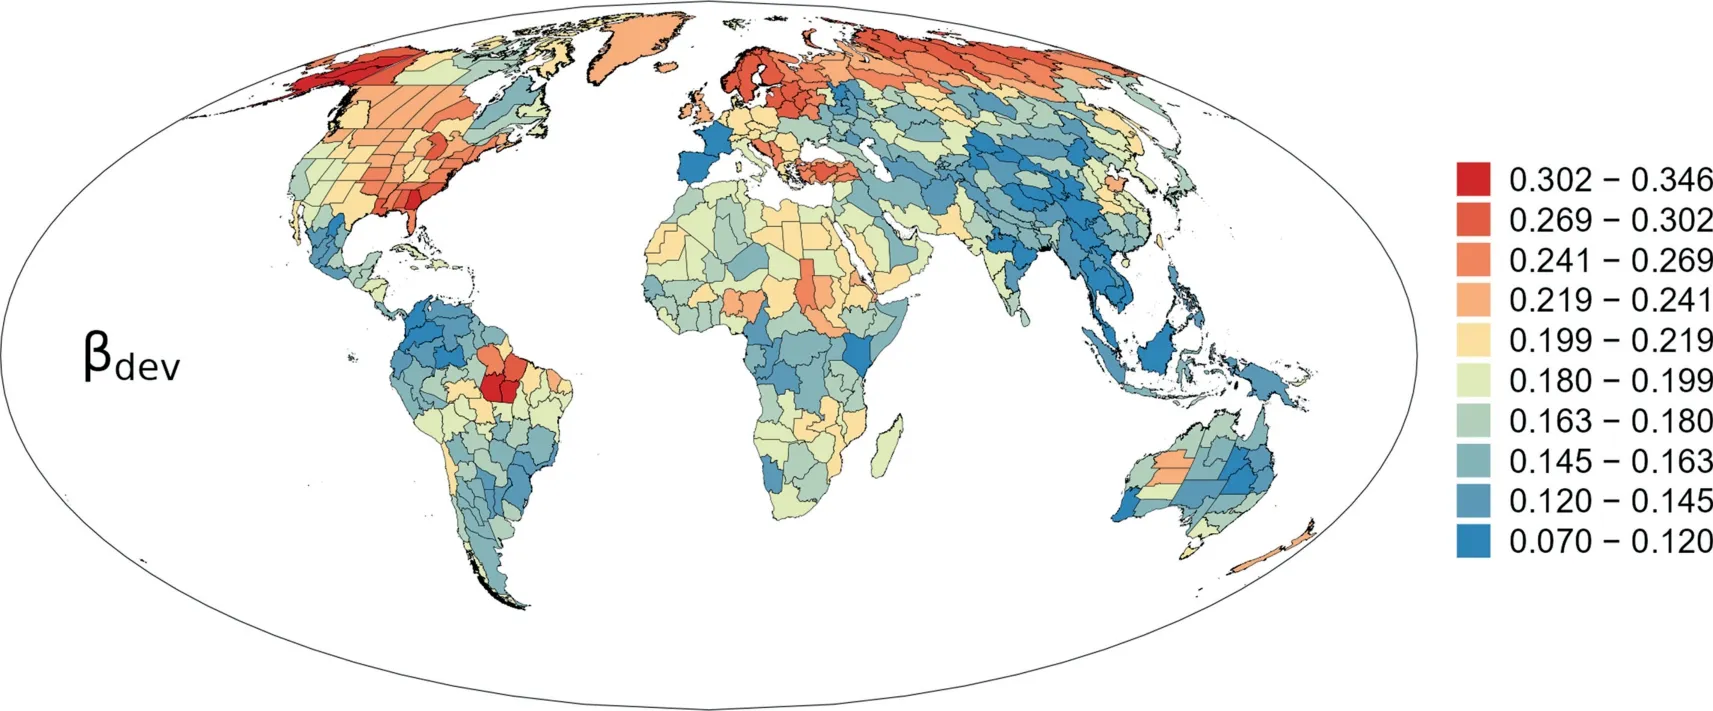
Fig.5. Geographic patterns of the deviation of phylogenetic β-diversity with respect to taxonomic β-diversity (βdev) for angiosperm genera in regional floras in the world.
3.6.β-diversity at deep evolutionary history
Geographic patterns of high versus low values of basalweighted phylogenetic β-diversity (βmpd) were conspicuous(Fig.6).In the New World,most of the regions in South America and eastern North America had high βmpd,and regions with low βmpdwere located in southwestern North America and southernmost South America (Fig.6).In the Old World,regions with low βmpdwere located in the combination of the mega-region from central Asia westward to northern Africa and northwestward to northern Europe;and most of the remainder regions,which were from eastern and southwestern China southward to Australia and New Zealand,had high βmpd(Fig.6).
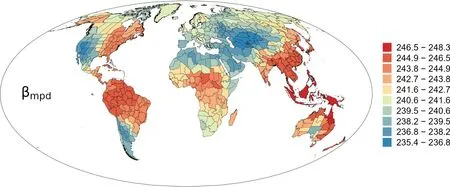
Fig.6. Geographic patterns of basal-weighted phylogenetic β-diversity (βmpd) for angiosperm genera in regional floras in the world.
3.7.Relationships between β-diversity and latitude
When all the 420 geographic units worldwide were considered together,taxonomic and phylogenetic β-diversity (i.e.,βsor.taxand βsor.phy) and their turnover and nestedness components (i.e.,βsim.tax,βnes.tax,βsim.phyand βnes.phy),were negatively correlated with latitude (Table 1).Basal-weighted phylogenetic β-diversity(i.e.,βmpd) was also negatively correlated with latitude.However,the ratio of nestedness to total β-diversity (i.e.,βratio.taxand βratio.phy) and the deviation between phylogenetic and taxonomic β-diversity (i.e.,βdev) were all positively correlated with latitude(Table 1).When geographic units in the Northern and Southern Hemispheres were analyzed separately,each metric of taxonomic and phylogenetic β-diversity (i.e.,βsor.taxand βsor.phy) and their turnover and nestedness components (i.e.,βsim.tax,βnes.tax,βsim.phyand βnes.phy) was also negatively correlated with latitude in the Northern Hemisphere (Fig.7),consistent with the pattern at the global scale,but was positively correlated with latitude in the Southern Hemisphere (Fig.7).Basal-weighted phylogenetic β-diversity (i.e.,βmpd) was negatively correlated with latitude in both Northern and Southern Hemispheres (Fig.8).

Table 1 Spearman's rank correlation coefficient for the relationship between each metric of β-diversity and absolute latitude for angiosperm genera in regional floras in the world.
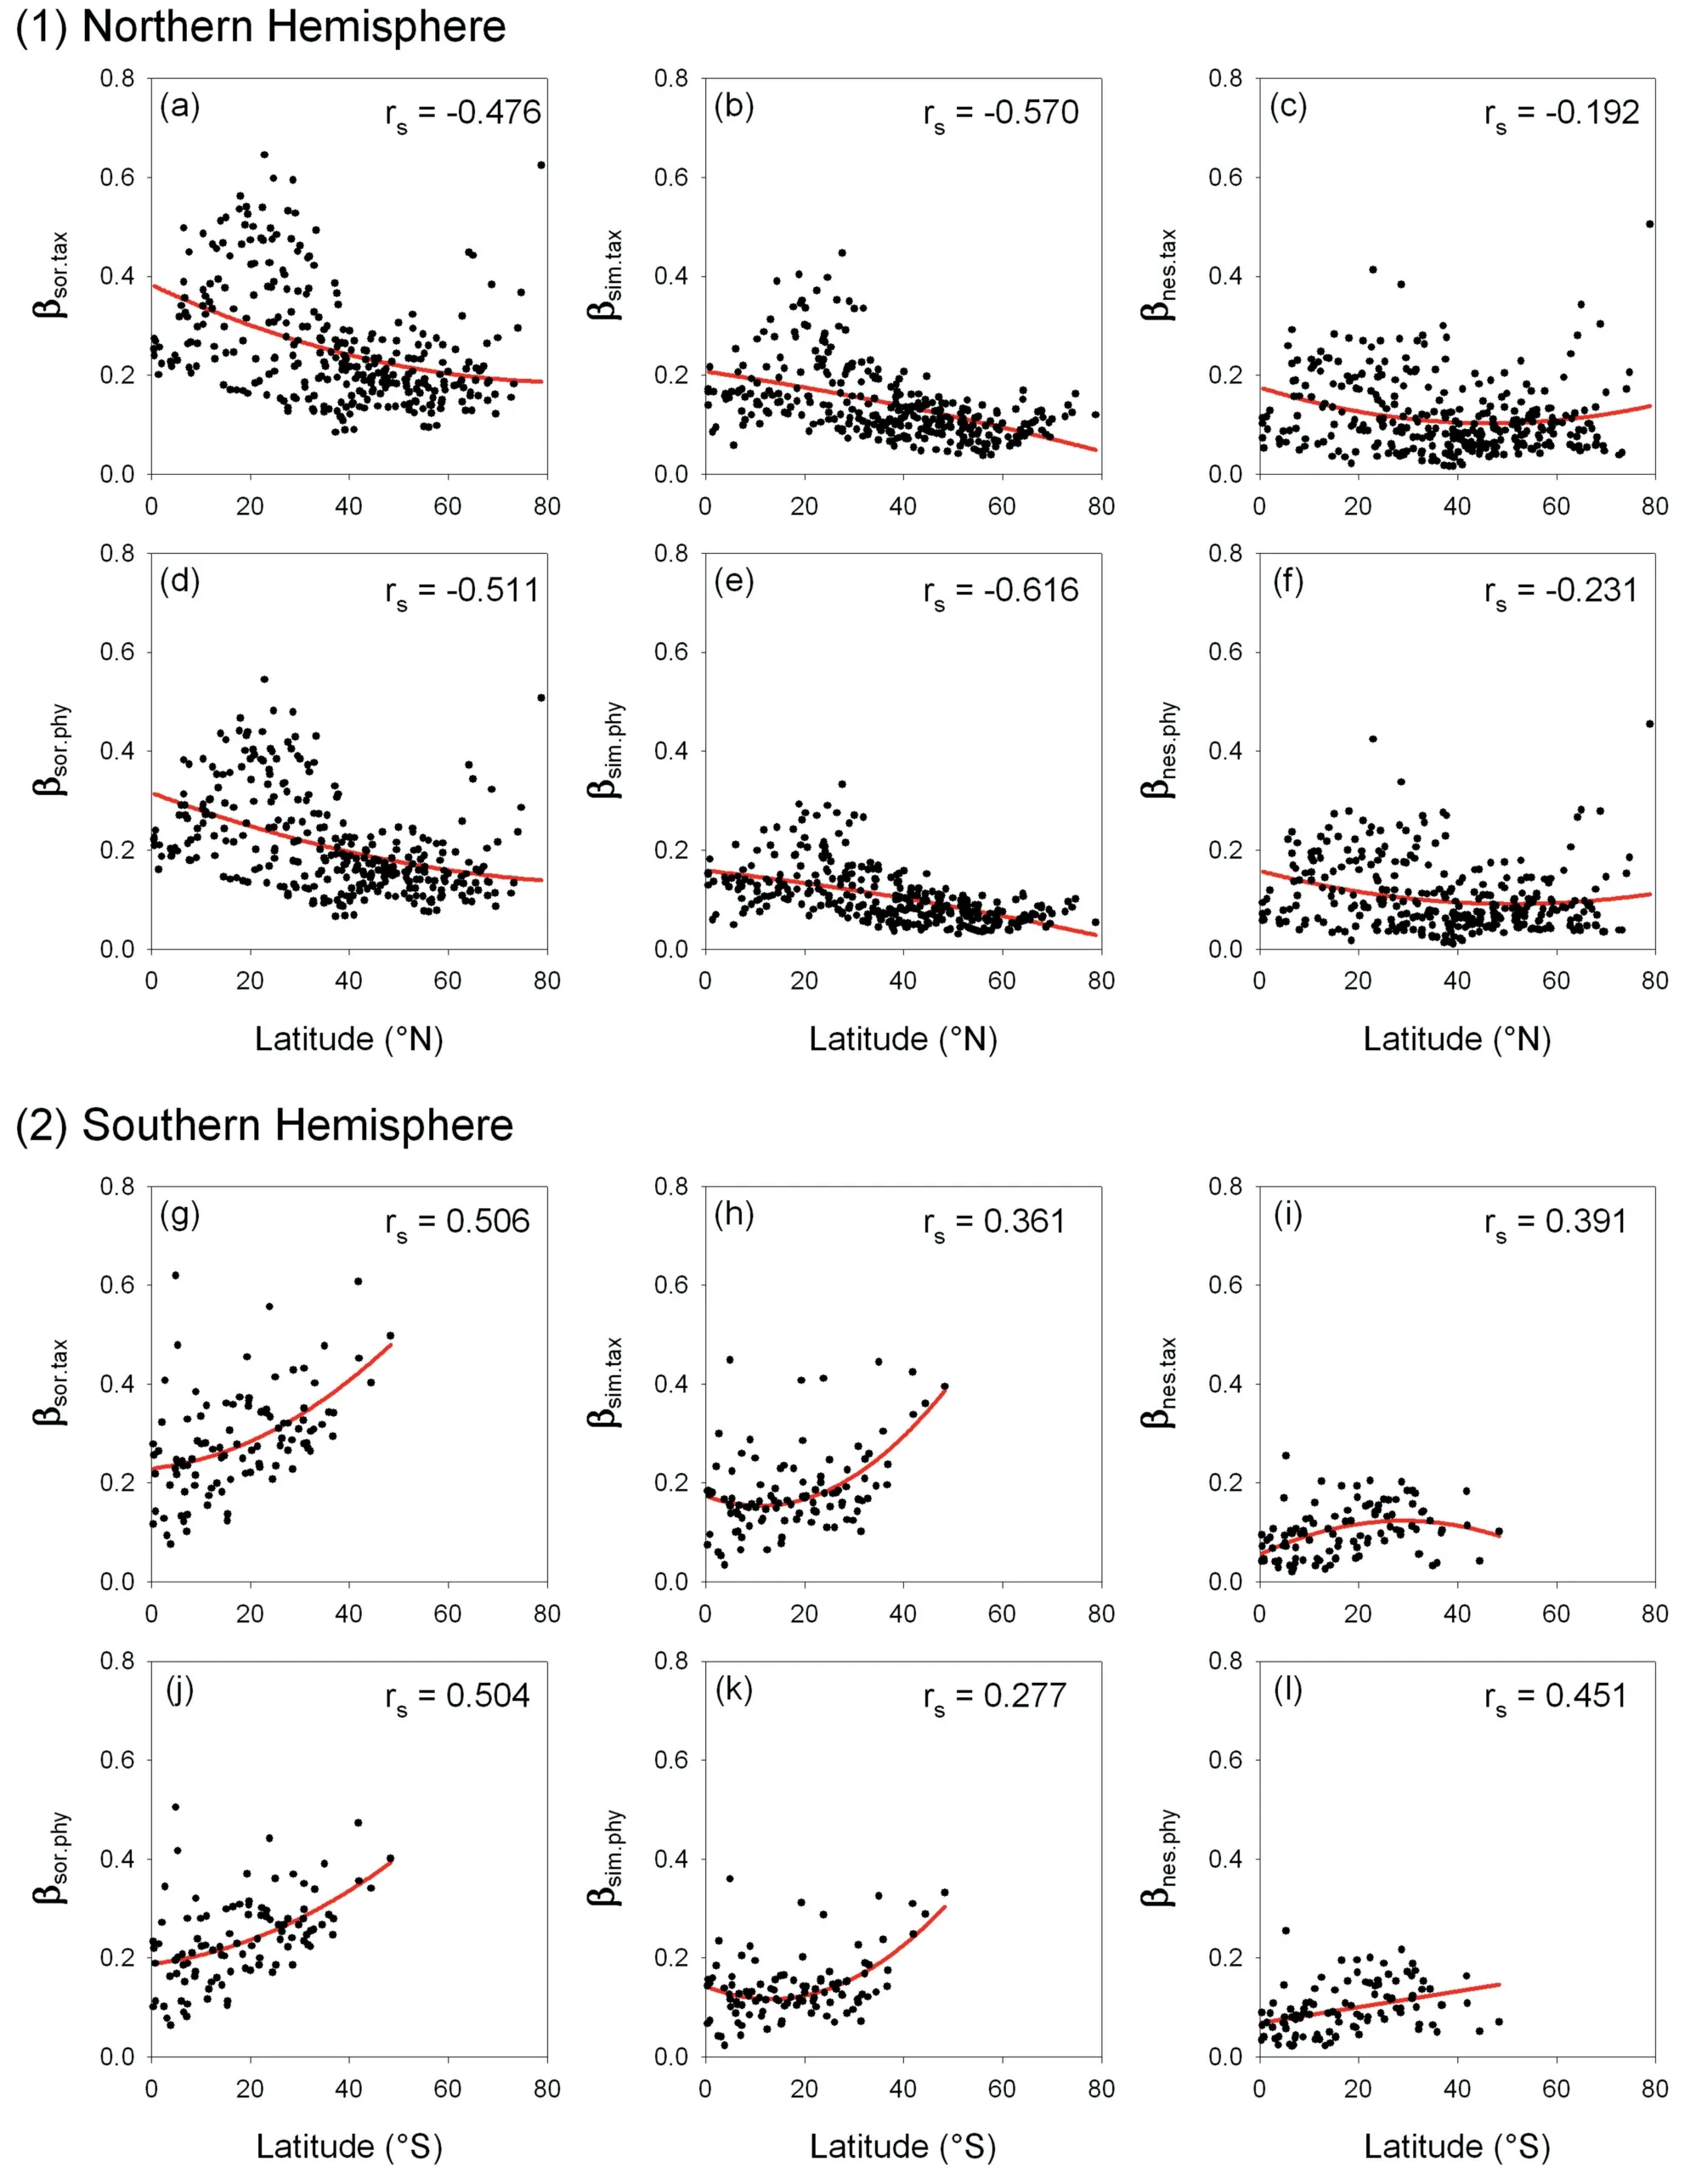
Fig.7. Relationships (Spearman's rank correlation coefficient,rs) between each metric of taxonomic and phylogenetic β-diversity and latitude for angiosperm genera in regional floras in (1) the Northern Hemisphere and (2) the Southern Hemisphere.Lines are the least squares fitting with the second-degree polynomial.

Fig.8. Relationships (Spearman's rank correlation coefficient,rs) between basal-weighted phylogenetic β-diversity (βmpd) and latitude for angiosperm genera in regional floras in(a) the Northern Hemisphere and (b) the Southern Hemisphere.Lines are the least squares fitting with the second-degree polynomial.
4.Discussion
Here we have leveraged a large dataset of distributions and evolutionary relationships to map taxonomic and phylogenetic βdiversity of angiosperm genera in regional floras across the world.Previous studies on β-diversity of angiosperms either did not simultaneously investigate both taxonomic and phylogenetic βdiversity or investigated both taxonomic and phylogenetic β-diversity but included assemblages in only one or two continents(e.g.,North America,Qian et al.,2013;Pinto-Ledezma et al.,2018;Americas,McFadden et al.,2019;China,Qian et al.,2020).To the best of our knowledge,the present study is the first to explore taxonomic and phylogenetic β-diversity of angiosperms at a global scale.Thus,the finding of this study fills a critical knowledge gap.
Our study found that taxonomic and phylogenetic β-diversity is highly heterogeneous across the world.At the global scale,we found that both taxonomic and phylogenetic β-diversity is negatively,albeit not strongly,correlated with latitude.This finding is consistent with the finding of a recent study(Qian et al.,2023)that taxonomic and phylogenetic α-diversity of angiosperms in regional floras across the world is negatively correlated with latitude.However,there exist conspicuous discrepancies in geographic patterns between α-diversity and β-diversity for angiosperms in some continental regions.For example,regions with the highest taxonomic and tip-weighted phylogenetic β-diversity of angiosperms are located in the Sahara and the Arabian Peninsula(Fig.1),but these regions have,in general,low taxonomic and phylogenetic α-diversity of angiosperms,as shown in fig.1 of Qian et al.(2023).Within the New World,regions at high latitudes have higher taxonomic and tip-weighted phylogenetic β-diversity of angiosperms than those at low latitudes(Fig.1),but the opposite pattern is observed for taxonomic and phylogenetic α-diversity of angiosperms(Qian et al.,2023).Furthermore,regions within a large land mass located in the combination of southern China and Indo-China,which is located in warm and humid subtropical or tropical climates,have high taxonomic and phylogenetic α-diversity of angiosperms(Qian et al.,2023),but these regions have low taxonomic and tip-weighted phylogenetic β-diversity of angiosperms,as shown in this study.Because these two studies focused on different taxonomic ranks(i.e.,the genus rank in this study,the species rank in Qian et al.,2023),part of the discrepancies between these two studies may result from the use of composition data at different taxonomic ranks.It is also possible that at a given taxonomic rank,geographic patterns of β-diversity do not match those of α-diversity at a global scale,although consistency in geographic patterns of αand β-diversity has been found in studies at regional and continental scales (e.g.,Qian et al.,2019a,2020).
Interestingly,when geographic units in the Northern and Southern Hemispheres were analyzed separately,each metric of taxonomic and phylogenetic β-diversity and their turnover and nestedness components(i.e.,βsor.tax,βsim.tax,βnes.tax,βsor.phy,βsim.phyand βnes.phy) was negatively correlated with latitude in the Northern Hemisphere,but was positively correlated with latitude in the Southern Hemisphere(Fig.7).Why the two hemispheres show the opposite relationships between the phylogenetic metrics and latitude remains not clear.
We found that taxonomic and tip-weighted phylogenetic β-diversity (i.e.,βsor.taxand βsor.phy,respectively) is highly correlated across the world (Fig.1).This is true also for their turnover and nestedness components (i.e.,βsim.taxversus βsim.phy;βnes.taxversus βnes.phy).Similar findings have been reported in studies for regional assemblages of angiosperm in China and North America(Qian et al.,2013,2020).Our study found that taxonomic β-diversity is higher than tip-weighted phylogenetic β-diversity for each angiosperm assemblage across the world (βdev>0),which is expected as phylogenetic β-diversity captures deeper evolutionary similarity in biological community composition.Our finding suggests that βdiversity patterns predominantly consist in the exchange of phylogenetically close species across space (i.e.,species belonging to the same lineage)rather than distant ones(i.e.,species belonging to different lineages).Lower tip-weighted phylogenetic β-diversity than taxonomic β-diversity has been also found in previous regional or continental studies on β-diversity for angiosperms(e.g.,Qian et al.,2020).Interestingly,in their study on β-diversity in mammals across the world,Peixoto et al.(2017) found that some regions have negative values of βdev,which is not expected.
Our study found that turnover and nestedness components of βdiversity are positively correlated with each other,regardless of whether taxonomic β-diversity or phylogenetic β-diversity is considered.This finding is inconsistent with that of Qian et al.(2020),who found that patterns of variation in the turnover and nestedness components tend to be opposite for both taxonomic and phylogenetic β-diversity of angiosperm species in China.This discrepancy may result from differences in spatial extent (i.e.,global versus regional) and at taxonomic rank (i.e.,the genus rank in our study versus the species rank in their study).
Of the ten metric of β-diversity examined in this study,the metric of basal-weighted phylogenetic β-diversity (i.e.,βmpd)showed the strongest geographic pattern,and was correlated most strongly with latitude (rs=-0.508;Table 1).Global geographic patterns of βmpdare highly consistent with those of phylogenetic αdiversity reported in Qian et al.(2023).For example,regions in humid tropical climates in Africa,Asia,and South America have high values of both βmpdand Faith's (1992) phylogenetic diversity(compare Fig.6 with fig.1b of Qian et al.,2023).Our study showed that the hotspot of the basal-weighted phylogenetic β-diversity is located on islands in Southeast Asia,from where it decreases northwestwards until reaching central Asia,which is to the coldspot of the basal-weighted phylogenetic β-diversity.This finding is generally consistent with the finding of Qian et al.(2021),who found that within China,basal-weighted phylogenetic β-diversitydecreases from the southeast towards the northwest.McFadden et al.(2019) investigated geographic patterns of basal-weighted phylogenetic β-diversity across Americas.The geographic patterns reported in their study are generally opposite to the geographic patterns of basal-weighted phylogenetic β-diversity observed in our study for Americas.For example,they found that regions with high values of basal-weighted phylogenetic β-diversity are located in southwestern North America and southern South America,as shown in their fig.4c,but these regions had low values of basalweighted phylogenetic β-diversity in our study (Fig.6).It is not clear whether the use of taxa at different taxonomic ranks might have resulted in the discrepancy between the two studies.
In conclusion,we have explored geographic patterns of various aspects of taxonomic and phylogenetic β-diversity for angiosperm genera in regional floras across the world.Our study found that taxonomic and phylogenetic β-diversity is highly heterogeneous across the world on the one hand,and there are highly consistent geographic patterns among different metrics of phylogenetic βdiversity on the other hand.In most cases,metrics of β-diversity are negatively associated with latitude,particularly in the Northern Hemisphere.Different metrics of taxonomic β-diversity are strongly and positively correlated with their counterparts of phylogenetic β-diversity.
Author contributions
H.Q.designed research,analyzed data,and wrote the paper;S.Q.compiled and analyzed data;both authors participated in revising the paper.
Data availability statement
The data used in this study have been published and cited.
Declaration of competing interest
The authors have no competing interest to declare.
- 植物多样性的其它文章
- Is intraspecific trait differentiation in Parthenium hysterophorus a consequence of hereditary factors and/or phenotypic plasticity?
- Convergent relationships between flower economics and hydraulic traits across aquatic and terrestrial herbaceous plants
- Integrative analysis of the metabolome and transcriptome reveals the potential mechanism of fruit flavor formation in wild hawthorn(Crataegus chungtienensis)
- Evidence of the oldest extant vascular plant (horsetails)from the Indian Cenozoic
- Climate change impacts the distribution of Quercus section Cyclobalanopsis(Fagaceae),a keystone lineage in East Asian evergreen broadleaved forests
- Resolving a nearly 90-year-old enigma: The rare Fagus chienii is conspecific with F.hayatae based on molecular and morphological evidence