
Climate change impacts the distribution of Quercus section Cyclobalanopsis(Fagaceae),a keystone lineage in East Asian evergreen broadleaved forests
2023-11-14 05:46:10LinLinXiaoLongJiangKaiQiGuoAmyByrnMinDng
植物多样性 2023年5期
Lin Lin ,Xiao-Long Jiang ,Kai-Qi Guo ,Amy Byrn ,Min Dng ,*
a School of Ecology and Environmental Sciences, Yunnan Key Laboratory of Plant Reproductive Adaptation and Evolutionary Ecology and Institute of Biodiversity, Yunnan University, Kunming 650500, Yunnan, China
b Laboratory of Ecology and Evolutionary Biology, State Key Laboratory for Conservation and Utilization of BioResources in Yunnan, Yunnan University,Kunming 650500, Yunnan, China
c College of Forestry, Central South University of Forestry and Technology, Changsha 410004, Hunan, China
d Shanghai Chenshan Botanical Garden, Shanghai 201602, China
e The Morton Arboretum, Lile, IL 60532-1293, USA
Keywords:Species distribution model (SDM)East Asian tropics and subtropics Biodiversity conservation Distribution dynamics Global climate change
ABSTRACT East Asian evergreen broadleaved forests(EBFLs)harbor high species richness,but these ecosystems are severely impacted by global climate change and deforestation.Conserving and managing EBLFs requires understanding dominant tree distribution dynamics.In this study,we used 29 species in Quercus section Cyclobalanopsis-a keystone lineage in East Asian EBLFs-as proxies to predict EBLF distribution dynamics using species distribution models (SDMs).We examined climatic niche overlap,similarity,and equivalency among seven biogeographical regions’ species using ‘ecospat’.We also estimated the effectiveness of protected areas in the predicted range to elucidate priority conservation regions.Our results showed that the climatic niches of most geographical groups differ.The western species under the Indian summer monsoon regime were mainly impacted by temperature factors,whereas precipitation impacted the eastern species under the East Asian summer monsoon regime.Our simulation predicted a northward range expansion of section Cyclobalanopsis between 2081 and 2100,except for the ranges of the three Himalayan species analyzed,which might shrink significantly.The greatest shift of highly suitable areas was predicted for the species in the South Pacific,with a centroid shift of over 300 km.Remarkably,only 7.56% of suitable habitat is currently inside protected areas,and the percentage is predicted to continue declining in the future.To better conserve Asian EBLFs,establishing nature reserves in their northern distribution ranges,and transplanting the populations with predicted decreasing numbers and degraded habitats to their future highly suitable areas,should be high-priority objectives.
1.Introduction
Evergreen broadleaved forests (EBLFs),including typical rain forest,tropical seasonal rain forest,and subtropical EBLFs,are widespread in tropical and subtropical East Asia.They are very important terrestrial ecosystems supporting high levels of both species diversity and ecosystem functioning(Fang and Yoda,1991;Ying,2001;Fang et al.,2002;Song and Da,2016;Ammer,2019).Several woody families,e.g.,Fagaceae,Lauraceae,Magnoliaceae,and Theaceae,dominate EBLFs,supporting unique regional habitats(Song and Da,2016;Ashton and Zhu,2020).According to the Food and Agriculture Organization of the United Nations 2020 report,at least 9.0% of the world's forests are in rare and patchy classes,and their habitats are highly fragmented (Hansen et al.,2013;FAO and UNEP,2020).Subtropical and tropical broad-leaved forests have the highest fragmentation degree among all forest ecosystems (FAO and UNEP,2020).Meanwhile,these broad-leaved forests are severely degraded and increasingly fragmented by agriculture,logging,and mining activities (Huang et al.,2007;Wang et al.,2007;Hansen et al.,2013;FAO and UNEP,2020).The situation for East Asian EBLFs is even more severe(Miettinen et al.,2011;Hansen et al.,2013;Estoque et al.,2019),making these EBLFs highly vulnerable,which merits prioritizing their conservation (Zhang et al.,2012;Anderegg et al.,2022).
During the last three decades,an accumulation of evidence has shown that increased atmospheric concentrations of greenhouse gases linked to human activities have altered the global climate,significantly impacting the distribution of organisms globally(Pachauri et al.,2014).Model simulations have shown that the drastic global climate change in recent decades has driven dry and warm climatic shifts in tropical and subtropical regions(Deb et al.,2018).This scenario may disadvantage the dominant trees in EBLFs because this forest ecosystem is more drought sensitive than other biomes(Huang and Xia,2019).Additionally,the increased effects of wildfires and habitat degradation severely impact the long-term survival of EBLF ecosystems in East Asia (Sodhi et al.,2004).Therefore,conservation and environmental management challenges in the EBLFs of the Asia subtropics are immense.
Monitoring and understanding the distributions of dominant tree species is crucial for forest conservation and management,especially under ongoing rapid global climate change(Hamann and Wang,2006;Serra-Diaz et al.,2018).Species distribution models(SDMs) are based on statistical relationships between known occurrences and environmental variables to predict the potential ranges of species (Elith and Leathwick,2009).These models are powerful tools,as they can be projected to unsurveyed areas or periods to overcome gaps in available species distribution data(Barlow et al.,2021).Thus,these approaches are increasingly applied in conservation efforts to identify priority areas for the establishment of protected areas,to locate suitable places forex situconservation and forest restoration (Lachat and Buetler,2009;Garcia et al.,2014;Valladares et al.,2014),and to predict the distribution of invasive species for conservation management(V′aclavík and Meentemeyer,2009;Wang et al.,2022).
East Asia is a well-established global hotspot of biodiversity and endemism (Hughes,2017).This region has served as an important climate refugium,as the continental ice sheet never developed across this entire region during the Quaternary glaciation;furthermore,the thermal conditions of the region were stable primarily because its complex topography has buffered it from climate extremes during the repeated glaciations(Woodruff,2010;Chen et al.,2017;Qiu et al.,2017;Tang et al.,2018;Ye and Li,2022).According to paleo-biome reconstructions,the subtropical EBLFs in East Asia contracted to a narrow belt south of 24°N during the Last Glacial Maximum (LGM) (Qian and Ricklefs,2000;Harrison et al.,2001;Ni et al.,2010).Nevertheless,many SDM studies on tree species have predicted that under warm and dry climate shifts,the suitable habitat of forest trees would be reduced and move poleward(Parmesan et al.,1999;Parmesan and Yohe,2003;Iverson and McKenzie,2013;Chardon et al.,2015;Silva et al.,2019).In contrast,population genetic studies on trees in East Asia EBLFs have indicated that the habitats of these trees have largely been stable since the Quaternary with limited expansion and contraction (Shi et al.,2014;Xu et al.,2015,2020;Ye et al.,2019;Jiang et al.,2021;Lin et al.,2021;Zheng et al.,2021).There has been an accumulation of SDM studies on trees in East Asian EBLFs (Rodríguez-S′anchez and Arroyo,2008;Xu et al.,2017;Shalisko et al.,2018;Ramírez-Preciado et al.,2019;Ye et al.,2020;Zhang et al.,2020c;Shi et al.,2021;Fan et al.,2022a,2022b;Tang and Zhao,2022;Yang et al.,2022).Nevertheless,according to these SDM results,the taxa inhabiting East Asia EBLFs are predicted to respond differently to climate change in the future.Some species might experience obvious range reductions(Shalisko et al.,2018;Rathore et al.,2019;Tang et al.,2020;Ye et al.,2020;Zhang et al.,2020c;Shi et al.,2021;Fan et al.,2022b;Tang and Zhao,2022),while others might undergo range expansions(Rodríguez-S′anchez and Arroyo,2008;Xu et al.,2017;Bhandari et al.,2020;Fan et al.,2022a;Yang et al.,2022).Collectively,these studies provide important information on conserving and managing EBLFs in East Asia.Nevertheless,the impact of climate change on EBLFs is not yet clear.To better understand how these EBLFs will continue to respond to global climate change,we used species in a model lineage in East Asian EBLFs as proxies to investigate the distribution dynamics of these important ecosystems.This approach can provide deep insights into the possible consequences of climate change to the regional forests to safeguard these unique EBLFs henceforth.
QuercussectionCyclobalanopsis(Orest.) Benth.&Hook.f.,also known as the ring-cupped oaks,is a unique monophyletic evergreen oak lineage comprising 98-120 species (Deng,2007;Denk et al.,2017).These trees are frequently found in different types of EBLFs throughout the East Asia tropics and subtropics,including along the southern slope of the Himalayas(Denk et al.,2017;Deng et al.,2018),and the ranges of several species extend to the western and northern limits of EBLFs in mainland Asia (Soepadmo,1972).The species diversity center of the section is located in Southwest China and northern Indochina and contains about 60 species (Luo and Zhou,2001).These species are among the most economically and ecologically useful trees of the region,providing high quality timber,firewood,tannins and wildlife habitat(Huang et al.,1999)as well as necessities for various ecosystem services and biodiversity conservation (Cavender-Bares et al.,2016,2018).
SectionCyclobalanopsishas a long evolutionary history tracing back to the early Paleogene and can be used as a proxy for warm and humid subtropic climates (Manchester,1994;Luo and Zhou,2001;Barr′on et al.,2017).Compared to the current distribution,the historical distribution of these evergreen lineages was much broader in deep geological time.The earliest fossil records of the section were reported in the Middle Eocene in North America(e.g.,Quercus paleocarpaManchester from the Green River formation,ca.53 Ma;Manchester,1994) and the high elevation area of the Qinghai-Tibet Plateau (e.g.,Quercus tibetensisXu,Su &Zhou from Tibet,ca.43 Ma;Lu et al.,2016),with an acceleration of fossil occurrences from the late Oligocene and rapid diversification since the early Neogene (Barr′on et al.,2017).Previous research on the biogeography and quantification of the species niche of sectionCyclobalanopsisshowed that its distribution was mainly determined by the lowest temperature in the coldest month and annual mean temperature (Yan et al.,2019).However,these oaks in different ecosystems respond differently to climate change;for example,the distribution ranges ofQuercus lamellosaSm.(Guo et al.,2021),Quercus kerriiCraib (Jiang et al.,2018),andQuercus championiiBenth (Jiang et al.,2019).are predicted to shrink significantly in the future under all likely CO2emission scenarios,but a northward and westward range expansion is expected for widespread East Asia EBLF species,e.g.,Quercus glauca(Thunb.)Oerst.(Jiang et al.,2016;Xu et al.,2020;Zhang et al.,2020b).These previous studies indicated the trees in EBLFs in East Asia might respond differently to climate change.Notably,applications of SDMs on these oaks have either focused on a single species or were not fully evaluated.These limitations have complicated our ability to make comparisons over a large geographic scale,which is necessary to understand the climatic diversity that underlies the distribution of this unique oak clade.In addition,there are currently 253,359 terrestrial protected areas worldwide (UN Environment Programme and International Union for the Conservation of Nature,2017),and the effectiveness of these protected areas in protecting ELBFs has been largely overlooked in previous SDM studies (e.g.,in Jiang et al.,2018;Jiang et al.,2019;Guo et al.,2021;Zhang et al.,2022),limiting their application in biodiversity conservation and ecosystem restoration.
Given their wide distribution in the East Asian tropics and subtropics,dominance in forests and species richness,sectionCyclobalanopsisis an excellent system for studying the distribution dynamics of East Asian EBLFs.After the occurrence data filtering process,29 species ofQuercussectionCyclobalanopsis,with enough occurrence points to represent the main Asian EBLF forest ecosystems,were used as proxies to investigate the impacts of climate change on East Asian EBLFs by predicting current and future species distributions.By overlaying protected area data,the conservation effectiveness of established protected areas for these species was also assessed.Our study goals were (1) to reveal the distribution dynamics of these evergreen oaks and their response to global climate change and(2)to identify the conservation priority regions of East Asian EBLFs.Our study thus provides important information for forest restoration and biodiversity management of East Asia EBLFs.
2.Materials and methods
2.1.Occurrence data and environmental factors
In this study,we adopted the oak taxonomical system updated by Denk et al.(2017),in which 89 species ofQuercussectionCyclobalanopsisare recognized.The occurrence data of all the species in sectionCyclobalanopsiswere obtained from the National Plant Specimen Resource Center (NPSRC;https://www.cvh.ac.cn/),Global Biodiversity Information Facility (GBIF;https://www.gbif.org/) (GBIF.org,2021),and our field collection records.Our occurrence data only included coordinates associated with voucher specimens or clear images for validation.For the herbarium specimens without GPS coordinates,we manually checked the detailed collection sites to locate the specific sampling sites and then determined the corresponding GPS coordinates using Google Earth v.2017.Unreliable data points were removed when incorrect georeferencing was observed (e.g.,occurrence data falling in the sea or outside the known distribution range),and data points with clear taxonomic issues (e.g.,misidentifications) were removed.After this quality control process,29 species with more than 35 original occurrence points were used for subsequent analyses.These species are widespread and commonly occur in different types of EBLFs (Table S1).The cleaned occurrence data contained 3227 records,with the number of occurrence points for each species ranging from 37 to 379.The detailed GPS coordinates are summarized in Table S2.Excessive inhomogeneity of occurrence data can lead to biases in SDM simulation results(Boria et al.,2014).Thus,the‘dismo’package(Hijmans et al.,2017)in R v.4.1.0(R Core Team,2021) was used to filter out data points to thin excessively dense occurrence data,so that only one record was randomly retained within each 0.2°grid.The filtered occurrence data,containing 2007 records (Table S3),was used for the subsequent distribution simulation.
Climate data were downloaded from WorldClim (https://www.worldclim.org;19 bioclimatic variables,2.5 arc-min resolution,version 2.1)(Hijmans et al.,2005;Fick and Hijmans,2017).Current bioclimatic variables were generated using minimum temperature,maximum temperature,and precipitation from 1970 to 2000 to map the potential distribution under the present climate.For future projections,the data for 2081-2100 were downscaled from the CMIP6 of the sixth assessment report (AR6) of the Intergovernmental Panel on Climate Change (IPCC) from the EC-Earth3 Earth System Model(EC-Earth3-Veg),the First Institute of Oceanography Earth System Model version 2.0(FIO-ESM-2-0),and the Max Planck Institute Earth System Model (MPI-ESM1-2-HR).The three global climate models were selected based on their recent best performance in GCMEval (Parding et al.,2020),a tool used to select models based on the study area.We used the average model of the three models to predict the potential distribution of species in sectionCyclobalanopsisunder future climatic conditions.In addition,shared socio-economic pathways (SSPs) with medium and high emissions scenarios,SSP245 and SSP585,respectively,were selected to predict the suitable areas for all studied species.
Oak acorns are mainly dispersed by gravity with some rodent-/jay-mediated dispersal also occurring.These acorn dispersal methods are usually restricted to a small regional scale (no more than 1 km) (Gomez,2003;Gomez et al.,2008).Therefore,we restricted the possible range expansion areas of species to within 5°of their distribution boundaries.Based on the occurrence data of all species,the study area was defined as 67°51′26′′E-146°4′1′′E and 13°7′60′′S-43°22′48′′N.
High climate factor correlations can lead to overfitting(Graham,2003).In order to eliminate highly correlated bioclimatic variables and multicollinearity among variables,we used the following procedure to filter the bioclimatic variables ultimately used for simulation.Firstly,we extracted data for 19 bioclimatic variables (Table S3) from filtered occurrence points in sectionCyclobalanopsisto examine the pairwise variable correlations and then discarded highly collinear variables.Secondly,we used the variance-inflation factor(VIF)test(Naimi et al.,2014)to examine if variables were strongly correlated,in order to avoid the familiar problems associated with multicollinearity(Segurado et al.,2006;Dormann et al.,2013).We excluded the less important bioclimatic variable from each pair with the highest pairwise correlation (>|0.8|)using the‘usdm’package in R.In addition,variables with VIF>10 were excluded from the subsequent analyses.For subsequent analyses,we selected the seven variables with the highest inferred contribution to the distribution of sectionCyclobalanopsis: (1)Mean Diurnal Range (Bio_02),(2) Maximum Temperature of Warmest Month (Bio_05),(3) Mean Temperature of Wettest Quarter (Bio_08),(4) Mean Temperature of Driest Quarter(Bio_09),(5)Precipitation Seasonality(Bio_15),(6)Precipitation of Warmest Quarter(Bio_18),and(7)Precipitation of Coldest Quarter(Bio_19).
2.2.Potential distribution area simulation
We used the R package‘sdm’(Naimi and Araújo,2016)to select the best model for ecological niche modeling and simulate the potential distribution area for each species.This package enables the application of 15 models: generalized linear model (GLM),generalized additive model (GAM),classification and regression trees (CART),boosted regression tree (BRT),multivariate adaptive regression spline (MARS),mixture discriminant analysis (MDA),random forests (RF),support vector machine (SVM),artificial neural networks (ANN),environmental niche factor analysis(ENFA),maximum entropy (MaxEnt),Maxlike,Bioclim,Domain,and Mahalanobis.The performance of each of these 14 models(ENFA was excluded,as it is not supported by the latest version[v.1.1-8] of the ‘sdm’ package) was evaluated for each of the 29Cyclobalanopsisspecies analyzed,respectively.For each species,all filtered points were randomly divided into a training data set(70%)and a testing data set (30%).The training data set was used for model calibration,and the testing data set was used for crossvalidation of the model evaluation during the calibration process.One hundred replicates were run for each model with resampling methods for subsampling.The area under the curve (AUC) of the receiver operating characteristic curve(Fielding and Bell,1997)and the true skill statistic (TSS) (Allouche et al.,2006) were used to measure the accuracy of each model.A perfect model would have an AUC approaching 1,and AUC>0.9 indicates high model accuracy(Pearce and Ferrier,2000;Manel et al.,2001).TSS varies from-1 to 1,and excellent model performance is indicated by a TSS of approximately 0.8 or more (Jim′enez-Valverde and Lobo,2007;Barbet-Massin et al.,2012).The model with the best performance was used to simulate the current and future species distribution of each ring-cupped species.In order to better represent the simulation results,the 29 ring-cupped oak species were divided into groups/subgroups according to their geographical distribution(Table 1).

Table 1 Changes in distribution area of Quercus section Cyclonalanopsis in current and future periods and different scenarios.
2.3.Group/subgroup niche comparisons
Niche overlap is the intersection of two niches in a niche space.We used Schoener’sD-metric(Schoener,1970;Warren et al.,2008),which ranges from 0 (no overlap) to 1 (complete overlap),to calculate niche overlap between paired (sub)groups.We utilized the environmental principal component analysis (PCAenv) method to assess equivalency and similarity between the niches of paired(sub)groups.This method estimates the available environmental space defined by the first two axes of the principal component analysis (PCA) by comparing the environmental circumstances available(using the same set of variables as the SDMs)for a species within a specific study extent (background) with its observed occurrences.A smooth kernel density function is used to adjust for sampling bias in this method (Broennimann et al.,2012).
Niche equivalency and niche similarity tests are frequently used to evaluate the niche conservatism or divergence hypothesis(Glennon et al.,2014).The niche equivalency test only assesses whether the two entities’ species (here paired [sub]groups) are identical in their niche space by using their exact locations and without considering the surrounding space,which is also a limitation of this test (Warren et al.,2008;Aguirre-Guti′errez et al.,2015).The niche similarity test determines whether one range's environmental niche is more similar to another range’s niche than predicted by chance and accounts for the surrounding environmental conditions of the geographic space across the study area(Warren et al.,2008).
The ‘ecospat’ package in R was used to conduct niche overlap test analyses,niche equivalency tests,and niche similarity test (Di Cola et al.,2017).
2.4.Distribution dynamics and centroid migration
The ASCII output files for the current and future projections were converted into a raster float file.We calculated suitable climatic ranges for each of the 29 species analyzed for the current conditions using the Zonal Statistics extension with the Spatial Analyst Tools in ArcGIS v.10.8 (https://www.esri.com/) (O'Donnell et al.,2012).The distributional changes between current and future(SSP245 and SSP585)binary SDMs were calculated using the‘SDMtoolbox’ embedded in ArcGIS v.10.8 (https://www.esri.com/).The output is a table indicating areas of range contraction,range expansion,and no change in the species distribution.Then we used the binary SDM file to analyze centroid shift.This analysis summarizes the core distributional shifts of many species' ranges.It reduces each species' distribution to a single central point (a centroid) and creates a vector file depicting its magnitude and direction of change through time.
2.5.Suitable habitat range shifts under future climate change scenarios
To estimate the suitable distribution area and change dynamics in current nature reserves,we performed a grid overlay of the SDM simulation results and current nature reserve area data to reveal the suitable area status for ring-cupped oak species currently within nature reserves and under the two future climatic change scenarios considered (SSP245 and SSP585),respectively.Boundaries of the nature reserves were downloaded from ProtectedPlanet.net (https://www.protectedplanet.net/en/searchareas?geo_type_site=&geo_type=region) (UN Environment Programme and International Union for the Conservation of Nature,2017).The data utilized were limited to the extent of the study area.Data were merged into fully protected area data and projected into the same coordinate system(World Cylindrical Equal Area) and units (km2) as the bioclimatic variables using ‘Data Management Tools’ in ArcGIS v.10.8.Protected areas of marine environments were excluded from the analyses.The percentages of protected areas covered,lost,and gained for each species in different periods were calculated to reveal the effectiveness of current conservation protection areas for species of sectionCyclobalanopsiswithin nature reserves.
3.Results
3.1.Model selection and accuracy evaluation for simulating potential suitable ranges
The model evaluation revealed that RF was the most suitable model for environmental niche prediction of species inQuercussectionCyclobalanopsis,as the AUC and TSS values for the climate modeling of each species was the highest (AUC=0.94 ± 0.03,TSS=0.80 ± 0.07) compared to the other 13 models.Accordingly,the RF model was used in subsequent predictions.The mean AUC and TSS values of the observed data sets for each species using different models are summarized in Table S4.Cross-validation plots of the occurrence points to the predicted suitable habitat for the current period inferred by RF were well matched for these 29 oak species (Fig.S1).
3.2.Contribution of the bioclimatic variables to the distribution of ring-cupped oaks
The bioclimatic variables each had very different contributions to the distribution of the 29 oaks.Among the selected bioclimatic variables,Mean Diurnal Range (Bio_02),Precipitation of Warmest Quarter(Bio_18),and Precipitation of Coldest Quarter(Bio_19)had the greatest impacts on the distributions of the 29 species.The distributions of seven species were most affected by Mean Diurnal Range (Bio_02),with 22.23-37.14% contribution rates;the distributions of six species were most affected by Precipitation of Warmest Quarter (Bio_18),with 22.73-36.34% contribution rates.The distributions of five species were most affected by Precipitation of Coldest Quarter(Bio_19),with 22.95-33.57%contribution rates.
The predicted demographic changes among the 29 oak species differed greatly.To better illustrate our results,we categorized the 29 species into the Core East Asia group (incl.the East China subgroup,Southern China-Indochina subgroup,Southwest China-Himalayas subgroup,Indochina subgroup,and East China-Japan subgroup),the East Asia widespread group,and the Southern Pacific Archipelago group according to their distribution pattern andthe contributions of the bioclimatic variables(Fig.1).The predicted suitable areas for the 29 oak species at the current stage are summarized in Table 1 and depicted in Fig.S2.The detailed contributions of the seven bioclimatic variables to each group/subgroup,and their climate response curve are summarized in Figs.2 and S3,respectively.

Fig.1. Three main patterns of the current potential distribution area in Quercus section Cyclobalanopsis.A-E,Core East Asia(CEA)group with the main distribution area in China and extending to the adjacent area.This group is divided into five subgroups:A.the East China(EC)subgroup,using Q.jenseniana as an example;B.the Southern China-Indochina(SCIndochina)subgroup,using Q.blakei as an example; C.the Southwest China-Himalayas(SWC-Him) subgroup,using Q.augustinii as an example; D. the Indochina subgroup,using Q.helferiana as an example; E. the East China-Japan (EC-J) subgroup,using Q.ciliaris as an example; F. East Asia widespread (EAW) group,using Q.glauca as an example; G.Southern Pacific Archipelago (SPA) group,using Q.argentata as an example.Dark blue indicates non-suitable habitat (NSH),blue indicates low suitable habitat (LSH),yellow indicates moderate suitable habitat (MSH),and red indicates high suitable habitat (HSH).
(1) Core East Asia group
The main distribution area of the Core East Asia group is located in China,extending into adjacent areas.This group contains 22 species,which can be further subdivided into the following five subgroups.(I) The East China subgroup has a core distribution in Central-East China.(II) The Southern China-Indochina subgroup has a core distribution range in southern China,extending into northern Indochina.(III)The Southwest China-Himalayas subgroup has a core distribution in the Yunnan-Guizhou Plateau,extending to the west along the low-elevation valleys in the Himalayas.(IV)The Indochina subgroup has core distribution areas located in northern Indochina (including the Southwest China and the northern Indochina Peninsula).(V)The East China-Japan subgroup stretches from the northern limit of EBLFs in East Asia (i.e.,Central-East China) to southern Japan.The predicted potential suitable area of Southwest China-Himalayas subgroup was the smallest among all groups and subgroups,ranging from 439.13 × 10³km2to 1040.27 × 103km2.
The contribution of bioclimatic variables to the distribution of the species in the Core East Asia group varied.According to the highest climate variable contribution,precipitation-related climate variables mainly explained the predicted distribution of the species in the East China subgroup,except forQuercus stewardiana.The distributions of the Southern China-Indochina and East China-Japan subgroups were affected by the combined effects of humidity and temperature.Temperature-related climatic variables were the key factors restricting the distribution of oaks in the Southwest China-Himalayas subgroup(except forQ.lamellosa)and in the Indochina subgroup (Fig.2).

Fig.2. The contribution of climatic variables on distribution ranges of 29 species in Quercus section Cyclobalanopsis predicted by SDMs.Bio_02: Mean Diurnal Range,Bio_05: Max Temperature of Warmest Month,Bio_08: Mean Temperature of Wettest Quarter,Bio_09: Mean Temperature of Driest Quarter,Bio_15: Precipitation Seasonality,Bio_18: Precipitation of Warmest Quarter,Bio_19: Precipitation of Coldest Quarter.
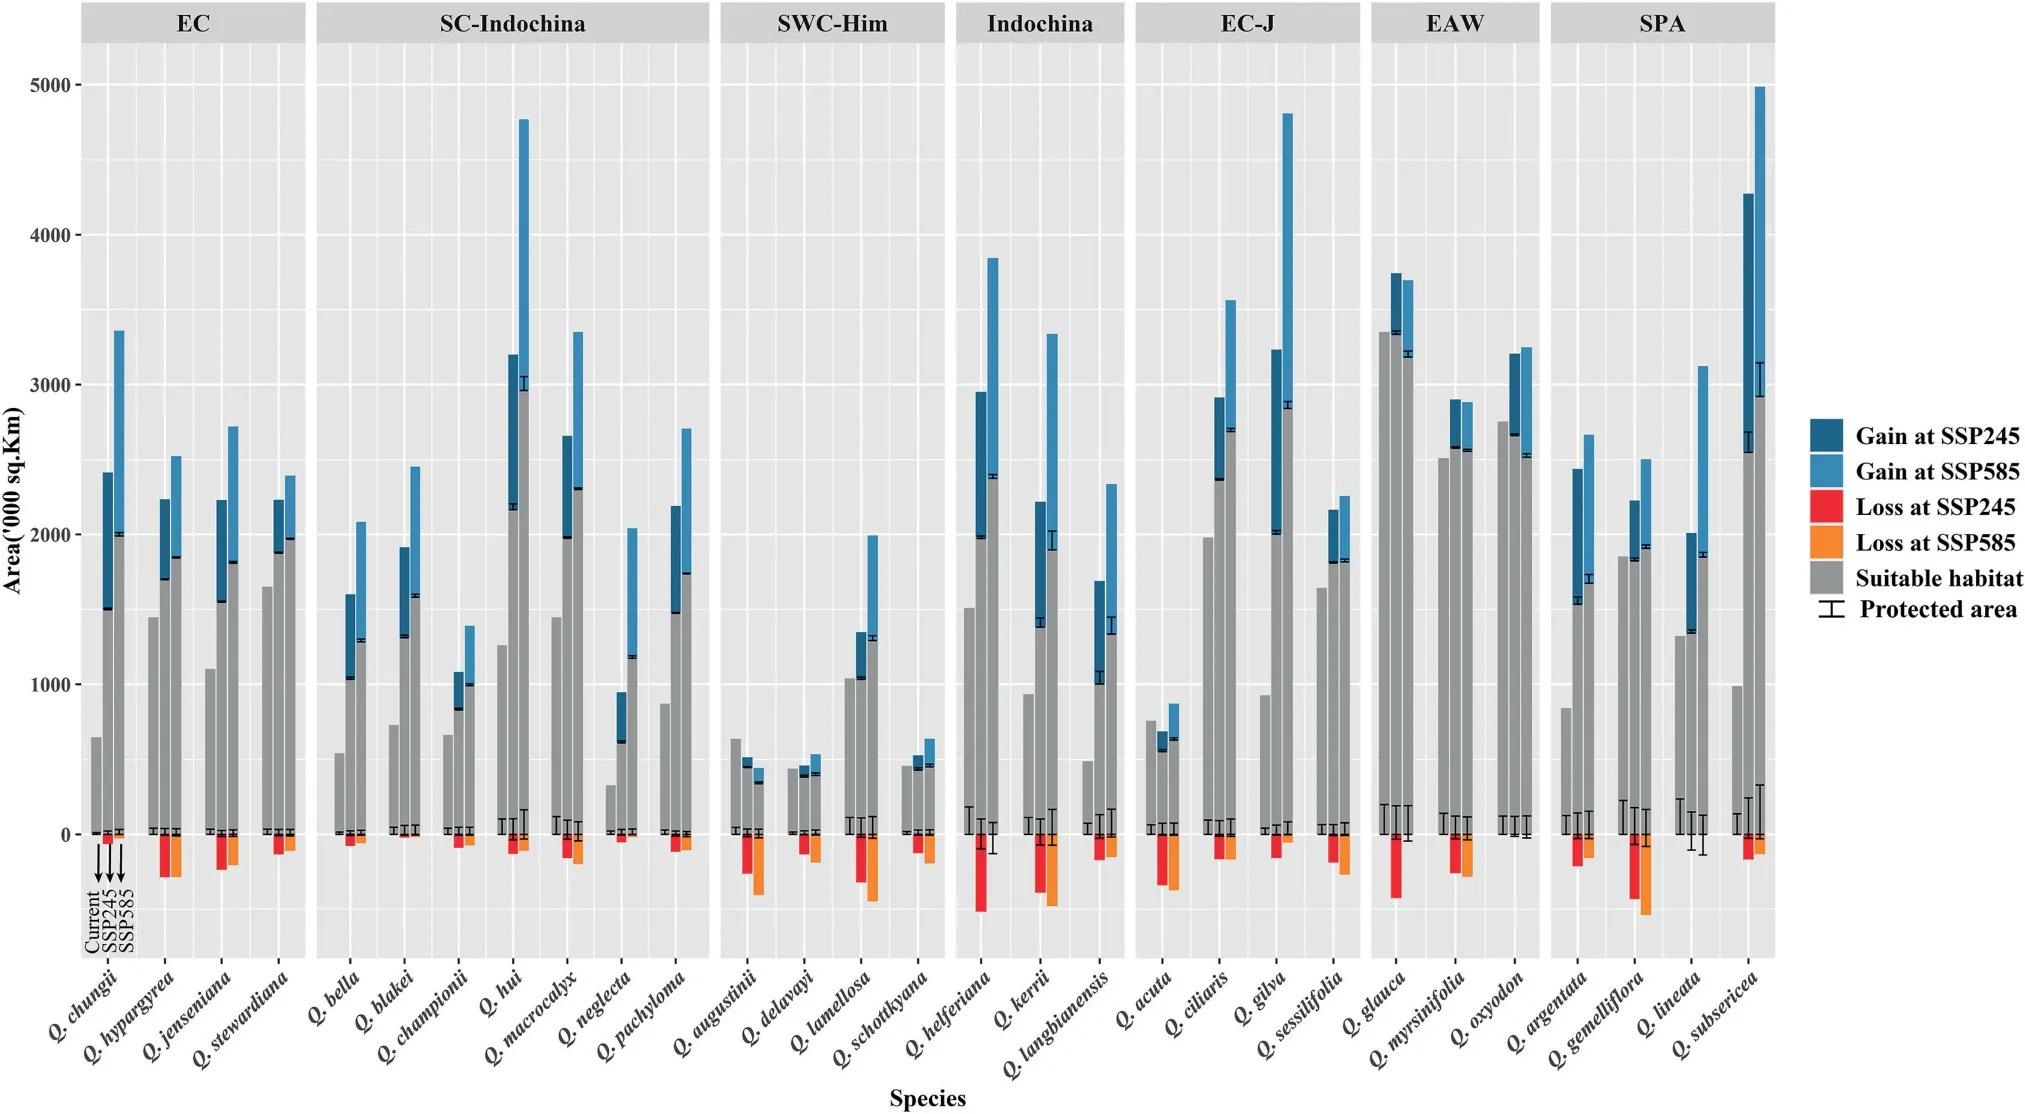
Fig.3. The gain and loss of future suitable habitat of the 29 species in section Cyclobalanopsis under SSP245 and SSP585 scenarios countered with current protected area coverage.For each species,the left bar in grey shows the current suitable habitat,while the middle and right bars show the SSP245 and SSP585 scenarios,respectively.Light and dark blue bars show the gain in species ranges,while light and dark orange bars show the loss in species ranges.The dark line represents protected area coverage.
(2) East Asia widespread group
The East Asia widespread group included three species,Q.glauca, Q.myrsinifolia,andQ.oxyodon,with wide distribution ranges in the East Asian subtropics from South Korea and southcentral Japan to the East Himalayan lowland.The predicted current suitable areas of the three species were the widest among the species in sectionCyclobalanopsis,with each exceeding 2500.00 × 103km2.
In the East Asia widespread group,the distribution ofQ.glaucawas mainly influenced by Precipitation of Driest Month (Bio_14)(contribution rate,39.36%),whereas the distributions ofQ.myrsinifoliaandQ.oxyodonwere affected by Mean Diurnal Range(Bio_02)(contribution rate,22.33%).Overall,the distribution of the East Asia widespread group was mainly influenced by precipitation.
(3) Southern Pacific Archipelago group
The species of the Southern Pacific Archipelago group were mainly distributed in the moist highland montane tropical cloud forests around the equator(the Malay Peninsula,Sumatra,Java,and Kalimantan).Four species fit this distribution pattern:Quercus argentata,Q.gemelliflora,Q.lineata,andQ.subsericea.The predicted suitable areas of the four species ranged from 840.71×10³km2to 1852.03 × 103km2.
The distributions of species in the Southern Pacific Archipelago group were affected by the combined factors of temperature and humidity.The distribution ofQ.argentataandQ.lineatacan be well predicted by Maximum Temperature of Warmest Month (Bio_05),with average contribution rates of 24.94%and 26.06%,respectively.However,the distribution ofQ.gemellifloraandQ.subsericeawere determined to be affected by Precipitation of Coldest Quarter(Bio_19) (contribution rate,22.95%) and Precipitation Seasonality(Bio_15) (contribution rate,19.74%),respectively.
3.3.Climatic niche assessments of groups and subgroups
Niche overlap between(sub)groups was very low in all pairwise comparisons between(sub)groups under the current scenario.The lowest percentages of niche overlap were observed between the Southern Pacific Archipelago group and all the other groups and between the East China subgroup and the west Core East Asia subgroups,at less than 10% each (Fig.S4;Table 2).

Table 2 Niche comparisons and variations in the principal components PC1 and PC2 between the currently projected distribution ranges of pair-wised groups and subgroups in Quercus section Cyclobalanopsis (niche overlap values are presented for the comparison of niche similarity and equivalency).
In our PCAenvresults,the first two principal components(PC1=53.71% and PC2=27.23%) explained 80.94% of the overall climatic variation for the East China and East China-Japan subgroups,the highest of all pairs of groups.Moreover,the first two principal components(PC1=41.25%,PC2=26.81%)explained the lowest percentage of climatic variation for the Indochina and East Asia widespread subgroup pair,at 68.06%.Overall,in the pair-wise comparison for all the groups and subgroups in sectionCyclobalanopsis,PC1 and PC2 explained 49.03% and 22.64% of climatic variation in niche on average,respectively (Fig.S4,Table 2).The PCAenvresults of (sub)group pairs are summarized in Fig.S4 and Table 2.
The occupied niches were significantly non-equivalent between all (sub)group pairs (p>0.05).However,the climatic niches were significantly similar between some (sub)group pairs(paverage=0.03),e.g.,East China and East Asia widespread,South China-Indochina and Indochina,East China-Japan and South China-Indochina,etc.(Fig.S4;Table 2).
3.4.Predicted suitable areas under different future climatic scenarios
The model predicted that under the 2081-2100 SSP245 and SSP585 greenhouse gas emission scenarios,suitable distribution areas would increase by 1.47-157.55% and 1.82-207.06%,respectively,for most of the 29 species.The details of the predicted future suitable areas of the 29 species under the two climate change scenarios in 2081-2100 are summarized in Figs.3 and S5,and Table 1.
In the Core East Asia group,the suitable distribution areas of East China,South China-Indochina,Indochina,and East China-Japan subgroups were predicted to increase under SSP245 and SSP585 scenarios.Specifically,Quercus neglectais predicted to have the greatest increase (258.94%) in the future suitable area among all 29 species under SSP585.In contrast,the future suitable habitat of the Southwest China-Himalayas subgroup (except forQ.lamellosa) would substantially diminish with an average loss of 16.48% and 19.74% of its present range under the SSP245 and SSP585 scenarios,respectively.
For the East Asia widespread group,the future distribution area was predicted to only experience minor losses (with change of -0.46% under SSP245 and -3.46% under SSP585,respectively).Under SSP245 and SSP585,the suitable distribution area ofQ.glaucaandQ.oxyodonis predicted to decrease somewhat (species range changes of 10%),but small increases of 2.64%and 1.82%,respectively,are predicted for that ofQ.myrsinifolia.
The future suitable habitat of the Southern Pacific Archipelago group is predicted to increase by 59.96%and 84.35%under SSP245 and SSP585,respectively.Specifically,Q.subsericeais predicted to have the most significant increase in suitable area(157.55%)in the future among all 29 species under the SSP 245 scenario.
3.5.Centroid shift under the future climatic scenarios
The predicted range shifts under the SSP245 and SSP585 scenarios varied among the 29 oak species.Our results revealed a general northward range expansion of the suitable areas of species of sectionCyclobalanopsis,with a predicted migration distance under SSP245 and SSP585 ranging from 36.02 km to 593.80 km and from 48.44 km to 728.11 km,respectively (Table 3,Fig.4,and Fig.S5).Among the 29 species,Q.stewardianashowed the smallest centroid migration distance(36.02 km and 55.52 km under SSP245 and SSP585,respectively).The centroid shift in the suitable area was greatest forQuercus helferiana,at 583.82 km and 728.11 km under SSP245 and SSP585,respectively.In addition,a southward expansion of the future suitable distribution area is predicted to occur inQ.kerrii(Indochina subgroup),Q.langbianensis(Indochina subgroup),andQ.gemelliflora(Southern Pacific Archipelago group),with migration distances of 57.02 km,116.52 km,and 183.81 km under SSP245.The detailed centroid dynamic changes under the future SSP245 and SSP585 scenarios for each species are summarized in Table 3,Figs.4 and S5.
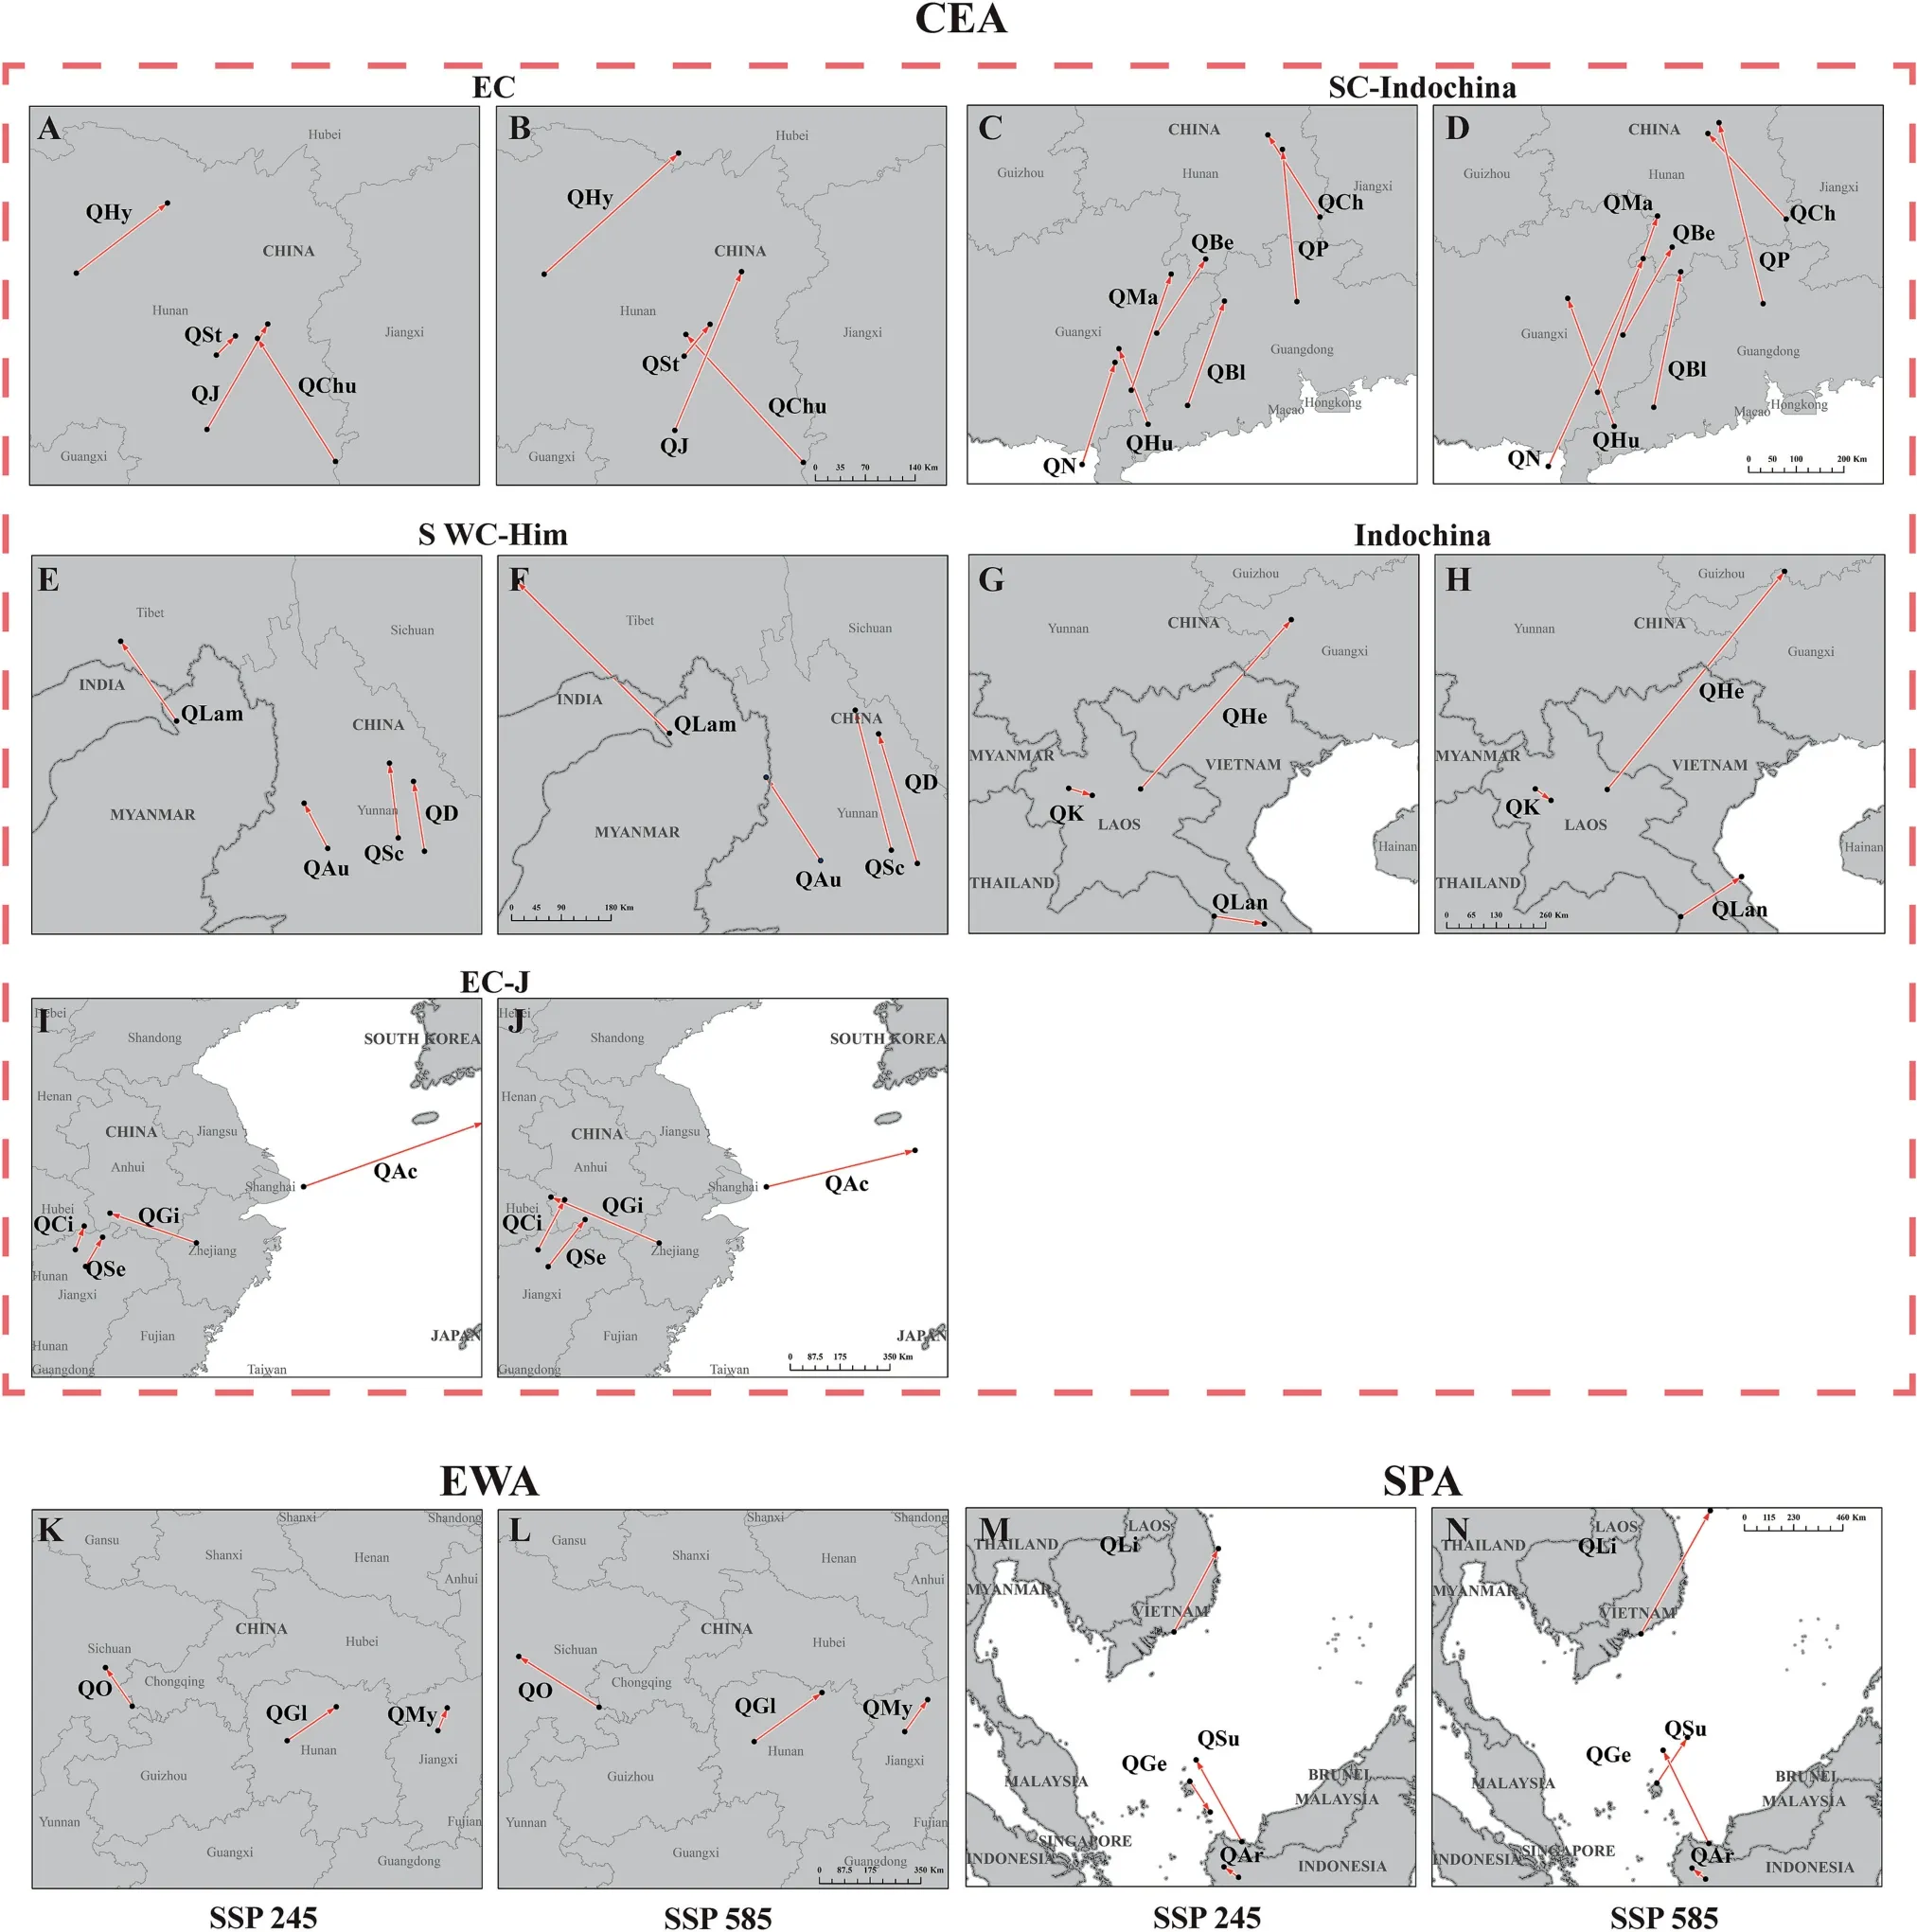
Fig.4. The director and distance variation of centroid migration in different climatic scenarios for the 29 species of Quercus section Cyclobalanopsis.A-J.the species of Core East Asia(CEA) group; K & L.the species of East Asia widespread (EAW) group; M & N. the species of Southern Pacific Archipelago (SPA) group.The dots represent the centroids.Arrows represent the migration direction and distance from the present to the future suitable areas.The species names are abbreviated as follows:QChu:Q.chungii;QHy:Q.hypargyrea;QJ:Q.jenseniana;QSt: Q.stewardiana;QBe: Q.bella;QBl: Q.blakei;QCh: Q.championii;QHu: Q.hui;QMa: Q.macrocalyx;QN: Q.neglecta;QP: Q.pachyloma;QAu: Q.augustinii;QD:Q.delavayi;QLam: Q.lamellosa;QSc: Q.schottkyana;QHe: Q.helferiana;QK: Q.kerrii;QLan: Q.langbianensis;QAc: Q.acuta;QCi: Q.ciliaris;QGi: Q.gilva;QSe: Q.sessilifolia;QGl:Q.glauca;QMy: Q.myrsinifolia;QO: Q.oxyodon;QAr: Q.argentata;QGe: Q.gemelliflora;QLi: Q.lineata;QSu: Q.subsericea.

Table 3 Coordinates,direction and distance variation of centroid migration in different climatic scenarios on the 29 species of Quercus section Cyclobalanopsis.
3.6.Changes in suitable habitats for section Cyclobalanopsis spp.in nature reserves
The grid overlay analyses showed that only about 7.56%,on average,of the currently suitable distribution areas of sectionCyclobalanopsisspecies,are inside currently protected areas.Among all the groups and subgroups,the Southern Pacific Archipelago group had the highest protected area coverage percentage of its suitable distribution area,with an average of 14.64%.The lowest coverage percentage was found for the East China subgroup,with an average of 2.39%.
A decrease in the future suitable distribution area is expected for most of the species (average changes of -1.65% and -1.92% under SSP245 and SSP585,respectively)inside protected areas,except forQuercus acuta, Q.augustini, Q.delavayi, Q.oxyodon,andQ.schottkyana,which showed minor protected range expansions in the future with increases of 0.10-4.71%under SSP245 and 0.49-3.99%under SSP585,respectively.The detailed overlay results are summarized in Fig.3 and Table 4.

Table 4 Changes of suitable areas of the 29 species in Quercus section Cyclonalanopsis at different periods and scenarios in natural reserves.
4.Discussion
4.1.Climatic variables contribute to the distributions of species in section Cyclobalanopsis
Climatic factors greatly impact the geographical distributions of plants,among which hydrothermal conditions play a key role in shaping distribution patterns (Ramírez-Preciado et al.,2019).The climatic factors that determine the distribution range among the oak species in sectionCyclobalanopsisdiffered substantially,corresponding to their various biological characteristics.Precipitation is a key factor controlling plant growth,especially phenology,and the distribution of vegetation in the East Asian subtropical region(ca.20°N to 35N°) (Li et al.,2021).The East Asian summer monsoon (EASM) (also known as the Pacific monsoon),and the Indian summer monsoon (ISM) bring humid climate that areproposed to be critical to the evolution of the flora in East Asia(Wu et al.,2010).The different monsoon systems,characterized by their unique rhythm of wet and dry seasons during each year,cause different environmental conditions,which may drive ecological adaptation of local biota (Liu et al.,2013;Tian et al.,2015;Jiang et al.,2018).The Indochina and Southwest China regions are under the ISM regime,with distinct wet and dry seasons,whereas the EASM regime area is characterized by comparatively even precipitation all year long (Qin et al.,1997;Krishnamurti,2015;Ge et al.,2019).
Our study revealed climatic niche differentiation between the east and the west species in sectionCyclobalanopsisindependent of their phylogenetic relationships (DEC-Indochina=0.08,DEC-SWC-Him=0.05).Correspondingly,the contributions of bioclimatic variables to species distributions under the two monsoon regime areas were quite distinct.For example,the precipitation-related climate variables contributed an average of 48.00% to the distributions of species from the east(East China subgroup),in contrast to only an average of 26.66% to the species from the west (Southwest-Himalayas and Indochina).This phenomenon indicates that species in the west might be better adapted to the seasonal dry climate than those in the east.In other words,precipitation is not the key factor restricting the distribution of oak species in Southwest China-Himalayas and Indochina subgroups;instead,temperaturerelated factors appear to substantially impact their distributions.Likewise,the species with a distribution range under the EASM regime are more sensitive to precipitation-related changes and vulnerable to a seasonal-dry climate.
Regardless of the genetic relationships among species in sectionCyclobalanopsis,species still exhibit a similar climatic niche differentiation corresponding to their east vs.west distribution(Fig.S4;Table 2).Such phenomena suggest that local adaptation to different climatic variables might be a key driver of ecological and evolutionary divergence (Xu et al.,2015;Jiang et al.,2018,2019,2021).For example,Q.championii,Q.delavayi,Q.helferiana,Q.kerrii,andQ.gilvaare clustered in the same clade-the compound trichome base clade(CTB)(Deng et al.,2018).However,the key climatic variables contributing to the distribution of these species differed.The most significant ecological divergence of the species was found between the west and the east sides of the Tanaka Line,an important phytogeographic boundary in Southwest China(Li and Li,1992;Fan et al.,2013;Tian et al.,2015).Its biogeographic significance to regional flora is known as the boundary between ISM and EASM,which is also used to separate the Sino-Himalayan flora from the Sino-Japanese flora (Li and Li,1997;Zhu and Yan,2002,2003).In our study,Q.championiiandQ.gilvato the east of the Tanaka Line were mainly affected by precipitation-related variables: Precipitation of Warmest Quarter (Bio_18) (contribution rate,28.49%) and Precipitation Seasonality (Bio_15) (contribution rate,20.32%),respectively.In contrast,the distribution areas ofQ.delavayi,Q.helferiana,andQ.kerriiare largely located to the west of the Tanaka Line.They were mainly affected by temperature-related climate variables,i.e.,Mean Diurnal Range (Bio_02),Mean Temperature of Driest Quarter (Bio_09),and Mean Temperature of Driest Quarter (Bio_09),with contribution rates of 32.71%,40.63%,and 26.33%,respectively.Recent phylogeographic studies on dominant trees in EBLFs,e.g.,Q.glauca(Xu et al.,2015),Castanopsis fargesiiFranch.(Sun et al.,2014),Q.kerrii(Jiang et al.,2018),Castanopsis sclerophylla(Lindl.&Paxton)Schottky(Chen et al.,2022b),andLindera aggregata(Sims) Kosterm (Ye et al.,2019),have revealed a similar pattern to this east vs.west population niche divergence pattern in East Asia,suggesting adaptation to different monsoon climates indeed increased the genetic divergence of these fagaceous species in East Asia EBLFs.
Generally,lowland trees are more sensitive to temperature and precipitation (Amissah et al.,2014).Tropical and subtropical montane cloud forests,occurring in narrow altitudinal bands at 800-3500 m,are unique ecosystems with persistent cloud cover fog surrounding the vegetation (Bruijnzeel et al.,2011).In such a habitat,humidity is not a limiting factor.Instead,temperatureassociated factors,e.g.,Mean Diurnal Range (Bio_02),Max Temperature of Warmest Month (Bio_05),and Mean Temperature of Driest Quarter (Bio_09),contributed more to the distribution of oaks in the tropics at intermediate elevations,e.g.,Quercus hui(Bio_09,22.83%),Quercus macrocalyx(Bio_02,24.52%) andQ.neglecta(Bio_02,31.91%),as well as the species distributions in the montane cloud forests around the equatorial tropics of Southeast Asia,e.g.,Q.argentata(Bio_05,25.82%)andQ.lineata(Bio_05,24.06%).Thus,the species with restricted distributions at intermediate elevations (i.e.,montane cloud forests and among the South Pacific Archipelago at intermediate elevations) were mainly affected by temperature factors,as precipitation is no longer a limiting factor in such unique habitats.
Recent SDM studies on Chinese oaks have provided deep insights into the distribution dynamics of East Asian temperate forests(Sun et al.,2020;Liao et al.,2021;Sancho-Knapik et al.,2021).The SDM studies on oaks from sectionsQuercus, Cerris,andIlexshowed that Annual precipitation (Bio_12) and Temperatureseasonality (Bio_04) played important roles in their current distribution in Central to East China (Sun et al.,2020),which is consistent with the pattern of the East China subgroup in this study.In contrast,the distribution of seven high mountain sclerophyllous oaks(QuercussectionIlexHeterobalanus group)were shown to be mainly affected by Temperature seasonality (Bio_04) (Liao et al.,2021),which is associated with adaption to alpine environments.Functional leaf trait analyses also showed that oaks in sectionIlexhave a series of traits that are adaptive to semi-arid climates,indicating pre-adaptation to climates with seasonal drought might have already existed in the ancestral lineage(Sancho-Knapik et al.,2021).Therefore,the sclerophyllous oaks in sectionIlexmight be less sensitive to changes in precipitation.
The variation in hydrothermal factors along latitudinal gradients and within the unique climate of tropical oceanic islands (Feulner et al.,2013;Weigelt et al.,2013;Fensholt et al.,2015;Zurbenko and Luo,2015) has differentiated the niches of Southern Pacific Archipelago group species from those of the continental species(average DSPA-other[sub]groups=0.02,Fig.S4,Table 2).Temperature,rather than humidity,is the main factor determining the distribution of Southern Pacific Archipelago group species surrounded by the sea.The cumulative effect of temperature on the distribution of Southern Pacific Archipelago species(60.70%)was higher than that of continental species (44.72%).In addition,although the species core distribution areas of the Southwest China-Himalayas subgroup are located in the Himalayas and Hengduan Mountains,Precipitation of Warmest Quarter(Bio_18)mainly affects the distribution ofQ.lamellosa,while temperature-related climate variables mainly explain the distribution ofQuercus augustinii(Bio_05),Q.delavayi(Bio_02),andQ.schottkyana(Bio_02),which is probably associated with geographical barriers.Unfortunately,the occurrence points of those species were insufficiently dense to cover the main phylogeographic barriers (e.g.,Hengduan Mountains,Mekong-Salween Divide,Tsangpo-Brahmaputra Grand Canyon) in the SW China and Himalayan regions.Therefore,we could not estimate the difference in effects on range distributions between these climatic variables across these phylogeographic barriers.Meanwhile,current county-level plant diversity survey data can only confirm that a species is indeed present in a specific area,but is unlikely to confidently confirm its absence.In this situation,we were also unable to apply occupancy models that use observed presenceabsence data (Gormley et al.,2011) to find the key climatic variables at a fine scale restricting the species distribution.
4.2.The distribution dynamics and climatic niches of EBLFs in the East Asian subtropics
Under future climate models,East Asia is predicted to experience an increase in average temperatures,lethal heat waves,and extreme precipitation events (Hulme et al.,1994;Oh et al.,2014;Chen et al.,2022a).Additionally,the distributions of forests are expected to shift northward and upward(Cheuk and Fischer,2021).Quite a few studies have shown that the suitable habitats for many EBLF species would expand as part of a trend of northward migration under global climate change (Shalisko et al.,2018;Ye et al.,2020;Huang et al.,2022;Yang et al.,2022).For example,the suitable habitats of many EBLF species are predicted to expand,and their northern range expansion is thus expected.Simulations ofCastanopsis(D.Don)Spach species in East Asia indicated a general trend of northward range expansion in the future (Cheuk and Fischer,2021;Tang et al.,2022).Our study predicted a similar trend for sectionCyclobalanopsis.Notably,although our prediction indicated that many species could experience a significant range expansion,e.g.,the South China-Indochina subgroup and the Southern Pacific Archipelago group,other biological traits might restrict their possible dispersal and consequent range.For example,the predicted suitable area ofQ.lamellosawould expand prominently with gains of 24.22% under the future SSP585 climate scenario.However,the distribution ofQ.lamellosais restricted within the Himalayan lowland ravines at elevations of 2000-2800 m(Huang et al.,1999).Such habitats are highly fragmented by geographic barriers and significantly impacted by human disturbance.Meanwhile,the acorns ofQ.lamellosaare huge (diameter>5 cm) (Deng,2007) with consequently poor dispersal abilities(Bonner,1996;Tweddle et al.,2003).Therefore,the natural range expansion of this oak species within the Himalayas and adjacent areas is unlikely.Indeed,SDMs have been widely applied to predict species distributions and to understand attributes of species’environmental requirements.However,for conservation objectives,geographic barriers and dispersal-related biological traits should also be considered.
Although some studies on EBLF tree species have inferred a general northward expansion trend for the future,their habitats might be severely degraded and destroyed in the meantime.The predicted suitable habitats ofSassafras tzumuHemsl.(Lauraceae)(Zhang et al.,2020a) and various Theaceae species (Zhang et al.,2020c) might be lost and/or shifted to the north or northwest,as may also occur forMagnolia mercedesiarumD.A.Neill,A.V′azquez&F.Arroyo(Magnoliaceae)(Shalisko et al.,2018).A similar northward range expansion was predicted for the Southwest China-Himalayas subgroup.Most species of Southwest China-Himalayas subgroup are located in the ISM region and are predicted to be sensitive to temperature variables.As extremely warm and wet climate events might occur quite frequently under future climate scenarios(Hulme et al.,1994;Oh et al.,2014;Chen et al.,2022a),the future distribution range of these oaks could expand northward.However,the complex topography of the Himalayas(e.g.,high mountains and deep river gorges) might restrict their natural range expansion.Therefore,the habitats of the Southwest China-Himalayas subgroup might still be reduced dramatically in the future.
4.3.Management of evergreen oak forests in the East Asian tropics and subtropics
East Asia has experienced strikingly high biodiversity loss owing to its high levels of deforestation and human activity (Wyler and Sheikh,2008;Hughes,2017;Savini et al.,2021).In the past 20 years,the forest coverage across all of East Asia has decreased by 39.1 M ha(Global Forest Watch,2022).Especially in Southeast Asia,deforestation has been more extensive than in the past (Global Forest Watch,2022).However,the threats to EBLFs in East Asia might be more severe than expected,as only 7.56% of the suitable habitat for EBLFs is currently within protected areas based on our study.
A large number of EBLF habitats are highly fragmented by intensified land use(Lu et al.,2016).Therefore,enlarging protected areas with well-preserved primary forests in highly suitable areas is a high priority for in situ conservation of these unique EBLFs in East Asia.These areas are mainly located in southern China (including Guangdong,Guangxi,Fujian,Sichuan,Zhejiang,Guizhou,and Yunnan Provinces in China),southern Japan(Shikoku,Kyushu,and Honshu in Japan),northern Indochina (northern Vietnam and central-northern Thailand),and southern Borneo.
Our predictions indicated a general northward range expansion of the mainland of the East Asian subtropical oaks.However,oak seeds are typically recalcitrant(Connor and Sowa,2003;Jo¨et et al.,2013) with limited dispersal ability (Connor and Sowa,2003;Scofield et al.,2011;Jo¨et et al.,2013;Ramos-Palacios et al.,2014).In addition,our study revealed that a few species’current and future suitable distribution areas might be adjacent or partly overlapping,e.g.,Quercus chungii,Q.hui,Q.pachyloma,andQ.helferiana(Fig.S5).In such a situation,it is essential to establish migration corridors to allow these trees to disperse their seeds naturally to suitable habitats henceforth.
Our analysis also predicted a prominent future range shift for some oak species.For example,the suitable habitat ofQuercus bellashowed a distribution shift from southern China toward east-central China.Notably,there are substantial geographic barriers(e.g.,urban areas and farmlands)between current and future suitable distribution areas.Thus,it is almost impossible for these species to expand past these geographic barriers to reach future highly suitable areas by natural means.Similarly,other species in SW China are also likely to face increased risk of regional extirpation (e.g.,Q.augustini,Q.delavayi,andQ.schottkyana) as their habitats in the East Himalayas might still be severely reduced in the future.Even though they might gain small suitable distribution areas in the northern Yunnan-Guizhou Plateau region,the prominent geographical barriers(mountains and valleys) of the northern Yunnan-Guizhou Plateau almost completely prevent such natural dispersal.In such situations,ex situconservation involving the collection and transplantation of germplasm of these species into suitable areas is essential to ensure the long-term survival of these species in this region in order to safeguard these important forestry germplasm resources.
Conservation biology not only includes the conservation of habitats,species richness,and specific species,but more importantly,it should promote evolutionary potential and evolutionary processes at all levels of biodiversity (Olivieri et al.,2016).The environment is a strong driver of the genetic structure of many natural populations and local adaptation(Razgour et al.,2019).Our previous studies on the population genetics ofQ.delavayi(Xu et al.,2020)andQ.kerrii(Jiang et al.,2018)revealed that the populations east and west of the Tanaka Line were very differently adapted to climatic variables.Although the overall area of the current and predicted distributions of the two species still largely overlap,the southern Yunnan-Guizhou Plateau populations are expected to shrink dramatically in the future(Fig.S5).In such a situation,both in situ and ex situ conservation strategies for populations to both the east and the west of the Tanaka Line should be implemented.Future investigations that couple landscape genomics,SDM,and hyper-spectral remote sensing retrieval can provide comprehensive methods to enhance predictive power and enable real-time monitoring of forest health.These technologies offer robust methods for the management and protection of future forest biodiversity in East Asian biodiversity hotspots.
5.Conclusions
Distribution simulations of 29 oaks species ofQuercussectionCyclobalanopsisin the East Asian subtropics-tropics revealed a general trend of future northward range expansion of these important forest trees.The different climatic variables of the East Asian summer monsoon and the Indian summer monsoon regime areas appear to have driven climate niche divergence between the eastern and western species.Southwest China-Indochina,with high environmental heterogeneity,was the ancestral distribution area and species diversity center of sectionCyclobalanopsisand thus deserves prioritized conservation efforts.However,only 7.56%of the currently suitable habitat of East Asian EBLFs is currently inside protected areas,with corresponding percentages of only 5.91% and 5.63% predicted in 2080-2100 under the SSP245 and SSP585 scenarios,respectively.Therefore,enlarging protected areas of primary forests within highly suitable areas in southern China,southern Japan,northern Indochina,and southern Borneo is a high priority.Forest restoration in the northern distribution range would efficiently facilitate the natural range expansion of these EBLF oak species.Meanwhile,transplantation of germplasm to future predicted highly suitable areas otherwise unavailable to natural range expansion owing to prominent geographic barriers is important for the long-term survival of EBLF species.Further research coupling high-resolution remote sensing,multispectral technology,and SDM could be used to monitor forest dynamics and health in realtime and provide more accurate predictions of vegetation dynamics across different time scales for effective forest management and conservation in East Asian EBLFs.
Author contribution
MD and LL planned and designed the research.KQ-G and LL collected the data,LL analyzed the data,made the distribution map and wrote the manuscript,MD,LL XL-J and AB revised the manuscript.
Declaration of competing interest
The authors declare that they have no known competing financial interests or personal relationships that could have appeared to influence the work reported in this paper.
Acknowledgments
We are thankful to Asian Elephant Yunnan Field Scientific Observation and Research Station,Yunnan Asian Elephant Field Scientific Observation and Research Station of the Ministry of Education,and Baima Snow Mountain Complex Ecosystem Vertical Transect Field Observation and Research Station for their help on the field work.This work was supposed by the National Scientific Foundation of China (NSFC) (Grants nos.31972858,31700174),Yunnan Key Laboratory for Integrative Conservation of Plant Species with Extremely Small Populations (Grant No.PSESP2021),the Southeast Asia Biodiversity Research Institute,Chinese Academy of Sciences (Grant No.Y4ZK111B01) and the project of the Yunnan Academy of Forestry and Grassland (Grant No.KFJJ21-05).
Appendix A.Supplementary data
Supplementary data to this article can be found online at https://doi.org/10.1016/j.pld.2023.03.014.
- 植物多样性的其它文章
- Is intraspecific trait differentiation in Parthenium hysterophorus a consequence of hereditary factors and/or phenotypic plasticity?
- Convergent relationships between flower economics and hydraulic traits across aquatic and terrestrial herbaceous plants
- Integrative analysis of the metabolome and transcriptome reveals the potential mechanism of fruit flavor formation in wild hawthorn(Crataegus chungtienensis)
- Evidence of the oldest extant vascular plant (horsetails)from the Indian Cenozoic
- Resolving a nearly 90-year-old enigma: The rare Fagus chienii is conspecific with F.hayatae based on molecular and morphological evidence
- Drivers of the differentiation between broad-leaved trees and shrubs in the shift from evergreen to deciduous leaf habit in forests of eastern Asian subtropics