
Impacts of canopy structure on the sub-canopy solar radiation under a deciduous forest based on fisheye photographs
2023-11-02 12:02:02YanLinZhangXiaoLinFengXiaoLiChangLiMinTie
YanLin Zhang,XiaoLin Feng,XiaoLi Chang,LiMin Tie
School of Earth Sciences and Spatial Information Engineering,Hunan University of Science and Technology,Xiangtan,Hunan 411201,China
Keywords: Solar radiation Forest structure Fisheye photograph Sub-canopy Deciduous forest
ABSTRACT Forest canopy in a deciduous forest has significant sheltering effects on the sub-canopy solar radiation,significantly influencing the energy balance of snow and permafrost beneath the forest and their spatial distribution.This study employs a digital camera mounted with a fisheye lens to acquire photographs at various times in a growth cycle of the forest canopy at three selected sites in a deciduous forest near the Greater Khingan Mountains Forest Ecological Station,Northeast China.The vegetation types and conditions at the selected sites include P1 in Ledum-Claopodium-L.dahurica,P2 in Carex tato-L.dahurica,and P3 in Betula fruticosa-L.dahurica.After necessary image processing,these photographs were used to identify the canopy structure and its impacts on the sub-canopy solar radiation.Results show that fisheye photographs can successfully capture the forest canopy structure and are useful in estimating the sub-canopy solar radiation.The order of sheltering effects from the largest to the smallest on sub-canopy solar radiation at three selected sites is P3,P1,and P2,highly depending on the canopy density.Then sub-canopy solar radiation was calculated using fisheye photographs and an algorithm validated by in-situ observed solar radiation beneath the canopy at P1 and P3.The results are reasonable,although the accuracy seems compromised due to the mismatch of conditions for calculation and observation.Results also show that the mean annual solar radiation above the canopy was about 148.3 W/m2 in 2018,and the mean annual solar radiation values beneath the canopy were about 90.0,123.8,and 61.0 W/m2 at P1,P2,and P3,with only 60%,84%,and 42% of the total solar radiation penetrating through the canopy,respectively.Even in winter,when the trees are leafless,the canopy sheltering effects cannot be ignored in dense forests.Despite the limitations,fisheye photographs and related algorithms are useful in investigating the forest canopy structure and its impacts on sub-canopy solar radiation.
1.Introduction
Permafrost and snow significantly influence the ecosystems,hydrological processes,and carbon cycling in cold regions(Zimov et al.,2006;Tarnocai et al.,2009;Zhang et al.,2013).Although their spatial distribution on the global scale is mainly determined by climatic conditions(e.g.,net solar radiation and air temperature)related to the latitude,local conditions,e.g.,terrain (including elevation,aspect,and slope angle),moisture content,and vegetation,are also important controlling or even dominating factors at a local scale(Cheng,2004).At northern latitudes,the boreal forest casts considerable influences on snow and permafrost thermal state beneath the forest canopy through various paths (Ohta et al.,1999;Koivusalo and Kokkonen,2002).For example,the forest canopy(i.e.,the spatial configuration of tree boles,branches,leaves,and gaps) regulates the snow accumulation and sublimation and ground temperature beneath the forest canopy by controlling the solar radiation arriving on snow or ground surface(Pomeroy and Dion 1996;Hedstrom and Pomeroy 1998;Hardy et al.,2004;Ellis and Pomeroy 2007;Shur and Jorgenson 2007;Essery et al.,2008;Pomeroy et al.,2009).Accurately estimating the sub-canopy solar radiation beneath the forest canopy is vital for understanding and modelling the dynamics of snow and ground temperatures in boreal forest areas.
Being partially reflected and absorbed by forest canopy elements(e.g.,branches and leaves),the solar radiation arriving on the ground or snow surface beneath the canopy is much attenuated(Price,1988;Hardy et al.,1997;Link and Marks,1999),in terms of duration and intensity,especially after going through a thick forest canopy.As incoming solar radiation is a major component of energy influx for the land surface system,the radiative transfer is an imperative process that should be described in most land surface models (LSMs) (Dickinson,1983;Li et al.,1995).However,for simplicity,some Beer-Lambert-Law-based approaches are often used to estimate the proportion(or transmittance)of solar radiation going through the forest canopy,assuming that the forest canopy is a homogeneous medium (Wigmosta et al.,1994;Link and Marks,1999;Nijssen and Lettenmaier,1999;Hellstr¨om,2000),as follows,
where α is the forest canopy closure;I0and I are the incoming solar radiation above and below the canopy,and k is the bulk canopy optical thickness,which depends on the leaf area index(LAI)and other variables(canopy structure,solar zenith,and azimuth angles).There are various approaches to prescribing the coefficient k.
Assuming an exponential attenuation for the solar radiation going through a homogeneous medium,the Beer-Lambert-Law is shown to be adequate in estimating the average sub-canopy irradiance over long periods (Larsen and Kershaw,1996;Isabelle et al.,2018).However,Rowlands et al.(2002)found that there was significant temporal and spatial variability in the sub-canopy irradiance beneath both discontinuous and uniform canopies for short time intervals,and they resulted in remarkable heterogeneity in sub-canopy snowmelt and ground surface temperature.The Beer-Lambert-Law's variants failed to describe such variability in the sub-canopy irradiance at sub-daily time scales,largely due to the discontinuous and non-uniform distribution of canopy elements and gaps (Musselman et al.,2012,2015).The solar radiation transferring through a realistic forest canopy is very complex because of the heterogeneous arrangement of the canopy structure.Generally,distinct forest types differ much in canopy structures.Even within the same forest type,the canopy structure would also vary with time and hence influences solar radiation interception and transmittance (Rago et al.,2021).For this reason,a complex geometric-optical radiative--transfer(GORT)model was developed by(Li et al.,1995)to consider the three-dimensional geometry or structure of a forest canopy and multiple scattering effects within and between tree crowns.Although the GORT model has been proven to be effective and successful in predicting solar radiation transfer through randomly distributed canopies (Hardy et al.,1997,2004;Ni et al.,1997),a three-dimensional canopy structure required by the model is difficult and expensive to be obtained in the field at that time,even now.
Recently,the technique of fisheye (or hemispherical) canopy photography has received much attention.It is frequently used to obtain the canopy structure and investigate the temporal and spatial variability in sub-canopy solar radiation because it is more practical and less expensive(Welles and Cohen,1996;Gendron et al.,1998;Jennings et al.,1999;Promis et al.,2009;Zhao and He,2016;Dev et al.,2019).This technique observes the forest canopy structure using upward-looking photographs shot by an extremely wide-angle fisheye lens (Rich,1990;Rich et al.,1993;Gendron et al.,1998).Based on these photographs,the spatial distribution of canopy gaps can be measured precisely and straightforwardly (Whitford et al.,1995;Lin and Chiang 2002),which can be used to estimate the potential solar radiation penetrating through the forest canopy in combination with a superposed solar position track on the fisheye photographs (Rich,1990;Chen et al.,1991;Hellstr¨om,2000).For example,Musselman et al.(2012,2015) discovered that the sub-canopy solar radiation estimated with the help of fisheye photographs is more accurate than that estimated based on a Beer-Lambert-Law based model in a typical northern evergreen coniferous forest.A better prediction of snowmelt was also achieved.
Until now,most previous studies estimating the sub-canopy solar radiation in northern forests with the help of fisheye photographs were conducted in evergreen coniferous forests(Reid et al.,2014).Because the canopy structure of the evergreen coniferous forest is presumed semi-permanent in all seasons of a year,just shooting one photograph can almost satisfy the calculation for all seasons in a year.However,the situation is more complicated in northern deciduous forests.The canopy structure varies with phenology annually,which would significantly influence the sub-canopy solar radiation.To estimate the seasonal variation of solar radiation beneath a deciduous forest canopy,several fisheye photographs for different growing phases should be acquired and matched,which would increase the complexity and difficulty of this approach.However,studies alike are rarely reported yet.In this study,upward-looking fisheye photographs for different growing phases were shot at three spots with different canopy densities and structures in or near the larch forest near the Greater Khingan Mountains National Forest Ecological Station.Then the solar radiation arriving beneath the canopy was estimated based on these fisheye photographs,and evaluated against in-situ observations,to examine the impacts of the canopy structure of deciduous forest on the sub-canopy solar radiation.
2.Study area and methods
2.1.Study area
The study area,on the western flank of the Greater Khingan Mountains,in the administrative division of Genhe,Inner Mongolia,is near the Greater Khingan Mountains Forest Ecological Station(GKMFES in Fig.1,50°49′N-50°51′N,121°30′E-121°31′E),a station of the highest latitude among the Chinese Forest Ecosystem Research Network(CFERN).It has a typical cold temperate humid climate,with long winters and short summers.The study area is on the southern margins of Eurasia permafrost.With a mean annual air temperature of about -5.3°C and an extreme air temperature of-58°C,the area nearby is called the cold pole of China,with an average annual frost-free period of only 90 days.Generally,a stable snow cover occurs from the end of October and lasts until the end of April next year,with an average snow depth of about 20-40 cm.
The landscape in the study area is dominated by cold temperate coniferous forest,mainly consisting of larch mixed with a small amount of birch.Ledum-Claopodium-L.dahurica,Carex tato-L.dahurica,and Betula fruticosa-L.dahurica are three principal forest types,as identified in the three selected observing sites(i.e.,P1,P2,and P3)in Fig.1.At P1(in Ledum-Claopodium-L.dahurica),the vegetation coverage is greater than 70%,and the forest is dominated by larch(the tree heights ranging from 15 to 18 m),with a bushy understory of Ledum palustre.At P2(in Carex tato-L.dahurica),the vegetation mainly comprises Carex tato,with a few of Betula platyphylla,Salix matsudana,and Spiraea japonica scattering in groups around.The forest in P3 (in Betula fruticosa-L.dahurica) is mainly composed of larch,Betula platyphylla,and Larix gmelinii,with the tree height reaching to 10-20 m and the coverage of shrubs reaching 85%(Chang et al.,2011).
2.2.Data acquisition
In the study area,the forest canopy is almost leafless from mid-October to the next mid-May,with bare branches remaining.Leaves grow gradually from May to the end of July and then fall starting from August.To capture seasonal changes in canopy structure,several upward-looking fisheye photographs were shot at P1,P2,and P3 beneath the canopy at different growing phases by using a Nikon D700 digital camera (Nikon Corporation,Japan) with a Sigma 8 mm F3.5 EX DG Circular Fisheye Lens(Sigma Corporation,Japan).The shooting time was determined by the canopy states(i.e.,the growing state of branches and leaves),reflecting the phonology or growing phases.Photographs were shot at P1,P2,and P3 on seven dates,i.e.,May 11,May 26,June 16,August 1,August 26,September 24,and October 26 in 2018.Before using the fisheye photographs to calculate the sub-canopy solar radiation,a huge challenge was to match the photos shot at different times;that is,the canopy structure photographed at different times should be well superposed together.To resolve this challenge,the shooting positions were fixed by three PVC(polyvinyl chloride)tubes buried in the ground in advance.At each shooting time,the camera was mounted on a tripod with each leg fixed in a PVC tub to fix the camera position at about 1.0 m above the ground.In addition,an air-bubble level and a compass were used to ensure that the camera was strictly horizontally positioned and the camera was oriented to the north at each shooting time.Then,the photographs shot at each site and at different times were matched and clipped with the help of a spatial referencing tool,i.e.,ArcGIS.Although some matching errors were unavoidable,the photographs taken from different times were superposed well together.The software Gap Light Analyzer Version 2.0 (Frazer et al.,1999) was used to register the matched pictures(defining aspect and zenith angles for each picture for the convenience of superposition with sun tracks) and reclassify them into binary images.As shown in Fig.2,the pixels in the binary images were identified into canopy elements(black)and gaps(white).
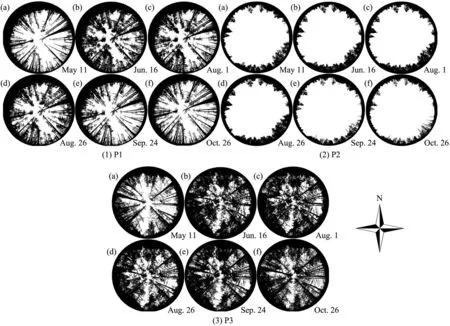
Fig.2. Registered and matched binary fisheye photographs at P1 (in Ledum-Claopodium-L.dahurica),P2 (in Carex tato-L.dahurica),and P3 (in Betula fruticosa-L.dahurica),with the shooting dates given at the bottom right of each fisheye photograph.
To observe the sub-canopy solar radiation,two solar radiation observing meters were installed beneath the forest canopy at the shooting positions of P1 and P3,about 20 cm above the ground surface.Notably,solar radiation was not observed at P2 because of the obstruction from the canopy structure.In addition,solar radiation above the forest canopy observed by a solarimeter installed on a tower,45 m above the ground,in 2018 was collected,which was used to calculate the sub-canopy solar radiation.
2.3.Algorithms for estimating the sub-canopy solar radiation
Although the fisheye photography system is much more complex in reality(Schleppi and Paquette 2017),the schematic diagram for optical imaging illustrated in Fig.3 helps to understand the method used in this study.In Fig.3a,suppose that an upward-looking camera lens is horizontally fixed at O,and the right panel in Fig.3 is an obtained fisheye photograph,which is also presented in the image plane as a light blue circle in panel A.An object point above the lens in the three-dimensional space can be located using three coordinates,i.e.,azimuth angle to the north(φ),zenith angle to nadir(θ),and radial distance(R)to the camera(O).A pixel in the obtained photograph or image plane can be located with two coordinates,i.e.,azimuth angle to the north (φ) and radial distance (r) to the image center (o).According to the optical imaging principle,all points in line O-A1in Fig.3a will be projected to the same pixel(a)in the image plane.However,only the closest object point to the camera will be imaged,and other objects behind will be blocked.For example,A1and the sun will not be imaged as both are blocked by object A2.This means that the image pixel for a given object point can be determined only using the azimuth and zenith angles.To be more specific,the azimuth angle(φ)of an image pixel can be determined using the azimuth angle of an object point(φ).The radial distance(r)of a pixel to the image center is only a function of the zenith angle(r=f(θ)).When the zenith angle of an object is zero,it will be projected to the image center.The zenith angles corresponding to exterior boundary pixels in the image are close to 90°.Generally,the relationship between r and θ is nonlinear and should be obtained through photogrammetry.However,a simple linear relationship was assumed in this study for simplicity.With this relationship,object points in the 2π-hemispherical space above the lens can be mapped to pixels in the image plane regardless of the object's distance from the camera.
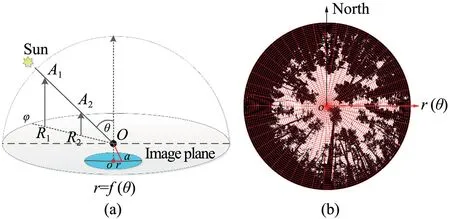
Fig.3. A schematic diagram for fisheye (hemispherical) photography.a) The imaging principle;b) A diagram for the obtained binary fisheye image.
Fig.4a is a typical binarized fisheye image.The black area indicates canopy elements(e.g.,stems,branches,and leaves),which block the sky from being seen by the camera.In contrast,the white area represents canopy gaps(i.e.,sky).At a given time,the sun can be projected to a pixel in the image according to its azimuth and zenith angles,which are calculated according to the equations proposed by National Oceanic and Atmospheric Administration (NOAA,http://www.esrl.noaa.gov/gmd/g rad/solcalc/azel.html).For example,the two blue curves in Fig.4a stand for tracks of the sun on the winter and summer solstices.The sun will be projected in the region between these two curves on the remaining days of a year.If the sun is projected into a black pixel,it is sheltered from the camera by a canopy element.That is,the incoming direct solar radiation(Idir)beneath the canopy vanishes,and there is only diffuse solar radiation(Idif)under the canopy.Fig.4b shows a calculated potential index for Idirevery minute in a year,with a value of 0 (black)denoting the nonexistence of direct radiation and 1 meaning the existence of direct solar radiation.Fig.4c shows the 10-min mean of transmittance of Idirbeneath the canopy,aggregated from Fig.4b,as a proportion of time with direct solar radiation every 10 min.Based on this assumption,at a given time,the incoming solar radiation under a forest canopy could be estimated as follow,

Fig.4. A schematic diagram for calculating the transmittance of direct solar radiation beneath a forest canopy based on a binary fisheye image and the sun tracks.a)A schematic binary fisheye image for a forest canopy.θ and f are zenith and azimuth angles,respectively.The two curves in blue stand for sun tracks on the winter and summer solstices;b) Minute transmittance of direct solar radiation.Black area means the sun is shadowed by canopy elements (i.e.,stems,branches,and leaves);c)Averaged transmittance of direct solar radiation every 10 min.
where Tdiris the transmittance for direct solar radiation;SVF is the sky view factor,which represents the openness for diffuse solar radiation going through a forest canopy and can be evaluated by the ratio of the number of white pixels to the total number of pixels in an image;and Idirand Idifare downward direct and diffuse solar radiation above the forest canopy,respectively.
Equation (2) reveals that the incoming direct and diffuse solar radiations are required to calculate the sub-canopy solar radiation,and they were evaluated by the method proposed by Bristow(Bristow et al.,1985):
where τtis the total transmittance for solar radiation going through the atmosphere,and τdis the transmittance for diffuse radiation.Suis the extra-terrestrial solar radiation on the top of the atmosphere.Sobsis the in-situ measured global solar radiation arriving on a horizontal plane.B is the transmissivity for a totally clear sky,and a value of 0.85 was used in this study.α,δ,and h stand for latitude,solar declination,and solar hour angle,respectively.And Idirand Idifare downward direct and diffuse solar radiation above the forest canopy,respectively.
3.Results
3.1.Dynamics in sky view factor (SVF)
After a series of image processing(including image matching of photographs shot at different times,registration,and binarization),some fisheye pictures presenting various growth states of the forest canopy at three selected sites(P1,P2,and P3)with different forest types are shown in Fig.2.As shown,the trees at P1 and P3 were still deciduous on May 11,2018,and the openness of the forest canopy (the fraction of white area)was large.Then,with leaves and branches growing,the forest canopy became denser (i.e.,the black area expanded),and the canopy openness decreased gradually(i.e.,the white area shrank).The leaves and branches stopped growing until the end of July or the beginning of August,and the forest canopy reached its densest state.Then,tree leaves began to fall slowly until becoming entirely deciduous.It is obvious that the canopy at P3 is much denser than that at P1.Actually,the state of the forest canopy structure at P2 changed similarly to P1 and P3.However,it is not visually apparent because the shooting spot was far away from the canopy.To quantitatively describe the dynamics of forest canopy openness and calculate the sub-canopy solar radiation,an index of sky view factor(SVF)was calculated for each fisheye photo,and the results are listed in Table 1.
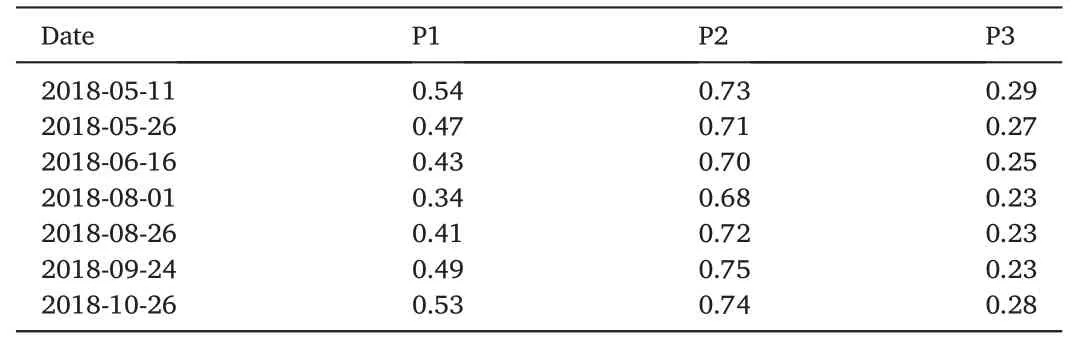
Table 1 SVF (Sky view factor) of the forest canopy at P1,P2,and P3 on different days.
As shown in Tables 1 and it is not difficult to find that the SVF was smallest at P3 on all shooting days because the canopy is the densest.At all three study sites,the canopy SVF decreased from May 11,2018,due to the growing branches and leaves,reaching the smallest value on August 1,2018.Of course,the smallest SVF of canopy may not occur precisely on August 1 due to a large interval (about one month) between two consecutive shootings.However,the occurring time for the smallest SVF would not be far from August 1,by the rule of thumb.Then the SVF began to increase after August 1.When the trees became completely deciduous again on October 26,2018,the SVF values at the three sites reached levels close to May 11,only with minor differences.It should be noted that SVF at P1 has the greatest variation with seasons,and the changes in SVF at P2 and P3 were much smaller than that at P1.The reason is that there is nearly no forest canopy over the shooting spot at P2,with just a few trees scattering around.However,the reason for P3 is the opposite:the canopy is too dense.Even without leaves,bare tree stems or branches leave few gaps in the canopy.Besides,there could also exist some errors in the image binarization process.Namely,there could be some mistakes in distinguishing the canopy elements and gaps,leading to the same SVF value on September 24 as on August 1.
3.2.Transmittance of direct solar radiation through the forest canopy
After the fisheye photographs were registered with zenith and azimuth angles for each pixel,sun tracks for each day in a year can be superposed on the fisheye pictures according to the sun azimuth and altitude,which was calculated in 1-min time step.When the sun is superposed in a canopy gap pixel (i.e.,a white pixel in a fisheye photo),solar beam or direct solar radiation can go through the canopy and reach a surface beneath the canopy,and the transmittance of Idiris assigned to 1.Otherwise,no direct solar radiation will be received under the canopy,and a value of 0 is assigned to the transmittance of Idir.Based on this assumption,the transmittance of Idirthrough a canopy can be estimated from the fisheye photographs.The upper panels in Fig.5 show the transmittance per minute (white for 1 and black for 0) of Idirin 2018 based on the collected fisheye photographs at P1,P2,and P3.In calculation,the nearest photograph in time was used for each Julian day.Then the transmittance per minute was aggregated in to 10-min average(i.e.,the fraction of time with direct solar radiation every 10 min),and they are shown in the lower panels of Fig.5.Besides,hourly transmittance was also assessed based on the per-minute series.By visual inspection,the transmittance of Idirat P2 is the largest because there was nearly no canopy structure over the shooting spot.Overall,the transmittance of Idiris smaller at P3 than that at P1 since the forest canopy at P3 (Betula fruticosa-L.dahurica)is much denser than that at P1(Ledum-Claopodium-L.dahurica).
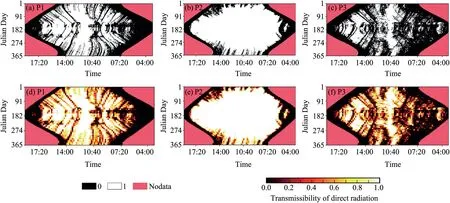
Fig.5. Calculated potential transmittance of direct solar radiation based on fisheye photographs.The upper panels show the transmittance per minute of direct solar radiation through the canopy.The black area stands for the time when canopy elements sheltered the sun.The lower panels are the corresponding 10-min mean values for the upper panels.
The mean transmittance of Idirwas calculated for each hour in a day over all days in each month,and the results are presented in Fig.6.The transmittance in 2 h after sunrise and before sunset is small due to a low sun elevation and more shadows cast by tree stems,especially in months with new branches or leaves growing up.Then the transmittance reaches a maximum at noon.It is evident that the transmittance of Idirat P2 is the largest nearly in each month among the three sites due to almost no existence of canopy structure over the shooting site.Because the forest canopy at P3 is much denser than that at P1 and P2,the transmittance is the lowest virtually every month,even in winter when all trees are entirely deciduous.At P3,the maximal value for the hourly average transmittance of Idirin winter is less than 0.8,and it is only 0.69 in December.And mean and maximal values are higher at P1 than at P3 for all months.
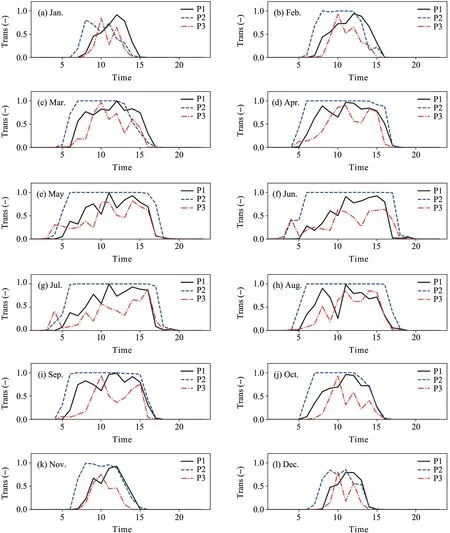
Fig.6. Average hourly transmittance (Trans) of direct solar radiation through the canopy over all days in selected months at P1 and P2.
3.3.Validation for the calculated sub-canopy solar radiation
Although the transmittance of Idircalculated in section 3.2 partly reflected the spatial distribution of canopy gaps,it cannot directly and quantitatively reveal the actual sub-canopy solar radiation due to the diurnal variation in the amount of solar radiation above the canopy.To estimate the solar radiation arriving on a surface beneath the canopy at P1,P2,and P3,half-hourly observed downward solar radiation on a tower above the forest canopy was firstly interpolated linearly to a 10-min series,and it was separated into direct (Idir) and diffuse (Idif) solar radiation using Equation(3).Then Equation(2)was used to estimate the sub-canopy solar radiation using SVF and 10-min transmittance of direct solar radiation,in combination with Idirand Idif.
The solar radiation observed by a solar radiation meter installed at about 20 cm from the ground surface beneath the canopy at P1 and P3 was used to validate the calculated sub-canopy solar radiation based on Equation(2).Comparisons of hourly mean values for selected months are illustrated in Figs.7 and 8 for P1 and P3,respectively.As shown in Fig.7,the calculated sub-canopy solar radiation at P1 is consistent with in-situ observations in May,Jun,and July.However,the observed sub-canopy solar radiation is much smaller than those calculated in January,August,and December.The reason for this discrepancy in January and December is that,typically,there is snowfall and snow cover in the study area.In extreme situations,the maximal snow depth could exceed 50 cm.The radiometer receiving solar radiation may be covered by snow or ice,which could significantly decrease the observed solar radiation.Unfortunately,this could not be avoided because the instruments were installed in a thick,depopulated forest zone.In addition,although the bush under the canopy at P1 is much sparser than that at P3,there indeed exists some Ledi palustris herba under the forest canopy,and some bush is higher than the radiometer,sheltering the incoming solar radiation to some extent.However,the fisheye photographs were shot at about 1 m,higher than the bush or herb.That is,the influence of bush or herb on sub-canopy solar radiation was ignored in the calculation,but it was captured by the radiometer,resulting in a smaller observed solar radiation in August.The situation for P3 is a little worse than for P1.Except for the influences of snow and ice in cold seasons(January,February,April,and December),the bush beneath the forest canopy at P3 is much denser than that at P1,which resulted in a much worse accuracy for the calculated solar radiation in July and August.Although the accuracy is compromised by the reasons mentioned above,if the impacts of bush were ignored,the method based on the fisheye photographs in this study can be used to investigate the influences of canopy structure on the subcanopy solar radiation.
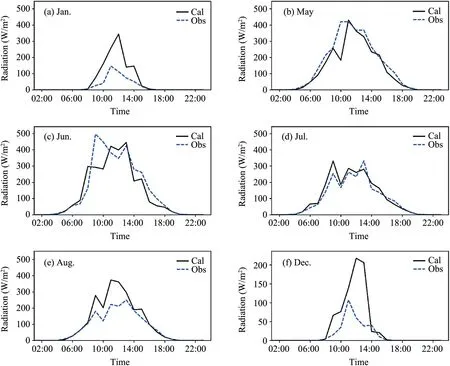
Fig.7. Comparison of calculated and in-situ observed sub-canopy solar radiation for selected months at P1.

Fig.8. Comparison of calculated and in-situ observed sub-canopy solar radiation for selected months at P3.
3.4.Influences of canopy structure on the sub-canopy solar radiation
Calculated hourly sub-canopy solar radiations at P1,P2,and P3 were averaged over a month and are illustrated in Fig.9.In-situ observed solar radiation above the canopy is also calculated and presented for reference.Obviously,the calculated solar radiation at P2 was less influenced by the forest canopy,except in December and January,when the sun had a low altitude and happened to meet the forest canopy near the skyline.However,the sub-canopy solar radiation at P1 and P3 decreased significantly compared to in-situ observed solar radiation above the canopy,as the forest impeded much solar radiation from penetrating through the canopy.Even in winter,the leafless tree stems and branches still sheltered considerable solar radiation.By visual inspection,the sheltering effect of the forest canopy was more pronounced at P3 than that at P1 since the canopy at P3 was much denser.For a more quantitative analysis,the corresponding monthly mean values of sub-canopy solar radiation are listed in Table 2.The bulk transmittance(BTR)of total solar radiation (including direct and diffuse solar radiation),i.e.,a ratio of calculated total solar radiation beneath a canopy to the solar radiation above the canopy,was also calculated and presented in Table 2.The annual mean solar radiation above the canopy was about 148.3 W/m2in 2018,and it was about 90.0,123.8,and 61.0 W/m2beneath the canopy at P1,P2,and P3,with a BTR value of 0.60,0.84,and 0.42,respectively.Even at P2,the sheltering effect of the forest canopy was insignificant,with 16%of the total solar radiation blocked.However,the BTR at P2 is higher than 0.8 in all months except December and January.As explained previously,the sun has a low altitude in December and January,and few canopies exist near the skyline.In a year,60%of the total solar radiation can reach beneath the canopy at P1.In contrast,the amount is only 42%at P3.The BTR at P3 is always smaller than that at P1 due to a denser canopy structure.In fact,the BTR in most months at P3 is smaller than 0.5.The maximal monthly mean solar radiation above the canopy occurs in June,with a value of 235.6 W/m2.However,the corresponding solar radiation beneath the canopy at P1 and P3 is only about 113.3 and 67.7 W/m2,resulting in the lowest BTR in a year,i.e.,0.48 and 0.29.In general,the forest canopy reaches a lushest state in July,and its sheltering effect should be strong.However,the BTR in June is smaller than that in July.The reason is that the canopy state and fractions of direct and diffuse solar radiation jointly influence BTR.According to Table 2,the mean solar radiation is 235.6 and 182.9 in June and July,indicating that the fraction of direct solar radiation in June could be much higher than in July.
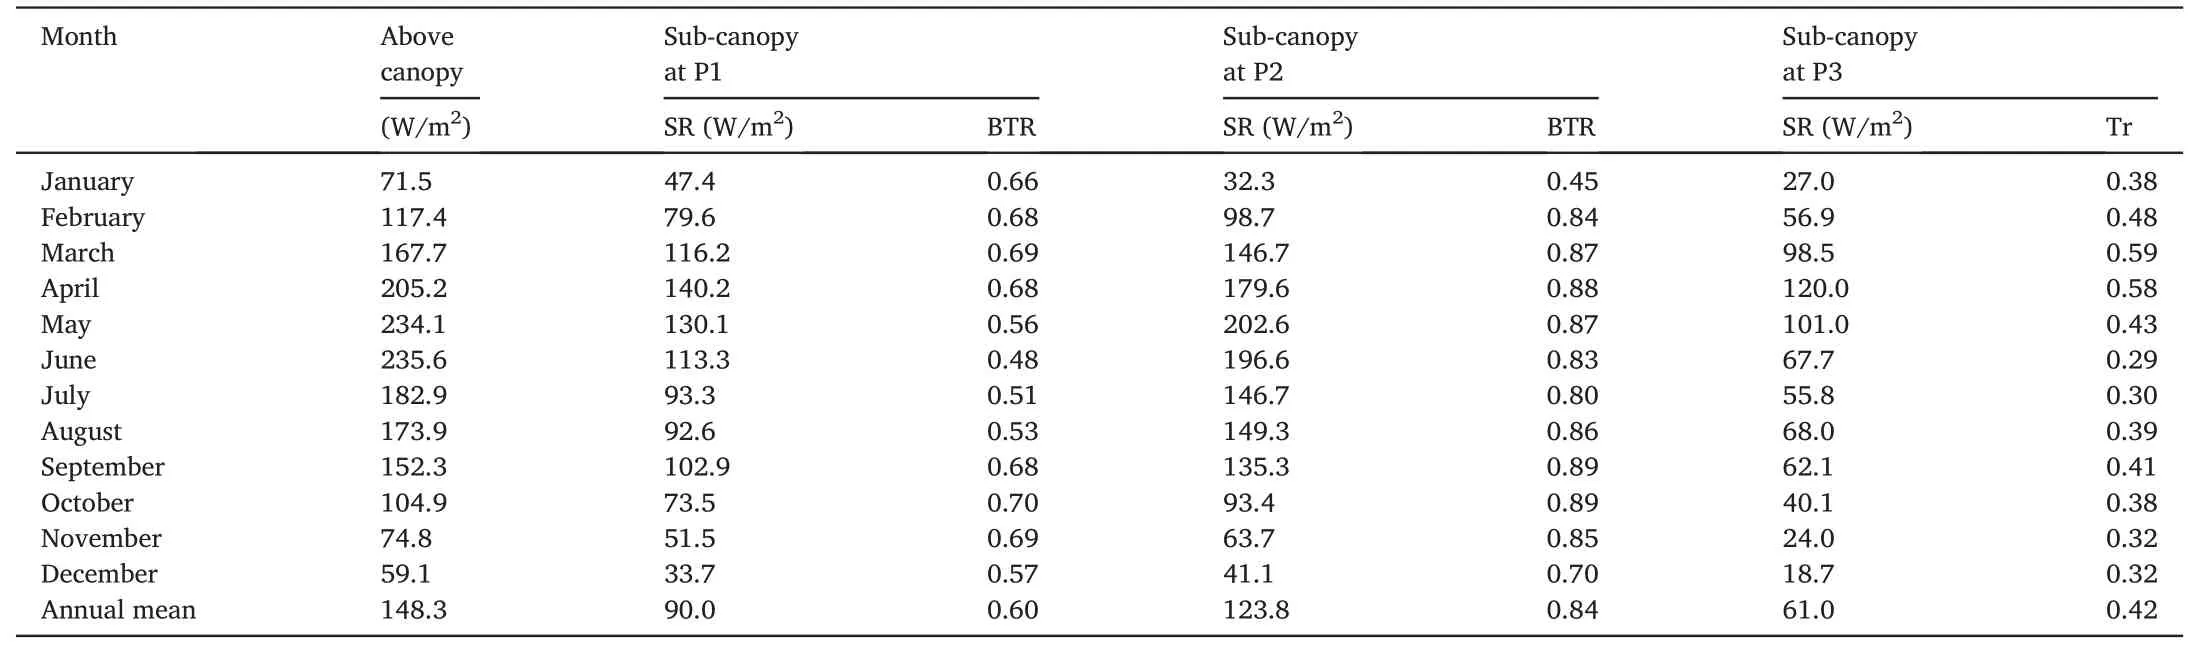
Table 2 Calculated monthly mean sub-canopy solar radiation (SR) at three selected sites and bulk transmittance (BTR) of the total solar radiation.
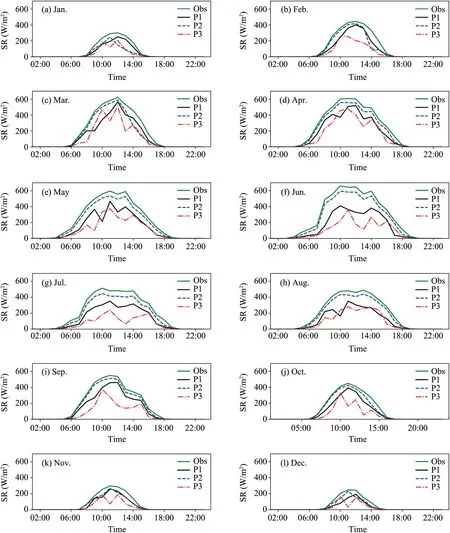
Fig.9. Calculated sub-canopy solar radiation (SR) at three selected sites and in-situ observed solar radiation above the canopy (Obs).
4.Conclusions and limitations
In this study,photographs at various times in a growth cycle of forest canopy were acquired with a digital fisheye camera at three sites with different vegetation types and conditions in a deciduous forest near the Greater Khingan Mountains Forest Ecological Station,Northeast China.The three sites include P1 in Ledum-Claopodium-L.dahurica,P2 in Carex tato-L.dahurica,and P3 in Betula fruticosa-L.dahurica.These fisheye photographs were processed (including matching,registration,and binarization)and used to identify the canopy structure and investigate its impacts on the sub-canopy solar radiation.A simple algorithm was proposed to estimate the sub-canopy solar radiation,and the results were validated by in-situ observed solar radiation above and beneath the canopy.Results show that the fisheye photographs can successfully capture the variation in forest canopy structure with time,and they are useful in estimating the sub-canopy solar radiation.The sky view factor(SVF),an indicator of sky visibility from beneath a forest canopy,can quantitatively measure the transmittance of diffuse solar radiation (Idif)scattered from the sky and correlate well with the canopy density.The order of Idiftransmittance for the three sites is P2,P1,and P3 from the largest to the smallest.There is nearly no canopy structure over the shooting spot at P2.Under the densest forest at P3 with thick canopy elements,the SVF does not exceed 0.3 year-round,even in winter when the trees are leafless.At P1,the SVF is relatively higher than that at P3 due to more sparsely scatted trees.Namely,the diffuse solar radiation penetrating through and arriving beneath the canopy at P1 is much higher than that at P3.The situation is similar for direct solar radiation.
Results also show that the Idirtransmittance at P3 is much lower than that at P1 and P2 because the forest canopy at P3 is much denser,even in winter when all trees are entirely deciduous.At last,the sub-canopy solar radiation was calculated at each site and validated by in-situ observed solar radiation beneath the canopy at P1 and P3.Although the accuracy of the calculated sub-canopy solar radiation is compromised due to the limitations involved in this study,the results are still of significance.When snow and understory bush impacts on observation are small,the calculated and observed sub-canopy solar radiation agree well.Even at P2,where the sheltering effects of the canopy are not pronounced,16%of the total solar radiation is shaded away by the forest canopy far away.The sub-canopy solar radiation at P1 and P3 is much impeded by the forest canopy,even in winter when the trees are leafless,since leafless tree stems and branches still block a large amount of solar radiation.
Quantitatively,the annual mean solar radiation above the canopy was about 148.3 W/m2in 2018,and it was about 90.0,123.8,and 61.0 W/m2beneath the canopy at P1,P2,and P3,with 60%,84%,and 42% of the total solar radiation penetrating through the canopy,respectively.When the forest canopy reached the lushest in June and July,the fraction for sub-canopy solar radiation could be even less,dropping to about 50% and 30% for P1 and P3,respectively.In short,the forest canopy in a deciduous forest in Northeast China has significant influences on the sub-canopy solar radiation,and the method based on fisheye photographs proposed in this study could be effective in estimating the canopy structure and its impacts on the sub-canopy solar radiation at a site scale.
Although the proposed method is straightforward,there still exist some shortcomings in this study.First,the fisheye photographs were shot at different times in a year.Although the shooting spots were firmly fixed by three tubes at each site and the camera was mounted at a fixed height using the same tripod,some inevitable distortion and mismatch existed between photographs.It is a respectable challenge to get a set of wellmatched pictures.The side effects caused by mismatching can be seen in Fig.5,i.e.,the apparent misalignment of pixels standing for canopy elements on days of shooting.Of course,this was also partly caused by the change in canopy structure between two consecutive shooting times,which was about a month or even longer.This could lead to another problem: the variation of canopy structure with time could not be well captured.However,if the photographing frequency is increased,the difficulty of photograph matching will also rise.This is an insurmountable contradiction.Secondly,multiple reflections of solar radiation among canopy elements were not considered in estimating the subcanopy solar radiation.On sunny days,the reflections from the stems or branches of the bright coniferous forest,and even mixed birch,are considerable.The side effects of reflections from canopy elements also exist in image binarization.A few bright pixels of canopy elements were misclassified into sky pixels.This leads to another challenge: An appropriate threshold should be set in binarization to distinguish the canopy gaps and elements,and often a trial-and-error method is applied.
Additionally,the forest structure is very complex in the Greater Khingan Mountains forest.Typically thick bush (e.g.,Betula fruticosa-L.dahurica at P3 and Ledum-Claopodium-L.dahurica at P1) often stands under the larch forest,and herbaceous plants even exist underneath.However,fisheye photos were often shot at about 1 m height for the convenience of operation,which probably did not capture the bushes and herbs.If the solar radiation arriving on the ground surface is the concern,the fisheye photos should be shot at a very low height.At last,the application of the method proposed is limited to a site scale.It is difficult to be extended to a spatially distributed application.However,when a three-dimensional forest structure is obtained,the concept in this study could be of reference.
Acknowledgments
This work is supported by the National Natural Science Foundation of China(Grant Nos.41971079 and 41671059,41975081).
 Sciences in Cold and Arid Regions2023年3期
- Sciences in Cold and Arid Regions的其它文章
- Influence of climate change on hydrological process in the upper reaches of Shiyang River: A case study of the Xiying River,China
- Seepage influence of supra-permafrost groundwater on thermal field of embankment on Qinghai-Tibet Plateau,China
- An overview of the policies and models of integrated development for solar and wind power generation in China
- Editor-in-Chief Yuanming Lai
- Progress on research and mitigation of wind-blown sand risk in Dunhuang Singing Sand Mountain and Crescent Spring Scenic area,China
- Guidelines to Authors