
Seepage influence of supra-permafrost groundwater on thermal field of embankment on Qinghai-Tibet Plateau,China
2023-11-02 12:01:56MingTngChiYunLuoYuGoWeiYnHuMu
MingTng Chi ,Yun Luo ,Yu Go ,Wei M ,YnHu Mu
a School of Civil Engineering and Hydraulic Engineering,Ningxia University,Yinchuan,Ningxia 750021,China
b State Key Laboratory of Frozen Soil Engineering,Northwest Institute of Eco-Environment and Resources,Chinese Academy of Sciences,Lanzhou,Gansu 730000,China
c University of Chinese Academy of Sciences,Beijing 100049,China
Keywords: Permafrost Embankment Hydro-thermal coupling Thawed inter-layer
ABSTRACT As a unique hydro-geological phenomenon in permafrost regions,the seepage of supra-permafrost groundwater will carry a large amount of heat and cause differential settlement in the embankment.This paper presents the results of a field study monitoring the supra-permafrost groundwater levels on both sides of an embankment in permafrost regions.It describes a two-dimensional coupled hydro-thermal model and uses it to analyze the influence of seepage on its temperature field considering climate warming.The results show that seepage exacerbates permafrost thawing and thickens the active layer.The thermal influence on the sunny side of the embankment toe is more significant than that on the shady side,which will cause differential settlement in the embankment.After 50 years of operation,the embankment soil temperature with seepage during freezing is 0.2 °C warmer than that without seepage,and the thermal influence diminished with the increase in depth.Additionally,seepage influences the thermal regime in vertical and horizontal directions of the embankment.During freezing seasons,the thaw depth increases,and the horizontal thaw range decreases.During thawing seasons,the thaw range grows both vertically and horizontally.
1.Introduction
Supra-permafrost groundwater exists in the active layer and any unfrozen layer or talik above the permafrost table in permafrost areas,including plains,watersheds and river terraces (Chai et al.,2021;Zhang et al.,2020).The supra-permafrost groundwater will result in seasonal freezing and thawing of soil and rock as air and ground surface temperatures change (Chai et al.,2021;Ding et al.,2021).As an almost impermeable layer,permafrost prevents the downward infiltration of the supra-permafrost groundwater.It limits the water exchange and hydraulic connection between ground surface water and the unfrozen soil layer underlying permafrost,determining the groundwater spatial distribution pattern and biogeochemical recycling mode(Metcalfe and Buttle,2001).Therefore,the formation,development,transportation and dynamic process of supra-permafrost groundwater significantly differs from the phreatic water in other regions (Ma et al.,2020).The supra-permafrost groundwater is not only a key component in water circulation but also relevant to the change of ecological environment in cold regions,which plays a unique role in the terrestrial hydrological cycle.
The supra-permafrost groundwater has seasonal variation in aquifer thickness,water flow,water temperature,phase change,hydro-chemical,and hydro-dynamic characteristics due to local factors such as topography,geomorphology,vegetation,precipitation,and lithology (Ye and Chang,2019).As a component of the entire groundwater system,supra-permafrost groundwater is a typical hydro-geologic phenomenon that cannot be neglected during permafrost degradation and the formation of related hazards in the Qinghai-Tibet Plateau (Yang and Chen,2011).
Permafrost hydrology study in China started in the 1970s,with early work centering on the Qinghai-Tibet Plateau.Permafrost groundwater study has developed quickly and mainly focused on permafrost engineering (Cheng and Jin,2013;Zhang et al.,2015).When supra-permafrost groundwater traverses an embankment in permafrost regions,the seepage of supra-permafrost groundwater will be affected by embankment loading and the drop in permafrost table underlying the embankment (without “cooling” measures) (Shan et al.,2022).During operation,the seepage of supra-permafrost groundwater at 2-4°C in the active layer and embankment will result in permafrost temperature rise,accelerate permafrost degradation and talik formation,and hence aggravate embankment settlement and exacerbate distress development(Qian et al.,2016;Yu et al.,2021).
One common groundwater monitoring method is via boreholes,which can intuitively reveal the seasonal variation of groundwater level in permafrost regions.Chang et al.(2015) observed the seasonal dynamics of supra-permafrost groundwater in the Fenghuo Mountain catchment area on the Qinghai-Tibet Plateau by boreholes.The results show that the water level has a similar process to soil temperature and water content of the active layer (Chang et al.,2015).In recent years,coupled hydro-thermal models have been proven effective in analyzing groundwater dynamics(Li et al.,2003;Ye and Chang,2019).The phase change of groundwater and the effect of permafrost distribution on groundwater migration can be reflected by the simulation of groundwater flow in permafrost regions with a hydro-thermal coupling model(Zhang et al.,2016).
Many coupled hydro-thermal models of permafrost have been proposed recently.Taylor and Luthin(1978)built a hydro-thermal coupling numerical model based on heat transfer and seepage theory of unsaturated soil.However,no relationship was provided to link pore ice and unfrozen water content with temperature.Ma et al.proposed a one-variable equation to relate the ice content with temperature (Ma et al.,2020),but the effect of unfrozen water migration was neglected(Shan et al.,2022).Further,a hydro-thermal model was proposed to consider the equilibrium of pore ice content,negative temperature and water migration (Tabarsa and Lashkarbolok,2018;Shan et al.,2022).However,the soil property and seepage in different soil layers were not considered in the above model,and the influence of slope embankment and the“sunny-shady slope”effect was also neglected(Yuan et al.,2017).In this paper,the seepage influence of supra-permafrost groundwater on the temperature field was analyzed at actual engineering conditions with the “sunny-shady slope” effects accounted for.The feasibility and effectiveness of coupling simulation were validated by comparison with field monitoring data.The coupling simulation model was applied to analyze the influence of supra-permafrost groundwater on the temperature field underlying an embankment of the Qinghai-Tibet Highway in the permafrost region.
2.Mathematical model
2.1.Controlling equation of temperature field
The soil is assumed to be homogeneous.Convection,mass migration,evaporation,and chemical potential were neglected.Only the conduction and phase transition were considered.The two-dimensional temperature field with an unstable state in the soil can be described as follows(Zhang et al.,2018):
where ρ is the soil density (kg/m3);C is the heat capacity of soil(J/(kg·°C));λ is the heat conductivity (W/(m·°C));T is the soil temperature (°C);t is the time (day);and x and y are spatial variable.Unfrozen water and pore ice exist simultaneously during freeze and thaw.The heat capacity and heat conductivity considered with phase transition can be described as follows,
where Cuand Cfare the heat capacity of frozen and unfrozen soil;L is the latent heat of water (334.56 kJ/kg);W and Wiare total water and ice content in frozen soil,respectively;(Tb,Tp) is the temperature range of phase change.
where λuand λfare the thermal conductivities of unfrozen and frozen soil,respectively.
2.2.Controlling equation of moisture field
Unfrozen water exists in the embankment during freeze and thaw,and its migration was assumed to follow the Darcy law(Hou et al.,2020;Liu et al.,2021).When the retardation from pore ice to migration of unfrozen water was considered,the migration equation can be described as follows,
A macro-model was adopted to describe the coefficient of hydraulic conductivity of soil,in which the fluidity can be expressed by macrovariables such as mean velocity,mean hydraulic gradient,mean hydraulic radius and mean permeability coefficient.The influence of the size and distribution of different capillaries on fluidity was neglected in the above model (Zhang et al.,2016).The V-G model,which combines the soil-water characteristic curve with the Mualem model(Zhang et al.,2020),is as follows,
where Ksis saturated permeability coefficient (m/s);Seis effective saturation;θ,θrand θsare water content,residual water content and saturated water content of melted soil,respectively;m,n and α(m-1)are soil parameters,m=1-1/n;h is the hydraulic head,and I is the resistance coefficient of ice.
The accumulation of water migration during freeze and thaw was neglected in this study.Therefore,θ is a constant,which is the initial given water content.The ice blocks the water channel and reduces the water conductivity in frozen soil(Van Genuchten et al.,1980).Therefore,a resistance coefficient I was introduced to reflect the resistance to water migration from ice in frozen soil and can be related to volumetric ice content θias follows,
2.3.Coupling method
In the heat transfer and water migration equations,temperature,volumetric ice content and unfrozen water content are three unknown variables (He et al.,2000).A connection equation to link θi,θuwith T should be introduced to solve the coupled hydro-thermal equation.Yu et al.(2021) proposed an equation for estimating the unfrozen water content in frozen soil based on testing results.It has been widely used and is as follows,
where W0is the soil's initial water content;Wuis the unfrozen water content;B is an empirical coefficient,and 0.56 was suggested for clay,0.47 for silt,and 0.61 for sandy soil.The volumetric ratio of pore ice and unfrozen water(Bi) can be expressed as follows(Zhang et al.,2016),
where 1.1 is the density ratio of water and ice.Therefore,the relationship of θi,θuand T can be expressed as follows,
In summary,the coupling between the hydro and thermal equations for supra-permafrost groundwater in permafrost regions can be resolved by solving the temperature field Equation(1),water field Equation(4)and dynamic equilibrium equation of phase transition(11).
3.Influence of seepage on temperature field
3.1.Physical model
A test section along the Qinghai-Tibet Highway in permafrost regions was selected for analysis.The embankment filling and soil underlying the natural ground were assumed to be homogeneous.There is no supply and drainage of water around the embankment.As illustrated in Fig.1,the soil profile below the embankment consists of sandy soil(0-0.5 m),clay(0.5-2.0 m),ice-rich permafrost(2.0-8.0 m)and weathered mud-stone.The total width,depth of the analysis model,the embankment slope and thickness are 80 m,30 m,2°and 3 m,respectively.Table 1 lists each soil layer's physical properties and hydro-thermal parameters (Deng et al.,2021).

Table 1 Physical properties and hydro-thermal parameters of soil layers.
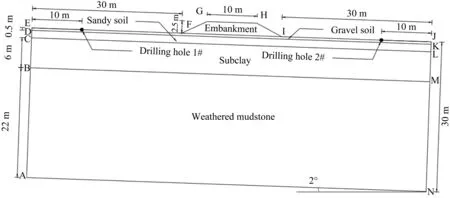
Fig.1. Schematic diagram of calculation model of the embankment.
3.2.Boundary conditions and initial values
The boundary condition of temperature is determined based on the boundary layer theory and measured temperature considering climate warming (Sun et al.,2021).The surface temperature of natural ground,pavement and embankment slope can be expressed by sine function as follows,
where T(t)is the daily mean air temperature (°C);The values of the initial temperature T0(°C)and annual amplitude A(°C)on each surface of the embankment and the natural ground are listed in Table 2;g(t)is the temperature rise rate considering climate warming and is assumed to be 0.03°C/a for the study site.

Table 2 Mean annual air temperature and annual amplitude for different boundaries.
Engineering practice and field observations show that the embankment has no thermal effect on the natural ground 15 m from the embankment slope toes.Therefore,both sides of the model were set as adiabatic.Additionally,the thermal influence of air temperature variation is limited to the shallow ground (Zhang et al.,2020),and the ground temperature at a certain depth can be assumed to be constant(Hamm and Frampton,2021).Therefore,the lower boundary was set to a constant temperature of -1°C.The initial soil temperature was based on the measured data on October 1st,2009,as depicted in Fig.2(Yu et al.,2019).
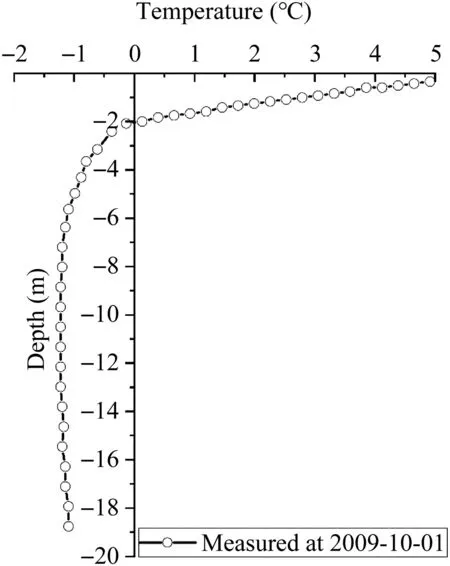
Fig.2. Initial soil temperature distribution with depth.
The rainfall and evaporation of the ground surface were neglected.The upper and lower boundaries were set to zero flux,and the right and left boundaries were assumed as free-flow boundaries.The groundwater levels on both sides of the embankment were monitored by boreholes(Fig.3)and were used as the seepage boundary conditions.Boreholes No.1 and No.2 were on the left and right sides of the embankment,respectively.
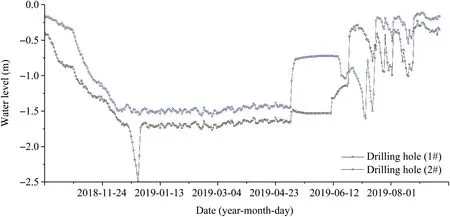
Fig.3. Variation of groundwater levels on both sides of the embankment.
3.3.Field observation and model validation
The analysis results of ground temperature were validated by measured data.The comparison of measured and simulated temperatures at various depths under the embankment center is shown in Fig.4.The simulated results agree well with measured results,which validates the reliability of the analysis model.The above model can be used to analyze and predict the influence of seepage on the temperature field of the embankment and underlying natural ground.
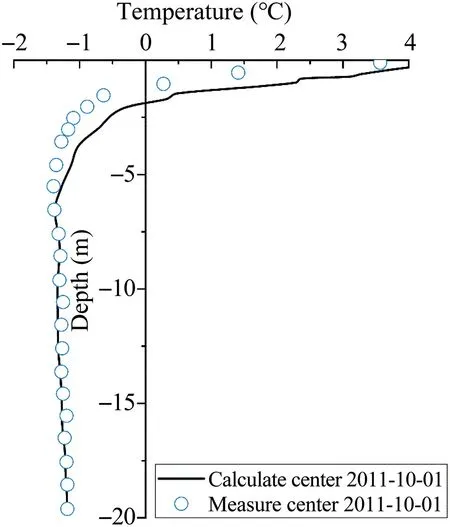
Fig.4. Comparison of simulated and measured temperature at various depths under the embankment center.
4.Results
4.1.Temperature at different depths without seepage
The temperature variation with depth under the embankment center on October 1st during 50 years of operation is illustrated in Fig.5.When no supra-permafrost seepage is considered,the permafrost temperature rises due to climate warming.The temperature at 0.5 m depth is 7°C higher than other depths,and the temperature difference has always existed for a long time.The ground temperatures at 5.0 m,10.0 m and 15.0 m depth remain below 0°C in the first 5 years,indicating the ground stays frozen.With the increase in operation time,the temperatures at 3.0 m,5.0 m,10.0 m and 15.0 m rise above 0°C in the first year,the third year,the fifth year,and the twentieth year,respectively.After 50 years of operation,the temperature difference between 10.0 m and 15.0 m depths is 0.3-0.5°C,and between 5.0 m and 10.0 m depths is 0.2°C.
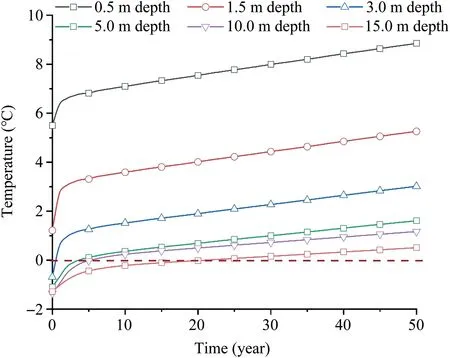
Fig.5. Variation of temperature at different depths under the embankment center with time for seepage conditions.
4.2.Influence of seepage on temperature variation at different depths
The simulated temperature results with and without seepage in the next 50 years were compared in Fig.6 to reveal the influence of suprapermafrost seepage on the embankment temperature field in permafrost regions.It shows that the thaw depth on the embankment shady slope toe is smaller than the embankment center,and the temperature will rise in the next 50 years due to climate warming.As shown in Fig.6b,the calculated ground temperature at 5 m depth under the embankment center after 50 years is approximately 3.3°C without seepage and 3.7°C with seepage.
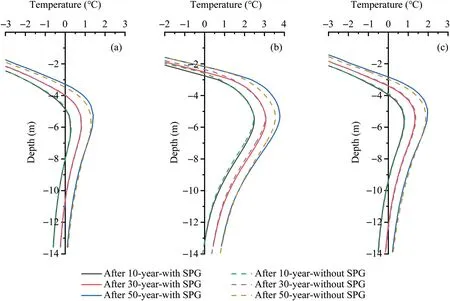
Fig.6. Comparison of ground temperature variation on January 15 after selected years of operation,(a)under embankment shady slope toe;(b)under embankment center;and (c) under embankment sunny slope toe.SPG means supra-permafrost groundwater.
The ground temperature variation with depths on July 15 is shown in Fig.7.The temperature decreases logarithmically in the active layer and linearly with increasing depth in the permafrost layer.There is a thawed inter-layer underlying the embankment after 10 years,with a thickness of 3 m,5 m and 10 m under the shady toe,sunny toe and the embankment center,respectively.After 50 years of operation,the thaw depth increases by 7 m under the embankment center and by 12 m under the embankment slope sunny toe.
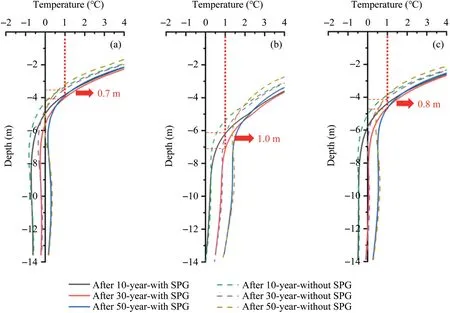
Fig.7. Comparison of ground temperature variation along depth on July 15 after selected years of operation,(a) under embankment shady slope toe;(b) under embankment center;and (c) under embankment sunny slope toe.
4.3.Influence of seepage on temperature variation at the same depth
The embankment operation has a thermal influence on the temperature field of the natural ground and breaks its hydro-thermal balance.Ground temperature distribution at selected depths on January 15 is shown in Fig.8.The active layer on January 15 is frozen,in which the temperature with supra-permafrost seepage is 0.2°C higher than that without seepage.On average,the temperature underlying the embankment is 2.5°C lower than that of the natural ground at 0.5 m depth but is 2°C higher under the embankment sunny slope toe (Fig.8a).At 1.5 m depth,the temperature under the embankment shady slope toe is 1.8°C lower than that in the natural ground and is 1°C higher under the embankment sunny slope toe(Fig.8b).At 3.0 m depth,the temperature underlying the embankment is 2.5°C higher than that in the natural ground(Fig.8c).

Fig.8. Simulated ground temperature distribution after various years of operation at selected ground depths on January 15,(a) 0.5 m;(b) 1.5 m;and (c) 3.0 m.
When the active layer is thawed on July 15,the supra-permafrost seepage carries heat and increases the ground temperature (Fig.9).At the same depth,the ground temperature below the embankment is higher than that in the natural ground.The soil temperature under the embankment is 5.0°C,4.5°C and 3.0°C higher than the natural ground at 0.5 m,1.5 m and 3.0 m depth,respectively.Besides,the soil temperature with supra-permafrost seepage is higher than without seepage.The temperature increasing rate at 3.0 m is faster than that at 0.5 m and 1.5 m under global climate warming.The ground temperature under the embankment sunny slope toe is approximately 1°C higher than under the shady slope toe.

Fig.9. Simulated temperature distribution after various years of operation at selected ground depths on July 15,(a) 0.5 m;(b) 1.5 m;and (c) 3.0 m.
4.4.Variation of ground temperature with seepage in different years
The contour maps of ground temperature from the sunny and shady slope toes of the embankment to 12 m deep are shown in Fig.10.The supra-permafrost groundwater undergoes seasonal migration and freezing-thawing cycles.The permafrost table on both sides of the embankment gradually drops due to global climate warming and the heat absorption of asphalt.The rate within the first 5 years is relatively large,0.9 m/a and 1.6 m/a under the shady and sunny toes of the embankment,respectively.Then the rate decreased to 0.2 m/a afterward.After 20 years,the rate reaches 0.25 m/a and 0.28 m/a under the shady and sunny toes of the embankment,respectively,with the maximum difference in the permafrost table reaching 1.9 m.The temperature field on both embankment sides is unsymmetrical,and the temperature difference grows with the operation time.
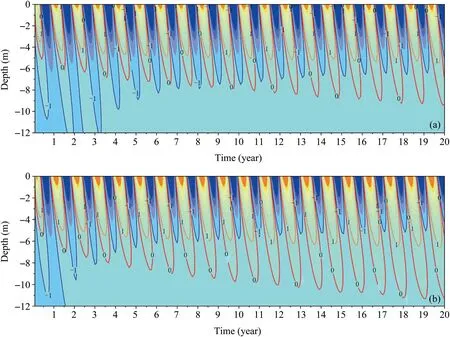
Fig.10. Variation of simulated ground temperature during 20 years of operation,(a)under the embankment shady slope toe;(b)under the embankment sunny slope toe (unit: °C).
The temperature field on January 15 after 5 years,10 years and 50 years of operation is depicted in Fig.11.The ground temperature on the natural ground and under the embankment within 4 m depth is lower than -1°C.The ground temperature under the embankment was controlled by upper boundary conditions and upward freezing from the artificial permafrost table,which forms a thawed inter-layer with 25 m length and 7 m width.The thawed inter-layer develops quickly and has an increasing rate of 1.2 m/a and 0.38 m/along the horizontal and vertical direction,respectively.
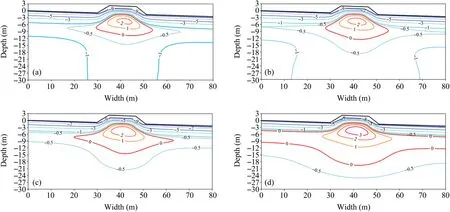
Fig.11. Simulated temperature field on January 15 after selected years of operation,(a) 5 years;(b) 10 years;(c) 20 years;and (d) 50 years.
The temperature field on July 15 after 5 years,10 years and 50 years is shown in Fig.12.With the heat absorption of pavement asphalt,ground temperature under the embankment increases and forms a thawing region,which has an increasing rate of 4.2 m/a and 1.8 m/a along the horizontal and vertical direction during the operation,respectively.After 50 years,the thawing depth under the embankment is 19 m and the thawed region is asymmetrical.
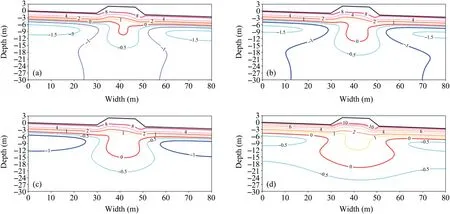
Fig.12. Simulated temperature field on July 15 after selected years of operation,(a) 5 years;(b) 10 years;(c) 20 years;and (d) 50 years.
5.Discussions
Permafrost underlying the embankment degraded quickly due to the heat absorption of pavement asphalt with seepage of supra-permafrost groundwater.The temperature under the embankment increased by 0.3°C with seepage on July 15 and by 0.15°C on January 15.Seepage will increase the temperature and settlement and frost heaving rates,affecting the engineering stability(Zhang et al.,2018;Shan et al.,2022).Seepage influence on the temperature field in both horizontal and vertical directions should be considered.
With the increase in annual air temperature,the thaw depth deepens due to water migration in the vertical direction.In the horizontal direction,the thaw region is smaller than that without seepage during freezing seasons and is larger than that without seepage during thawing seasons.In thaw seasons,the groundwater migrates horizontally and accelerates soil thawing.In freeze seasons,permafrost restricts the downward seepage of groundwater,and the freezing of water under the embankment requires a large amount of latent heat.Therefore,the soil temperature is lower than that without seepage at the same depth.
The soil thaw rate under the embankment increases with the heat absorption of asphalt pavement and embankment load.Groundwater migration is more active under the embankment than in the natural ground.The porosity of deep soil and water migration channels are smaller than shallow soil.Therefore,the shallow soil is more sensitive to groundwater seepage,and the influence depth increases gradually during the operation.Therefore,engineering measures should be adopted to control the groundwater,maintain the embankment stability,and extend the service life of roadways in permafrost regions.
6.Conclusions
Based on the measured supra-permafrost groundwater level and ground temperature,this paper built a coupled hydro-thermal embankment model on a slope in permafrost regions to analyze the temperature field considering global warming and seepage during 50 years of operation.The following conclusions can be drawn.
(1) With the heat absorption of pavement asphalt,the seepage of supra-permafrost groundwater has the largest thermal influence on ground temperature under the embankment than other sections.After 20 years of highway operation and considering seepage,the active layer thickens at 0.25 m/a and 0.28 m/a under the embankment's shady and sunny slope toes,respectively.
(2) The thermal influence of seepage during thaw seasons is more obvious than that during freeze seasons.The thermal influence of seepage should be analyzed in both horizontal and vertical directions.During thaw seasons with seepage,the thaw range of the subgrade and underlying ground increases in the vertical and horizontal directions,and the thawed area is 5 m2larger than that without seepage.During freeze seasons,the thaw range in the vertical direction grows,and that in the horizontal direction shrinks.The thawed area of the lower section of the subgrade with seepage is 2 m2smaller than without seepage.
(3) The thermal influence of seepage on ground temperature,from the largest to the smallest,occurs under the embankment center,sunny slope toe,shady slope toe,and the natural ground.It is recommended that engineering measures,such as diversion and drainage,be adopted to reduce seepage within the supra-permafrost zone to improve the operation safety of roadways in permafrost regions.
Acknowledgement
This research was funded by the National Natural Science Foundation of China(Grant No.42001065),Open Project of State Key Laboratory of Frozen Soils Engineering(Grant No.SKLFSE202106),the Natural Science Foundation of Ningxia (2022AAC03052) and the University First-Class Discipline Construction Project of Ningxia,China (Grant No.NXYLXK2021A03).
 Sciences in Cold and Arid Regions2023年3期
- Sciences in Cold and Arid Regions的其它文章
- Impacts of canopy structure on the sub-canopy solar radiation under a deciduous forest based on fisheye photographs
- Influence of climate change on hydrological process in the upper reaches of Shiyang River: A case study of the Xiying River,China
- An overview of the policies and models of integrated development for solar and wind power generation in China
- Editor-in-Chief Yuanming Lai
- Progress on research and mitigation of wind-blown sand risk in Dunhuang Singing Sand Mountain and Crescent Spring Scenic area,China
- Guidelines to Authors