Urban flood risk assessment under rapid urbanization in Zhengzhou City, China
LI Guoyi, LIU Jihong, , SHAO Weiwei
a State Key Laboratory of Simulation and Regulation of Water Cycle in River Basin, China Institute of Water Resource and Hydropower Research,Beijing, 100038, China
b Water Resources and Water Ecological Engineering Technology Research Center of Ministry of Water Resources, Beijing, 100044, China
Keywords:Urban flood Flood risk assessment Geographic Information System(GIS)Multi-index system method Urbanization Zhengzhou City
A B S T R A C T
1.Introduction
Many countries face serious threats due to the increased frequency and intensity of extreme weather events affected by global climate change such as typhoons, heat waves, and floods.Both developing and developed countries face a serious threat of flood (Paprotny et al., 2020).Zhou et al.(2019) pointed out that heavy rainfall and flood currently account for around 40.000% of all losses caused by disasters worldwide (Zhou et al., 2019).According to the estimate by experts from the World Bank, the average annual flood losses of 136 mega coastal cities in the world were about 6.00×10⁹USD in 2005, and it is expected that this value will increase to 5.20×1010USD by 2050 (Haasnoot et al.,2012).The World Health Organization’s (WHO) annual global disaster statistics report released in 2016 showed that China, the United States, and India are the countries that are most severely affected by flood worldwide.Due to its location in the eastern part of Asia and on the west coast of the Pacific Ocean, most of China is affected by the monsoon climate, and the spatial and temporal distribution of rainfall is extremely uneven, decreasing from southeast to northwest.The concentration of rainfall during flood season makes the occurrence of heavy rainfall and flood disasters frequent and the problem of urban flooding prominent in China (Zhang et al., 2016).
Rapid urbanization brings new issues and challenges to urban flood risk assessment.Urbanization has increased the interaction between human society and ecological environment, thus causing a series of social, environmental,and ecological problems (Camorani et al., 2005).In fact, the growth of urbanization has resulted in more and more flood prone areas (Bera et al., 2021; Tomar et al., 2021).Nonetheless, many studies have shown that extreme precipitation in cities will increase significantly in the future.From the hydrologic point of view, global climate change may cause an increase of flood parameters such as peak, volume, duration, etc.Climate change has led to an increase in the intensity and frequency of extreme rainfall, which is a major cause of frequent flooding.Since the implementation of “Reform and Opening-Up” policy, urbanization developed rapidly in China.By 2020, China’s urbanization rate has exceeded 60.000% and is expected to exceed 65.000% in 2025.The continuous increase in socio-economic level and the expansion of urban built-up areas, coupled with the future gathering of population and assets, make urban flooding more serious, and the phenomenon of “urban sea-gazing” occurs repeatedly in major cities in China (Xu et al., 2020).
Flooding is a global disaster phenomenon and a natural disaster that occurs most frequently.Its occurrence usually results in human casualty, economic loss, and environmental damage.Floods include river (fluvial) flood, flash flood,urban flood, pluvial flood, sewer flood, coastal flood, and glacial lake outburst flood (Kundzewicz et al., 2014).Urban flooding is a phenomenon that the volume of water in an urban area exceeds the rainwater absorption capacity,resulting in a waterlogged disaster in the urban area during extreme events such as heavy rainfall or persistent precipitation (Huang, 2018).Urban flood prevention and control is a hot and difficult issue at present, and urban flood risk assessment is an important non-engineering measure for urban flood prevention and control.The factors that cause urban flooding are diverse and complex, and the direct factors that lead to flooding disasters include heavy rainfall, typhoon, dam failure, storm surge, etc.(Halgamuge and Nirmalathas, 2017).To manage and respond to flood disasters more effectively, it is first necessary to identify sensitive areas susceptible to flood disasters, which requires an assessment of regional flood disaster risks.
Scholars have carried out a lot of research work related to urban flood risk assessment and achieved fruitful results.Based on the TELEMAC-2D hydrodynamic model (French National Laboratory of Hydraulics and Environment,France), Liu et al.(2019) analyzed the urban waterlogging characteristics of Xiamen Island by considering different design rainstorm scenarios.Taking urban rainstorm and flood as simulated objects, Shao et al.(2022) adopted the emergency response capability evaluation method to analyze the response time of hospital, firefighting, and public security rescue under different rainstorm scenarios in the Qianshan River Basin by TELEMAC-2D model.Huang et al.(2019) utilized the InfoWorks Integrated Catchment Modeling (ICM) model (Wallingford, Oxfordshire, Britain)to obtain flood hazard factors and analyze the vulnerability, exposure, and disaster prevention and mitigation capability of the Donghaochong Basin of Guangzhou City to assess the urban flood risk of this basin under different design rainstorm scenarios.Lei et al.(2021) constructed a flood risk assessment system including ten risk factors by using deep learning method and conducted an urban flood risk assessment of Seoul City, South Korea by the system.Li et al.(2021) constructed a flood risk assessment system by selecting a total of seven factors from hazard,vulnerability, and sensitivity three aspects to assess urban flood risk of Wuhan City, China.Zhang et al.(2020)constructed a flood risk assessment system including 13 factors by using Geographic Information System (GIS) as an analytical tool to assess the flood risk of the Yangtze River Basin, China.In recent years, with the continuous improvement of computer computing power and algorithms, many machine learning methods have been used to predict disasters such as flood risk analysis, including artificial neural networks, support vector machine (Tehrany et al., 2015), logic regression (Nandi et al., 2016), random forest (Wang et al., 2015), etc.By reviewing the existed literature of urban flood risk assessment, we found that most researchers conduct urban flood risk assessment on a large scale, and there is a lack of impact analysis of urbanization development on flood risk.
In recent years, Zhengzhou City has been frequently hit by torrential rains and floods, resulting in heavy economic losses and casualties.Under the influence of Typhoon In-Fa and Typhoon Cempaka, Zhengzhou City was hit by extreme heavy rainfall on 17-23 July 2021, called “7·20” rainstorm.The maximum hourly rainfall reached to 201.9 mm during this extreme heavy rainfall according to the record of the Zhengzhou City National Meteorological Station,breaking the maximum precipitation since meteorological records began in mainland China.And during 19-21 July 2021, the cumulative rainfall reached to 787.9 mm monitored by the Zhengzhou City National Meteorological Station,also setting a 3-d cumulative rainfall historical extreme record (Liu et al., 2023).The “7·20” rainstorm triggered an extremely serious urban flooding disaster in Zhengzhou City, resulting in 380 deaths and direct economic losses of 4.09×10¹⁰CNY (Liu et al., 2023).The “7·20” extreme rainfall and flooding incident revealed the deficiencies of Zhengzhou City in urban flood prevention, drainage, and emergency management system, and also sounded a warning for other major cities in China to deal with flooding caused by extreme heavy rainfall.Another revelation from the“7·20” rainstorm is that it is extremely urgent and important to carry out urban flood risk assessment.
Mapping urban flood risk and analyzing the impact of urbanization development on flood risk in Zhengzhou City is of great significance for improving the efficiency of flood event early warning and emergency relief.Risk management decision makers are aware of this change and consider the possible flood risks of urban construction in urban development planning.In this study, the main objective is to construct a multi-index flood risk assessment system, considering the impact of rapid urbanization on flood risk, and to map the spatial and temporal distribution of flood risk in Zhengzhou City in 2000, 2005, 2010, 2015, and 2020.We also analysis the trends of future flood development and influencing factors in Zhengzhou City and provide scientific suggestions for the urban flood management departments to make decision.
2.Methodology
2.1.Study area
Zhengzhou City (34°16′-34°58′N, 112°42′-114°14′E) is the capital of Henan Province, China and the central city of the Central Plains Urban Agglomeration in North China (Fig.1).Zhengzhou City covers an area of 7568.0 km2,with a high terrain in the southwest and a low terrain in the northeast.It has a temperate continental monsoon climate with an uneven spatial and temporal distribution of precipitation, cold winters with little snow and hot summers with a lot of rain.Its annual average rainfall is 625.0 mm and 64.10% of the annual rainfall during the flood season from June to September (Zhang et al., 2021).The spatial distribution of rainfall in Zhengzhou City shows the characteristics of more in the north and less in the east.From 17 to 22 July 2021, one of the centers of extreme heavy rainfall in Henan Province was in Zhengzhou City, and the amount of rainfall in Zhengzhou City was even as high as 201.9 mm during 16-17 h on 20 July, the highest in history (Liu et al., 2022).Zhengzhou City is economically developed and densely populated, with an urbanization rate of 79.01% and a GDP of 1.27×10¹²CNY in 2021.The urbanization process in Zhengzhou City has been steadily progressing and has a developing trend.As shown in Figure 2, the urbanization of Zhengzhou City had an obvious upward trend in 2010.The social and economic consequences of urban flooding are enormous in Zhengzhou City, and it is of great significance to use Zhengzhou City as the study area for flood risk assessment in this paper.
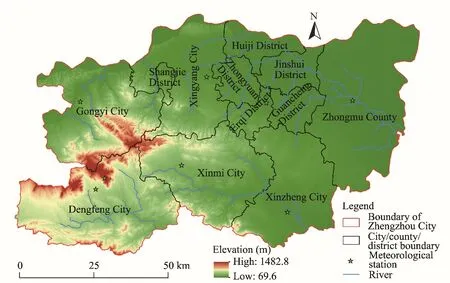
Fig.1.Location and physiographic information of Zhengzhou City.
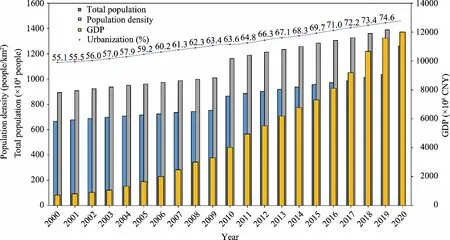
Fig.2.Development trends of population and GDP of Zhengzhou City from 2000 to 2020.
2.2.Methods
In this study, we adopted a GIS-based approach to urban flood risk assessment based on the risk triangle theory.The flood risk assessment framework constructed by this study consists of two parts: (1) a flood risk indicator system and (2) a GIS-based flood risk overlay analysis and mapping.Referring to the related research, the factors that affect the results of flood risk assessment are complex and diverse, and there are many index factors that can be used for flood risk assessment (Li et al., 2021).
In this paper, combined with the actual physical geography and social conditions of the study area, the index system is constructed from three aspects: hazard, vulnerability, and exposure (Fig.3).Hazard index includes two indicators:average annual rainfall and distance to river; vulnerability index includes three indicators: population density, GDP,and land use/land cover (LULC); and exposure index includes three indicators: elevation, slope, and Normalized Difference Vegetation Index (NDVI).
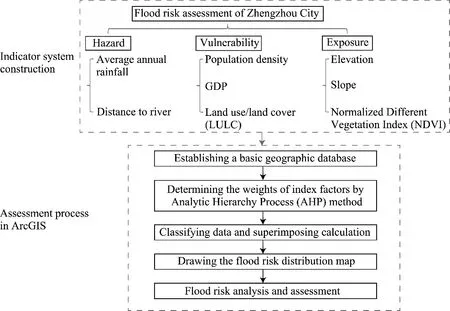
Fig.3.Flood risk assessment framework for Zhengzhou City.
whereRiskrefers to the urban flood risk;wH,wV, andwEare the weight values of hazard, vulnerability, and exposure,respectively;hi,vi, andeiare the weight values of theithindicator factor of hazard, vulnerability, and exposure,respectively;Hi,Vi, andEiare theithindicator factor of hazard, vulnerability, and exposure, respectively; andl,m,andorepresents the number of indicator factors of hazard, vulnerability, and exposure, respectively.
The Jenks Nature Breaks Classification Method is based on the numerical statistical distribution law for grading and classification, which is widely used in drought and flood risk level zoning.It can enhance the robustness of the model and make the nonlinear relationship among the flood risk indicators more moderate.In this paper, we used the Jenks Nature Breaks Classification Method for flood risk assessment based on GIS software and classified the urban flood risk level into five categories: very high, high, medium, low, and very low.
In the 1970s, American operations research experts proposed the Analytic Hierarchy Process (AHP), which is a multi-level weight analysis decision-making method and a combination of qualitative and quantitative system analysis(Saaty, 1977; Kazakis et al., 2015).Using the AHP to determine the weight of indicators includes the following four calculation steps: (1) establishing the hierarchical structure model; (2) constructing the judgment matrix (Tables 1-4); (3) calculating the weight values of indicators (Table 5); and (4) conducting the consistency test.When consistency ratio (CR)<0.100, it can be considered that the judgment matrix passes the consistency test and the weight values are reasonable and reliable (Ghosh and Kar, 2018; Radwan et al., 2019); otherwise, the consistency test needs to be conducted again.In this study, the flood risk assessment system includes the object layer, index layer, and indicator layer.
where CI is the consistency index;λmaxis the maximum eigenvalue of the judgment matrix; andnis the order of the judgment matrix.when CI=0.000, it means perfect agreement.The larger the CI, the more inconsistent the judgement matrix.
By checking the random consistency table, we can get the average random consistency index, i.e., ratio index (RI).
where CR is the consistency ratio of judgment matrix.If the consistency ratio is less than 0.100, it indicates that the test has passed; otherwise, the comparison matrix needs to be reconstructed.

Table 1Judgment matrix of hazard index in the urban flood risk assessment system of Zhengzhou City.

Table 2Judgment matrix of vulnerability index in the urban flood risk assessment system of Zhengzhou City.
2.3.Data sources and processing
In multi-index flood risk assessment process, the selection of indicator factors is the key step.In this paper, the selection of indicator factors is based on the principles of data reliability, objectivity, and ease of spatial processing,and the consideration of the actual situation in the study area and the research focus of this study.Table 6 shows the data sources of the eight indicator factors in this study, i.e., average annual rainfall, distance to river, elevation, slope,NDVI, population density, GDP, and LULC (Table 3).

Table 3Judgment matrix of exposure index in the urban flood risk assessment system of Zhengzhou City.

Table 4Judgment matrix of quasi-survey layer in the urban flood risk assessment system of Zhengzhou City.

Table 5Weight of each indicator and index in the urban flood risk assessment system of Zhengzhou City.
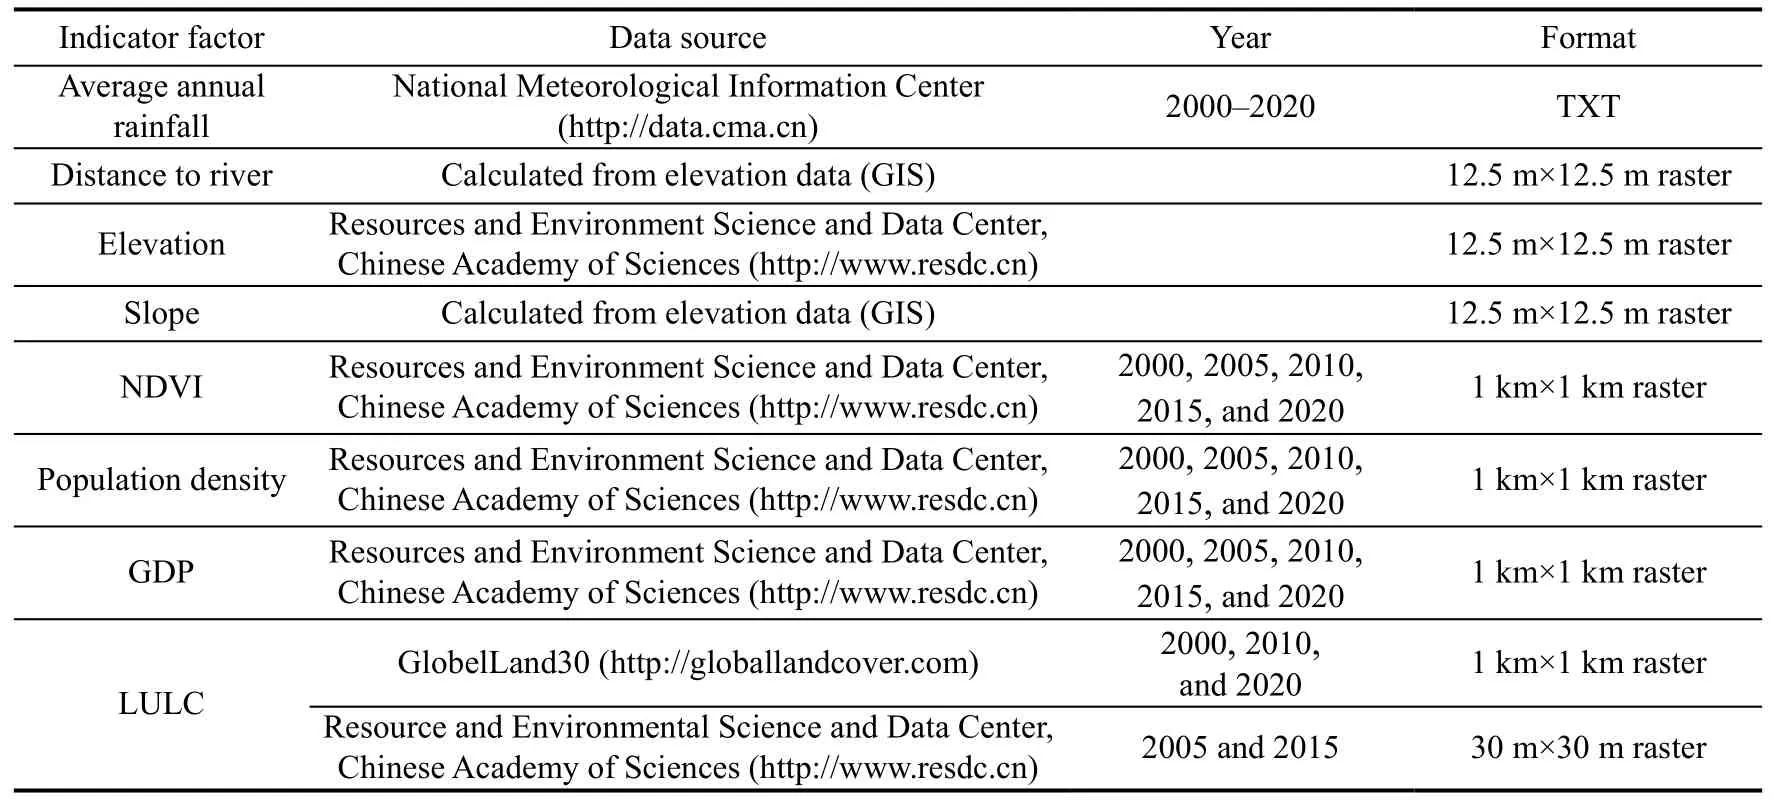
Table 6Detailed information of each indicator factor in the urban flood risk assessment system of Zhengzhou City.
2.3.1.Average annual rainfall
There are many risk factors in urban flood risk assessment.Rainfall is one of the most direct and important hazard factors in flood risk assessment, and the intensity and frequency of rainfall have a direct impact on flooding (Kumar et al., 2021).In this study, we selected average annual rainfall as one of the hazard factors in urban flood risk assessment.The rainfall is the annual average of 20 years of rainfall data since 2000, using Kriging interpolation method (Fig.4).
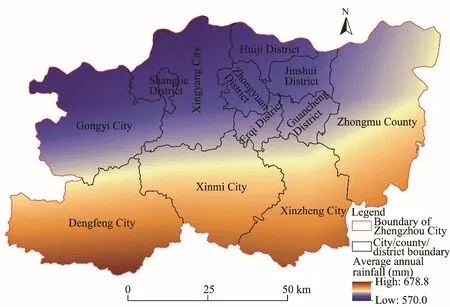
Fig.4.Spatial distribution of average rainfall in Zhengzhou City.
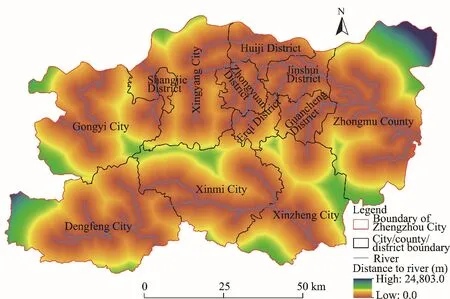
Fig.5.Distribution of distance to river in Zhengzhou City.
2.3.2.Distance to river
The floodplain areas on both sides of the river are vulnerable to flood hazards.When heavy rainfall occurs, the water level of rivers rises and overflows to the floodplains on both sides of river.Distance to river is also one of hazard factors that should be considered in the flood risk analysis and assessment of Zhengzhou City.In this study,we calculated the spatial distribution of distance to river within the study area by the Euclidean distance method in the GIS tool.The range of distance to river in this study is 0.0-24,803.0 m as shown in Figure 5.
2.3.3.Elevation
Elevation is the distance from a point on the ground in the direction of plumb line to the geoid.China uses the multi-year mean sea level of the Yellow Sea as the datum for absolute elevation.The lower the elevation, the more likely it is that water will accumulate in the event of a flood, and the higher the flood risk level.In this paper, a digital elevation model with a resolution of 12.5 m×12.5 m was chosen for the urban flood risk analysis, with an elevation range of 69.6-1482.8 m (Fig.6).
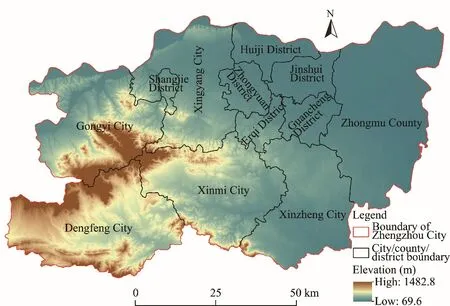
Fig.6.Spatial distribution of elevation in Zhengzhou City.
2.3.4.Slope
Slope is used to indicate the degree of steepness of a surface unit and is the ratio of the vertical height of the slope to the distance in the horizontal direction.Slope is an important factor affecting flooding.In this study, the slope factor was obtained by analyzing digital elevation model (DEM) data using GIS.Areas with gentle slope have slow surface water flow, so they are prone to ponding and have higher flood risk level.In this paper, the grade range of slope in the study area is 0.0°-70.0° (Fig.7).
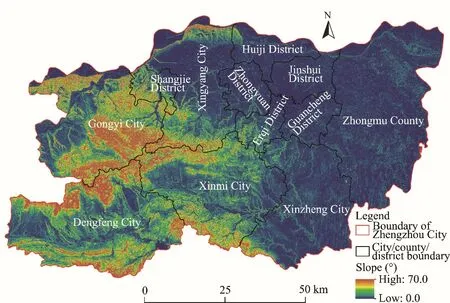
Fig.7.Spatial distribute of slope in Zhengzhou City.
2.3.5.Normalized Difference Vegetation Index(NDVI)
Vegetation cover is usually defined as the ratio of forest area to total land area.In this study, NDVI is used to reflect the surface vegetation coverage.Vegetation plays an important role in intercepting precipitation, increasing infiltration, and slowing down surface flow velocity.With the development of urbanization, urban built-up areas continue expanding outward, and the NDVI in Zhengzhou City continues decreasing (Fig.8).
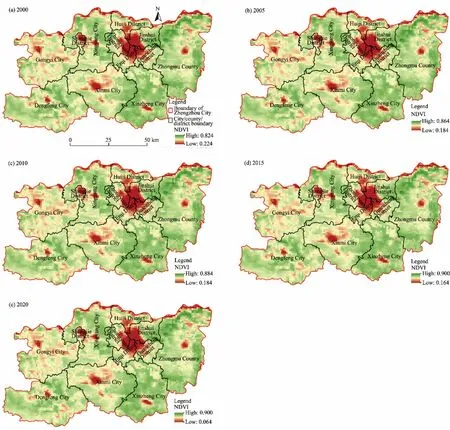
Fig.8.Spatiotemporal distribution of vegetation cover (indicated by NDVI) in Zhengzhou City in 2000 (a), 2005 (b),2010 (c), 2015 (d), and 2020 (e).

Fig.9.Spatiotemporal distribution of population density in Zhengzhou City in 2000 (a), 2005 (b), 2010 (c), 2015 (d),and 2020 (e).
2.3.6.Population density
In the event of a flood, the safety of people’s lives is the most importance.In China, with accelerated urbanization process, urban population density is increasing, making people vulnerable in the event of a flood.The population change and distribution in Zhengzhou City from 2000 to 2020 is shown in Figure 9.
2.3.7.GDP
GDP is the final result of the production activities carried out by resident units of a country or region in a certain period of time.It is one of the most important indicators of socio-economic development, regional planning, and resource environmental protection.Floods of the same scale cause more significant damage in economically developed areas.From 2000 to 2020, the GDP of Zhengzhou City has grown by leaps and bounds (Fig.10).
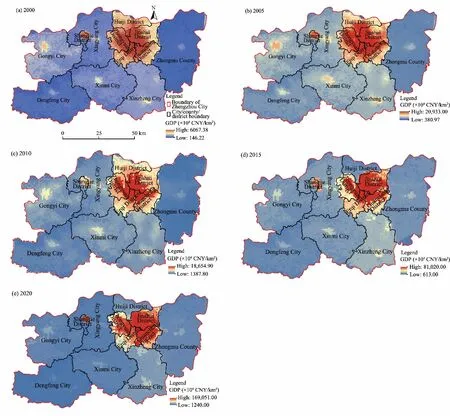
Fig.10.Spatiotemporal distribution of GDP in Zhengzhou City in 2000 (a), 2005 (b), 2010 (c), 2015 (d), and 2020(e).
2.3.8.Land use/land cover(LULC)
The type of land use affects the rainfall runoff process.For built-up areas, large amount of hardened ground increase impervious area and reduce infiltration, resulting in more surface water accumulation during rainfall.LULC is also one of the most important factors affecting flooding.The LULC of Zhengzhou City includes six types: farmland,forest, grassland, wetland, water body, and urban land (Fig.11).
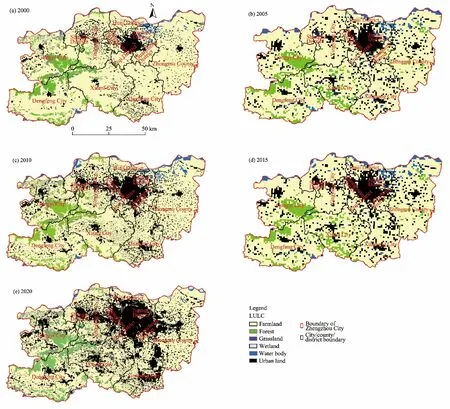
Fig.11.Spatiotemporal distribution of LULC in Zhengzhou City in 2000 (a), 2005 (b), 2010 (c), 2015 (d), and 2020(e).Due to the different data sources and resolutions (Table 6), the images of 2000, 2010, and 2020 were distinguished with the images of 2005 and 2015.
3.Results
3.1. Hazard assessment
Hazard factors are the most direct factors that cause flood disaster, and they account for a large proportion of the flood risk assessment.In this paper, the average annual rainfall and distance to river were selected as the main hazard factors.Considering that the rainfall change was not significant and the change of river location was small in Zhengzhou City during 2000-2020, it is assumed that the hazard index does not change with time in this paper (Fig.12).According to the analysis results, the rainfall in Zhengzhou City shows a pattern of uneven spatial distribution from north to south (Fig.4).Due to the high rainfall level and accompanied by several rivers, the southern areas of Dengfeng City, Xinmi City, and Xinzheng City are the highest flood risk zones in Zhengzhou City (Fig.12).
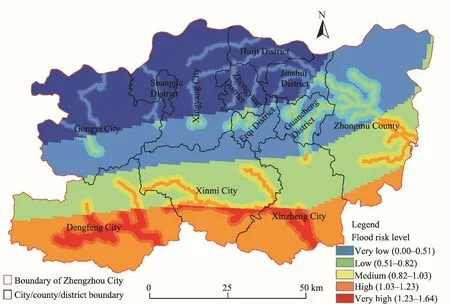
Fig.12.Hazard-wised flood risk spatial distribution of Zhengzhou City.
3.2. Vulnerability assessment
In this study, we chose elevation, slope, and NDVI indicators to analysis vulnerability index of urban flood risk assessment.The northeastern area of Zhengzhou City, including Jinshui District, Zhongyuan District, Erqi District,and Guancheng District, has low elevation and flat topography, leading to high flood risk.Over the past 20 years from 2000 to 2020, the NDVI has changed considerably in Zhengzhou City, thus affecting the vulnerability distribution in the study area.The general trend is that with the progress of urbanization, the area of very high flood risk gradually increases (Fig.13).The proportion of area with very high flood risk in Zhengzhou City was 7.257%, 7.913%,11.358%, 23.303%, and 44.006% in 2000, 2005, 2010, 2015, and 2020, respectively.
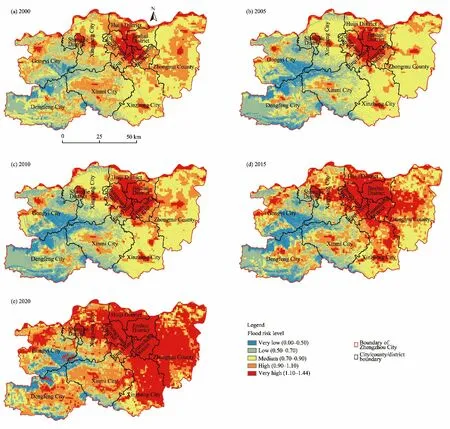
Fig.13.Vulnerability-wised flood risk spatiotemporal distribution of Zhengzhou City in 2000 (a), 2005 (b), 2010 (c),2015 (d), and 2020 (e).
3.3. Exposure assessment
In this study, we constructed the exposure index, including three indicators of population density, GDP, and LULC,to research its influence on urban flood risk.With the acceleration of urbanization, the increase of population and population density, and the rapid development of economy, the probability of human casualties and property losses will rise when urban flooding disaster occurs.With the progress of urbanization, the built-up area and the impermeable area of city are increasing sharply, which has an impact on the urban rainwater catchment.The infiltration of rainfall within the built-up area significantly reduced and the surface production flow increased.From 2000 to 2020, the area of very high flood risk and high flood risk zones increased in Zhengzhou City, and its proportion was 2.080%, 6.407%,7.027%, 8.119%, and 26.843% in 2000, 2005, 2010, 2015, and 2020, respectively (Fig.14).The main urban areas of Zhengzhou City (Zhongyuan District, Erqi District, Jinshui District, Guancheng District, and Huiji District) are densely populated, economically developed, and highly urbanized, and most of them are very high flood risk and high flood risk zones.
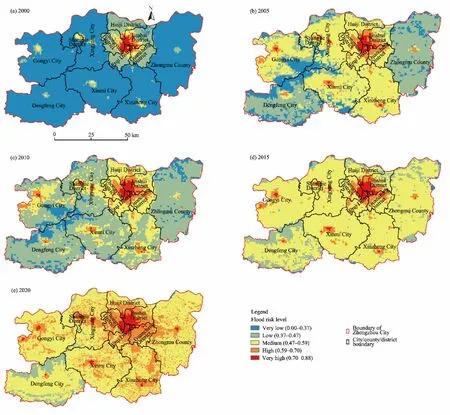
Fig.14.Exposure-wised flood risk spatiotemporal distribution of Zhengzhou City in 2000 (a), 2005 (b), 2010 (c),2015 (d), and 2020 (e).
3.4. Spatiotemporal variations in flood risk
After comprehensive superimposing of hazard, vulnerability, and exposure indexes, a flood risk distribution map with a spatial resolution of 30 m×30 m of Zhengzhou City was obtained.The flood risk was divided into five levels:very high risk, high risk, medium risk, low risk, and very low risk (Fig.15; Table 7).From the perspective of spatial distribution, very high flood risk zone and high flood risk zone are concentrated in the central city.The terrain in the city center, including Jinshui District, Zhongyuan District, Erqi District, and Guancheng District, is flat, the population and property in here are concentrated, the economy is developed, and the impervious area in here is large due to large built-up land (Fig.15).The southern of Zhengzhou City, including Dengfeng City, Xinmi City, and Xinzheng City, is also high flood risk concentration area, with high average annual rainfall and numerous rivers.From the perspective of temporal distribution, with the development of urbanization, the flood risk tends to increase and expand.The proportion of very high flood risk and high flood risk zones was 1.362%, 5.270%, 4.936%, 12.151%,and 24.236% in 2000, 2005, 2010, 2015, and 2020, respectively.

Table 7Area percentage of different flood risk levels in Zhengzhou City.
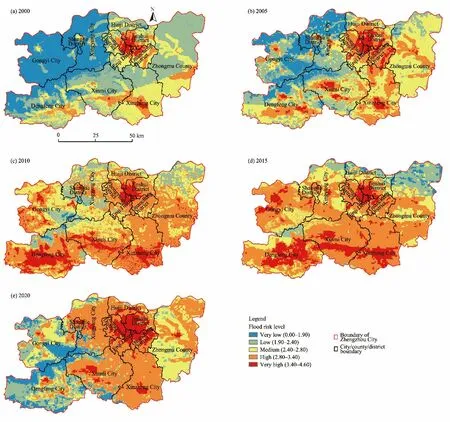
Fig.15.Spatiotemporal distribution of flood risk in Zhengzhou City in 2000 (a), 2005 (b), 2010 (c), 2015 (d), and 2020 (e).
From 2000 to 2020, the area of very high flood risk and high flood risk zones in Zhengzhou City had a trend of increasing and expanding, of which Dengfeng City, Xinzheng City, Xinmi City, and Zhongmu County had the fastest growth rate and the most obvious increase (Fig.16).After 2010, the area of very high flood risk andhigh flood risk zones has increased sharply, which has a great relationship with the high-speed urbanization development stage of Zhengzhou City start from 2010.Zhengzhou City experienced a rapid economic development, accelerated urban construction, dramatic increase in population density, and more concentrated property distribution during the past two decades.Due to the numerous population and prosperous economy nowadays, the occurrence of flooding in Zhengzhou City will bring huge social and economic losses.
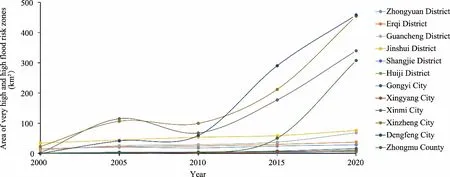
Fig.16.Changes of the area of very high flood risk and high flood risk zones of the 12 cities, county, and districts in Zhengzhou City from 2000 to 2020.
4.Discussion
Flood is one of the major disasters in China (Yu et al., 2022), which usually brings huge casualties and property losses.With the continuous advancement of China’s urbanization process, the impact of urban flood disasters has become more and more serious.The development of urban flood risk assessment can provide scientific basis for urban flood disaster prevention and mitigation.The comprehensive evaluation method of multi-index factors has a complete theoretical system and wide application, and has achieved fruitful results (Kia et al., 2012; Park and Won, 2019;Fariza et al., 2020; Pham et al., 2021).In this paper, the impact of urbanization development was innovatively considered, and the urban flood risk assessment was carried out with Zhengzhou City as the research area.The results showed that with the advancement of urbanization, the type of land use has changed significantly specifically, the area of impervious land has increased, and the areas of green space and water bodies have decreased during the past 20 years.With the increase of urban population and population density, the distribution of property became more concentrated, the proportion of area of very high flood risk and high flood risk zones has increased significantly, and the pressure of urban flood prevention and disaster mitigation has increased.
To verify the accuracy of the results of flood risk assessment got by this study, we compared and analyzed our results with existing literature.Feng (2020) conducted a study to assess the risk of flooding in Zhengzhou City based on remote sensing (RS) and GIS technologies, and the results showed that the high-flood-risk area of Zhengzhou City is mainly concentrated in the central downtown and southwestern of Zhengzhou City, which is basically consistent with the results of this paper.However, the results in this paper showed that the flood risk level in the southern part of Zhengzhou City is also higher, which is different from the results of Feng (2020), mainly due to the greater weight of distance to river indicator in this paper.Zhao et al.(2022) conducted a flood risk assessment of Zhengzhou City based on the improved entropy weight-Technique for Order Preference by Similarity to an Ideal Solution (TOPSIS)-grey correlation method, and the results showed that the high flood risk zones are mainly located in the Jinshui District,the eastern part of Zhongyuan District, the northeastern part of Erqi District, and the western part of the river network,which is also consistent with the results of flood risk assessment in this paper.Through comparative analysis with the results of previous studies, it is confirmed that the flood risk distribution of Zhengzhou City obtained by this study has a high degree of confidence, and the distribution range of high flood risk zones is basically consistent with the findings of existing studies.
There are also some challenges in applying this method.First, the issue of data acquisition and representation in the study area, researchers should get reliable and accurate rainfall, land use type, and socio-economic related population and property data.Second, the construction of the flood risk index system is highly subjective, and the flood risk influencing factors in different study areas are different; it is necessary to construct a scientific and reasonable flood risk assessment index system according to the actual physical geographical conditions.Third, this paper considers the impact factors of hazard, vulnerability, and exposure.However, with the continuous development and improvement of urban flood prevention and disaster mitigation system, the emergency rescue capabilities in the event of disasters are also important influencing factors, including the number of places for fire protection, medical treatment, and material reserve site, the intensity of publicity, and citizens’ self-help awareness and ability.
Both urban flood prevention engineering and non-engineering measures are important means for cities to cope with storm water flooding disasters.It is recommended to establish an engineering system for prevention and control of urban external and internal floodings, build a perfect urban drainage system, rainwater storage system and other drainage facilities, coordinate urban flooding and external flood control standards, strengthen urban flood risk management, planning, and construction, establish an efficient emergency management team, and prepare urban flood risk distribution map.
5.Conclusions
This paper proposed a comprehensive urban flood risk assessment method based on GIS and considered impact factors, including hazard, vulnerability, and exposure.Taking Zhengzhou City as the research area, we considered the impact of urbanization process on the flood risk and drawn flood risk distribution maps of 2000, 2005, 2010, 2015,and 2020 with a spatial resolution of 30 m×30 m to analysis the evolution law of flood risk in Zhengzhou City and locate the high flood risk zone, which can provide a scientific reference for urban flood prevention and disaster mitigation for Zhengzhou City in future.The main conclusions are as follows:
(1) The risk level of urban flooding in Zhengzhou City increased during 2000-2020.Comparing the flood risk distribution maps of 2000, 2005, 2010, 2015, and 2020, it can be observed that with the continuous advancement of urbanization, the flood risk has a trend of increasing and expanding in Zhengzhou City.
(2) The very high flood risk and high flood risk zones are mainly distributed in the central urban area in the northern part of Zhengzhou City and the areas close to rivers in the southern part of Zhengzhou City.The northern central urban area, which is economically developed, densely populated, and highly urbanized, belongs to high sensitivity of exposure index factor, while the southern area with heavy rainfall and adjacent to rivers belongs to high sensitivity of hazard index factor.
Authorship contribution statement
LI Guoyi: conceptualization, data curation, formal analysis, investigation, methodology, resources, software,validation, writing - original draft, and writing - review & editing; LIU Jiahong: methodology, software, project administration, and funding acquisition; and SHAO Weiwei: project administration and funding acquisition.
Declaration of competing interest
The authors declare that they have no known competing financial interests or personal relationships that could have appeared to influence the work reported in this paper.
Acknowledgements
This study was supported by the National Natural Science Foundation of China (52192671, 51979285) and the Research Fund of the State Key Laboratory of Simulation and Regulation of Water Cycle in River Basin(SKL2022TS11).
- 区域可持续发展(英文)的其它文章
- Measuring the agricultural sustainability of India: An application of Pressure-State-Response (PSR) model
- Impact of taxes on the 2030 Agenda for Sustainable Development: Evidence from Organization for Economic Cooperation and Development (OECD) countries
- Geotechnical and GIS-based environmental factors and vulnerability studies of the Okemesi landslide, Nigeria
- Environmental complaint insights through text mining based on the driver, pressure, state, impact, and response (DPSIR)framework: Evidence from an Italian environmental agency
- Expert elicitations of smallholder agroforestry practices in Seychelles: A SWOT-AHP analysis
- Examination of the poverty-environmental degradation nexus in Sub-Saharan Africa

