Adaptive Graph Embedding With Consistency and Specificity for Domain Adaptation
Shaohua Teng,,, Zefeng Zheng, Naiqi Wu,,, Luyao Teng, and Wei Zhang
Abstract—Domain adaptation (DA) aims to find a subspace,where the discrepancies between the source and target domains are reduced.Based on this subspace, the classifier trained by the labeled source samples can classify unlabeled target samples well.Existing approaches leverage Graph Embedding Learning to explore such a subspace.Unfortunately, due to 1) the interaction of the consistency and specificity between samples, and 2) the joint impact of the degenerated features and incorrect labels in the samples, the existing approaches might assign unsuitable similarity, which restricts their performance.In this paper, we propose an approach called adaptive graph embedding with consistency and specificity (AGE-CS) to cope with these issues.AGE-CS consists of two methods, i.e., graph embedding with consistency and specificity (GECS), and adaptive graph embedding (AGE).GECS jointly learns the similarity of samples under the geometric distance and semantic similarity metrics, while AGE adaptively adjusts the relative importance between the geometric distance and semantic similarity during the iterations.By AGE-CS,the neighborhood samples with the same label are rewarded,while the neighborhood samples with different labels are punished.As a result, compact structures are preserved, and advanced performance is achieved.Extensive experiments on five benchmark datasets demonstrate that the proposed method performs better than other Graph Embedding methods.
I.INTRODUCTION
A large amount of data from different domains is required to train a robust classification model.However, in some emerging target domains, only a small amount of labeled data is available, which is insufficient to learn critical classification knowledge.Moreover, it is time-consuming and costly to manually collect labeled data.In the light of these problems,domain adaptation (DA) is proposed to utilize labeled samples from a well-known domain (the source domain) to tag unlabeled samples from the emerging domain (the target domain) [1].Up to now, DA has been widely applied to various fields, e.g., infection detection [2], [3], disease detection[4], anomaly detection [5]–[7], emotion recognition [8], and visual localization [9].
The primary nature of DA is to learn a projected subspace,where the discrepancies between the source and target domains are reduced [1], [10].Based on a learned subspace,the classifier can properly classify the unlabeled target samples by utilizing the source knowledge.
Recently, some researchers adopt local structure preservation to align the distributions [11]–[13].These methods construct a similarity matrix by measuring the geometric distance of samples, so as to preserve a local structure of the domains.However, here are still two issues to be addressed.
1)The Existing Methods Neglect the Interactions of the Consistency and Specificity Between Samples: The consistency denotes the common properties between samples, while specificity denotes specific properties of different samples.For example, the same category and common features of two samples might contribute to their consistency, while different categories and specific features of two samples might contribute to their specificity.In this case, there exist four possible relationships between two samples: a) a number of common features with the same category; b) a number of common features with different categories; c) a number of specific features with the same category; and d) a number of specific features with different categories.
Since most existing works measure similarity by geometric distance,they might connect the samples a)and b)with larger weights,and the samples c)and d)with smaller weight.As a result, the samples b) and c) are weighted inappropriately, and performance is limited.As revealed by [14], the consistency degree of a system reflects whether the projection is reliable or not.The result of having low consistency makes the knowledge of a model more unstable, which is not what we want.In order to achieve high consistency, an improved strategy should be used to measure the consistency and specificity between samples appropriately.

Fig.1.The flow chart of AGE-CS.(a) GECS measures the similarity of samples by geometric distance; (b) GECS measures the similarity of samples by semantic similarity metric; (c) AGE adaptively adjusts the relative importance of the geometric distance and semantic similarity metric; (d) MMD minimizes the distribution; and (e) By using AGE-CS, the compact structural information of domains is preserved, while discrepancies between domains are reduced.As a result, the discriminative classification boundary is obtained and advanced performance is guaranteed.
2)The Existing Methods Overlook Noise Samples That Contain Degenerated Features or Incorrect Labels: In reality,there exist some samples with degenerated features [15] or incorrect labels [16].These samples might mislead the similarity learning such that the local structure of domains cannot be well-preserved.
In light of the above two issues, one promising approach is to measure the similarity by the geometric distance and semantic information appropriately.However, it faces two challenges:
1)How can we unify the geometric distance and semantic similarity metrics to get a unified similarity?
2)How can we measure the relative importance between the geometric distance and semantic similarity metric,and adaptively adjust them?
In this paper, we address the above two issues, and introduce a novel method called adaptive graph embedding with consistency and specificity (AGE-CS).AGE-CS is composed of two parts: a) Graph embedding with consistency and specificity (GECS); and b) Adaptive graph embedding (AGE).
GECS adopts both the geometric distance and semantic similarity metrics to learn a similarity.In doing so, the neighborhood samples with same labels are rewarded, while the neighborhood samples with different labels are penalized.As a result, the consistency and specificity between samples are jointly measured, and promising performance is guaranteed.
AGE explores the potential relationship between geometry and semantics, and adaptively adjusts their weight based on the theoretical guarantee.By adopting AGE, the relative importance of the geometric distance and the semantic similarity metric is demonstrated.Hence, the structural information of two domains is preserved and advanced performance is achieved.
The contributions of this paper are as follows and the flowchart of AGE-CS is shown in Fig.1.
1) AGE-CS is proposed, which consists of GECS and AGE.By AGE-CS, the compact structural information of domains is preserved, while the discrepancies between domains are reduced.As a result, advanced performance is achieved.
2) GECS jointly determines the similarity of samples under the geometric distance and semantic similarity metrics.Consequently, the neighborhood samples with same labels are rewarded, while the neighborhood samples with different labels are penalized.
3) AGE adaptively adjusts the relative importance between geometry and semantics, which results in compact structure preservation.
4) Extensive experiments and comparisons on five popular datasets are performed to demonstrate the effectiveness of the proposed method.
II.RELATED WORK
In this section, we present a brief review of Graph Embedding methods, which can be divided into two categories, i.e.,geometry-based graph embedding (GGE) methods [17]–[21]and semantics-guided graph embedding (SGE) methods [12],[13], [22]–[25].Interested readers can refer to the surveys [10]and [1] to gain a comprehensive perspective on DA methods.
As one of the categories, approaches with geometry-based graph embedding (GGE) assign the neighborhood relationship by feature matching and measure the similarity of samples by geometric distance.Liuet al.jointly adopt local and global GGE methods to explore the discriminative manifold structure of multi-source domains [17].They hold the view that the distance between samples in the same domains is smaller than that in different domains.Thus, intra-class-andinter-class-based GGE methods are proposed, and good performance is achieved on multi-source transfer tasks.Wanget al.propose manifold embedded distribution alignment(MEDA) that utilizes GGE to preserve the geometric structure of the learned manifold [18].In MEDA, samples are projected into the manifold subspace, and their geometrical structures are explored simultaneously.As a result, MEDA avoids degenerated feature transformation and achieves promising performance.In addition, Vasconet al.apply an affinity matrix to convey the similarity of domains [19].Since they propagate the similarity between the labels directly, the target labels are obtained effectively.Moreover, Xiaoet al.leverage both low-rank representation and GGE to preserve the structural relationships of samples [20].They jointly explore the discriminative features of samples and label information.With the help ofτ-technology, a linear regression classifier is achieved and the geometric structure is mined.Differently,Sunet al.jointly utilize the maximum mean discrepancy(MMD), manifold learning, and scatter preservation to learn discriminative and domain-invariant features [21].During training, semantics and features are incorporated into a latent example-class matrix, and the geometrical information is explored on the latent space.With experiments, they verify the effectiveness of GGE.
As the other category, semantics-guided graph embedding (SGE) methods assign the neighborhood relationship by semantic mapping and measure the similarity of samples by a geometric metric.If all samples are connected, SGE is equivalent to the scatter component analysis (SCA) [26].Liet al.propose domain invariant and class discriminative (DICD)that jointly adopts within-class and between-class scatters to learn domain-invariant features [22].Since both intra-class and inter-class SGE methods are employed, DICD digs out the discriminative information sufficiently and achieves compact clusters.Liet al.embed SGE into a coupled projection learning framework [23].The distributions, scatters, and semantics are jointly leveraged, and a more feasible solution is gained by solving two coupled projection matrices.Gholenji and Tahmoresnezhad adopt both distribution alignment and discriminative manifold learning methods to exploit statistical, local,and global structures [13].Different from DICD, Gholenjiet al.introduce repulsive terms to align cross-domain distributions, which leads to consistent representation.However, since additional constraints are involved, this method requires more training time.Zhaoet al.use density peak landmark selection(DPLS) and manifold learning to mine the potential structural information of domains [24].In this way, samples are wellmeasured according to global density.By DPLS, the reliable samples are selected and the geometric structures are further explored by these high-quality samples.In experiments, they verify its significant improvements.Menget al.jointly preserve the marginal and local structures to obtain discriminant information and propose margin and locality structure preservation [12].Different from SPDA, it focuses on exploring consistent and inconsistent information, which exhibits promising performance in the few-shot setting.Liet al.propose Label Correction to align the distribution shift caused by the target pseudo labels [25].Based on the SGE method, they divide the optimization process into two stages.At the first stage, they align the distributions by minimizing marginal and conditional distributions.Then, they correct the target pseudo labels so as to further align the distributions.Since distributions are well-measured on these two stages, their method achieves significant performance.However, it takes more time to align the distributions.
Although the above-mentioned methods achieve promising improvements, they not only neglect the interactions of the consistency and specificity between samples, but also do not consider noise samples.As a result, further research is necessary.
Different from the previous works, in light of the unsolved problems, in this paper, we measure the similarity under both geometric distance and semantic similarity.The differences between the proposal and previous works are two folds.
1) We propose GECS to measure the similarity of samples from both geometric distance and semantic similarity perspectives, while the afore-mentioned studies cope with one of them only.By using GECS, the consistent and specific properties of domains are further explored and performance is improved.
2) We propose AGE to adaptively measure the relative importance between geometry and semantics.A mathematical analysis of the optimal parameter is given (refer to Theorem 1)and the transfer performance is guaranteed.To our best knowledge, there is no relevant study that reveals the relative importance between geometry and semantics mathematically.
III.PROPOSED METHOD
This section introduces AGE-CS in detail.First, we give the notations used in this paper and the problem setting.Then, the conventional methods and their drawbacks are reviewed.Next, the proposed GECS and AGE are discussed.At last, the overall objective function and its optimization procedure are given.
A. Notations and Problem Setting


TABLE I THE NOTATIONS
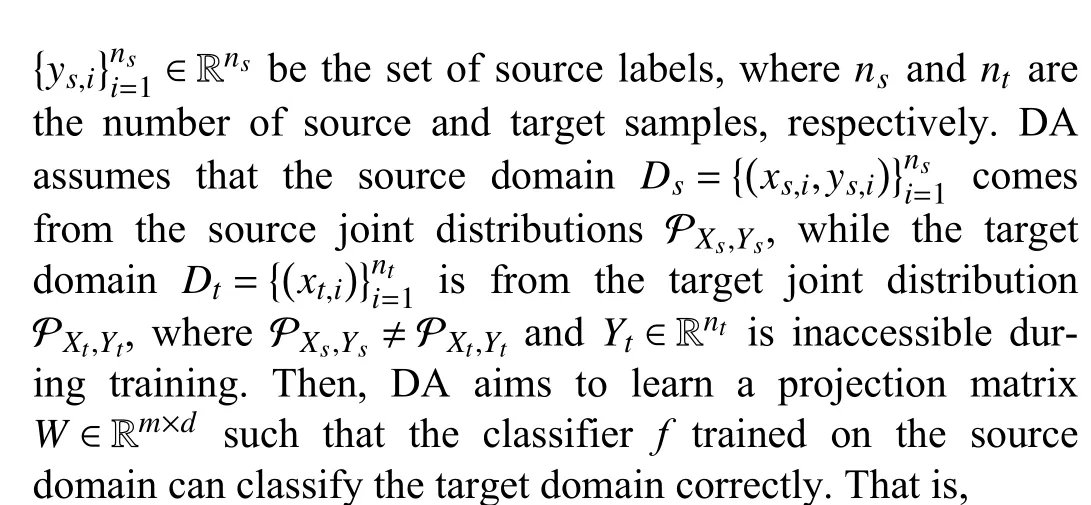
where L(A,B) is a loss function that measures the loss betweenAandB,f(X) is the classifier trained on feature spaceX, andYtis the set of ground-truth labels ofXt, which is inaccessible during training.
B. Distribution Alignment and Graph Embedding
In this subsection, we review conventional methods and point out two existing problems.
In order to reduce the discrepancies between two domains,the usual practice is to reduce the marginal and conditional distributions between the two domains [27].That is,
where

5)μis a hyper-parameter.
However, by adopting (2), the discrepancies between the two domains might still be large, which degrades performance.Hence, the local connectivity of each domain is explored by using Graph Embedding as follows.

where γ is a parameter to be learned.
Remark 1: It is worth noting that Definition 1 is slightly different from the conventional one [28].However, Definition 1 unifies the definitions used in DA [12], [19], [21], [25],[28]–[30] by the following three updated strategies:
a)Sis given by graph mapping and is fixed during the optimization process [12], [19], [21], [28], [29], [31].In this case,two factors need to be ensured: reliable semantic mapping and accurate feature measurement;
b)Sis given by graph mapping and is updated during the optimization process [30], [32].In this case, three factors need to be ensured: reliable semantic mapping, accurate feature measurement, and reliable information extraction in the iterative process;
c)Sis learned according to its constraints during the optimization process [25].In this case, four factors should be guaranteed: reliable semantic mapping, accurate feature measurement, reliable information extraction in the iterative process, and stable convergence.
Remark 2: Since strategy c) is more challenging than strategies a) and b), in this paper, we discuss GE with strategy c).The methods that apply the above strategies are compared in the experiments.
Based on (3), we simultaneously reduce the discrepancies between the domains and explore the local structures of the source and target domains by (4).That is,
whereSs={(ss)i,j,1 ≤i,j≤ns}∈Rns×nsandSt={(st)i,j,1 ≤i,j≤nt}∈Rnt×ntare the similarity matrices of the source and target domains, respectively.
With the above actions, the geometric structures of the two domains are explored and the discrepancies between the two domains are reduced.As a result, joint knowledge of the features is learned and good performance is obtained.
Unfortunately, there are still two factors that might hinder the performance:
1)The Interactions of the Consistency and Specificity Between Samples: In (4), the similarity matricesSsandStare formed bymeasuringthegeometric distances on thesubspaceWT X, respectively.However,these actions cannotbeperformed in these two mentioned situations, i.e., a) two samples share a number of common features in different categories;and b) two samples share a number of specific features in the same category.
2)The Samples With Degenerated Features in the Two Domains: There might exist some samples with degenerated featuresinthetwo domains [15],whichdistortsthesubspace learning.Ifthe learnedfeature spaceWT Xisdistorted, the similarity of samples might be wrongly measured and performance is hindered.
For these problems, we propose GECS in the next subsection.
C. Graph Embedding With Consistency and Specificity
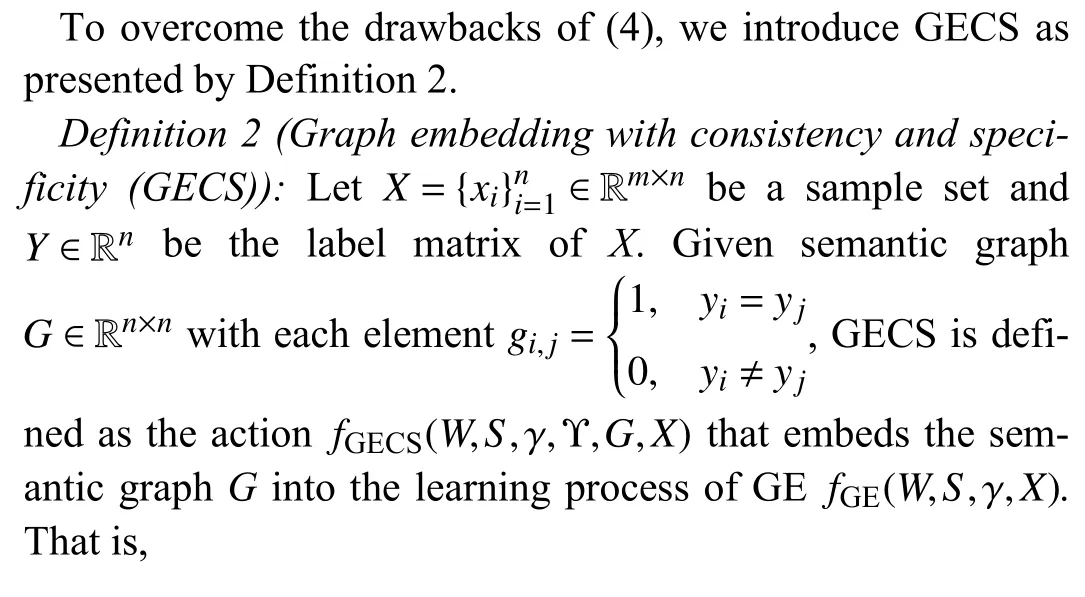
By (5), the objective function given by (4) is modified to
where
1)Gs∈Rns×nsandGt∈Rnt×ntare the semantic graph of the source and target domains with each element
and
2)Υs∈Rns×nsand Υt∈Rnt×ntare matrices of hyper-parameters of the source and target domains, respectively, i.e.,
and
With these actions, two advantages are obtained:
1)GECS Compensates for Inappropriate Assignment Caused by the Geometric Distance: Due to the interaction of the consistency and specificity between samples, the neighborhood samples with different labels might be connected with a large weight, which breaks the concept of similarity learning.By introducing GECS, the neighborhood samples with the same label are rewarded, while the neighborhood samples with different labels are punished.By doing so, the similarity is jointly measured.
2)GECS Reduces the Impact of Noise Samples: Since (4)measures the similarity by the geometric distance, it might be affected by samples with degenerated features.In (6), GECS embeds the semantic information into the similarity learning and jointly measures the similarity, which corrects the inappropriate measurement caused by noise samples.
As a result, the similarities are remeasured under both geometric distance and semantic similarity metrics, and a compact structure is guaranteed.Apart from the promising performance of GECS, another problem catches our attention:Determine how to measure the relative importance between the geometric distance and semantic similarity of each sample.
Due to the involvement of the semantic graphsGsandGt,the strategy proposed in [33], [34] does not work.In this case,further work should be done.In the next subsection, we propose AGE to adaptively adjust the hyper-parameters of GECS.
D. Adaptive Graph Embedding
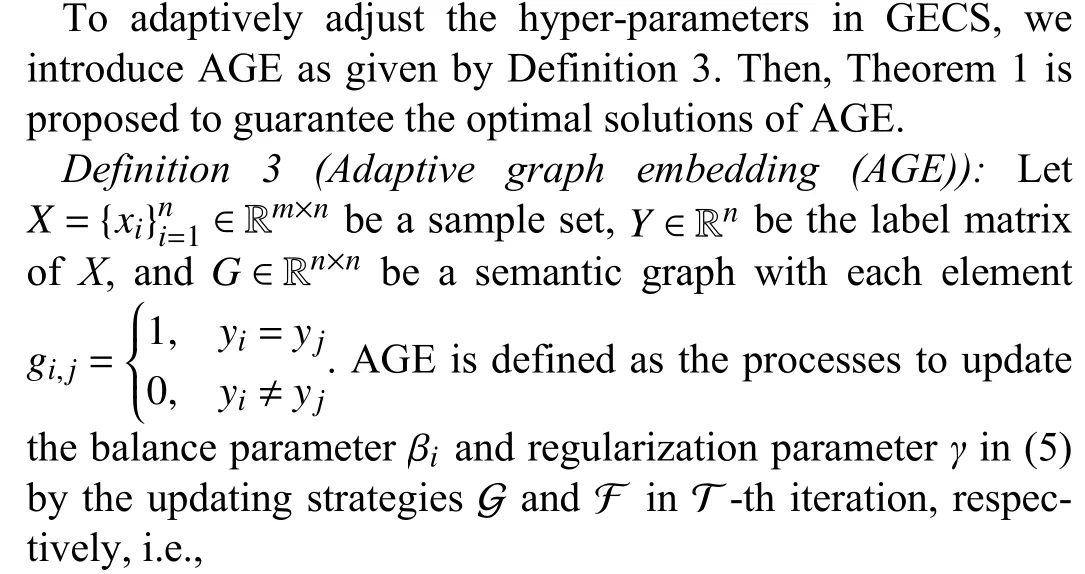

E. Overall Objective Function
In this subsection, we give the objective function of AGECS.By bringing (2) and (5) to (6), the objective function of the proposed method can be written in a matrix form as


F. Optimization Process
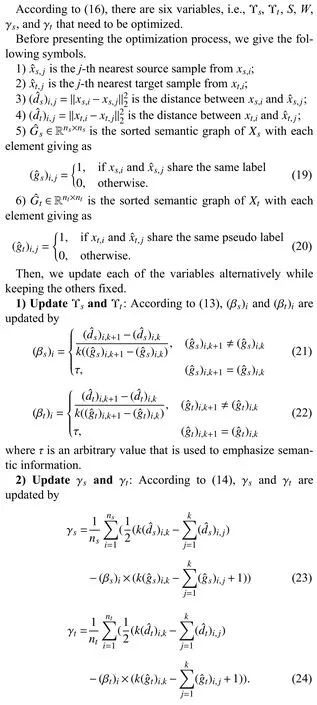
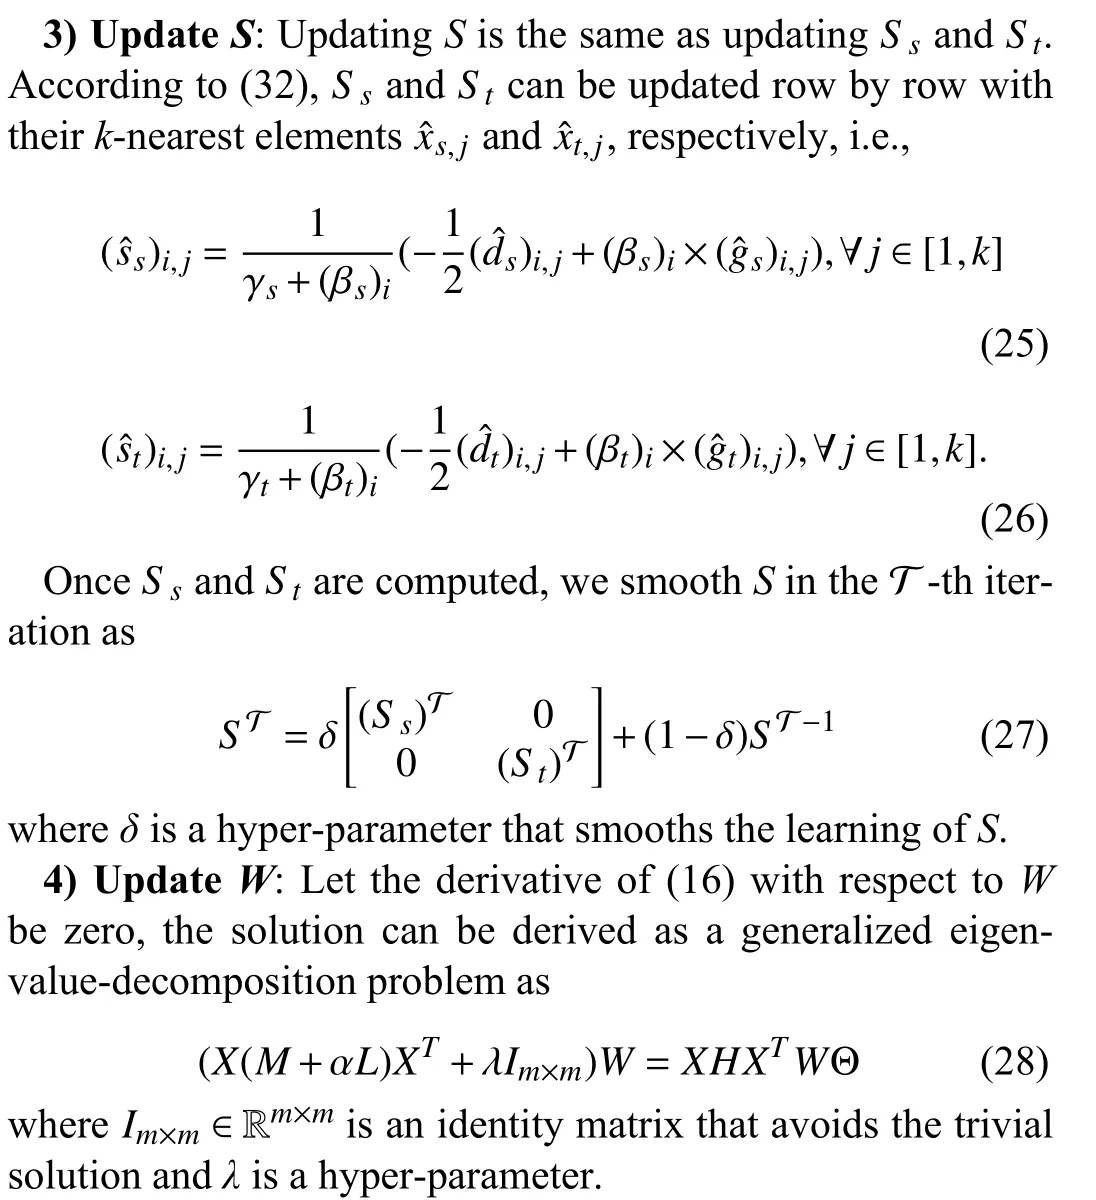
For a better illustration, we summarize the algorithm procedure as shown in Algorithm 1.

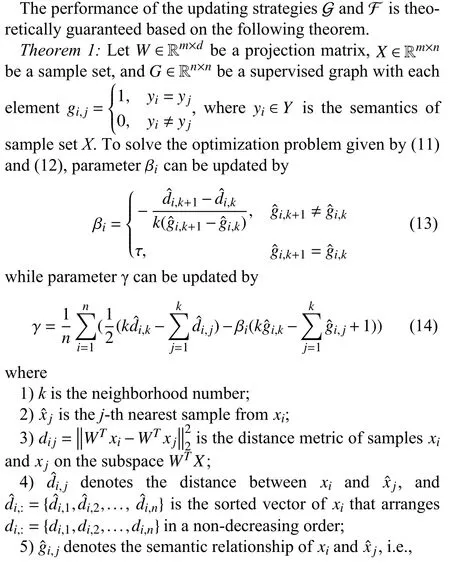
Algorithm 1 Adaptive Graph Embedding With Consistency and Specificity (AGE-CS)Input: and : the source and target samples;Ys Xs Xt: the source label;d: the dimensionality of the projection subspace;α,λ,δ,k,τ: the hyper-parameters;T: the number of iterations;Output: W: the projection matrix;ˆYt Xt: the pseudo label matrix for target samples~T =0S =0 Initialize ; ;ˆYt Xs Xt Initialize pseudo label by training and ;while: do~T ←~T+1;1)~T TABLE II OVERVIEW OF THE DATASETS AssumeTis the number of iterations, and the overall complexity of AGE-CS is In this section, we first describe the five involved datasets and the experimental settings.Then, comparison experiments with other popular algorithms are given.Moreover, the parameter sensitivity, convergence analysis, and ablation experiments of AGE-CS are evaluated.For the sake of reproduction,the source codes for the experiments are released at https://github.com/zzf495/AGE-CS.Besides, we introduce a promising repository that implements some of the shallow domain adaptation methods at https://github.com/zzf495/Re-implementations-of-SDA. In this paper, we adopt five widely used databases for experiments, including Office+Caltech10, Office31, Office-Home, ImgeCLEF-DA, and COIL20.The overview of the datasets are shown in Table II and the details are as follows. Office+Caltech10 [35] is a commonly used dataset in shallow transfer learning.It includes four sub-domains, i.e., A(Amazon), W (Webcam), C (Caltech), and D (DSLR).The number of images for Amazon, Webcam, Caltech, and DSLR is 958, 295, 1123, and 157, respectively, with each domain containing 10 classes.In the experiments, we use the SURF features extracted by [35], where the images with 800-bin histograms are trained and encoded.Interested readers can refer to [35] for details of data processing.12 cross-domain tasks,e.g., A →D, A →W, A →C,..., and C →W are conducted for comparisons. Office31 [36] is composed of three sub-domains, i.e., Amazon (A), DSLR (D), and Webcam (W).The dataset is formed from 4110 images of objects in 31 common categories.Its sub-domains are composed of online e-commerce pictures,high-resolution pictures, and low-resolution pictures, respectively.In the experiments, features with 2048 dimensions are extracted by using ResNet50 and six tasks are formed, i.e.,A →D, A →W,..., W →D. Office-Home [37] contains 65 kinds of different objects with 30 475 original samples and is composed of four subdomains: Art (Ar), Clipart (Cl), Product (Pr), and Real-World(Re).The sizes of these sub-domains are 2427, 4365, 4439,and 4357, respectively.In the experiments, we use ResNet50 models to extract the features and conduct 12 cross-domain tasks, i.e., A r →Cl, A r →Pr ,...,Re →Pr. ImageCLEF-DA includes three sub-domains, i.e., Caltech-256 (C), ImageNet ILSVRC2012(I), and Pascal VOC2012(P).Each domain contains 600 images of 12 categories with 2,048 dimensions.Following [32], six cross-domain tasks, i.e.,C →I, C →P,...,P →I, are performed in the experiments. COIL20 [38] consists of two domains, i.e., COIL1 and COIL2, with 1440 images in each domain.The dataset is formed by taking 75 images as the base and deriving new images every five degrees of rotation.COIL1 contains the images in [0◦,85◦]∪[180◦,265◦], while COIL2 contains the images in [90◦,175◦]∪[270◦,365◦].In the experiments, two cross-domain tasks are adopted, i.e., COIL1 → COIL2 and COIL2 → COIL1. For comparisons, seven state-of-the-art shallow transfer learning methods are introduced: Domain Invariant and Class Discriminative Feature Learning (DICD, 2018) [22] which jointly minimizes the marginal distribution, conditional distribution, and intra-class scatter, while maximizes the inter-class scatter. Easy Transfer Learning (EasyTL, 2019) [39] which utilizes intra-domain programming to exploit the intra-domain structures. Discriminative Joint Probability Maximum Mean Discrepancy (DJP-MMD, 2020) [40] which explores the transferability and discriminability of the domains under the independence assumption. Geometrical Preservation and Distribution Alignment(GPDA, 2021) [21] which jointly utilizes the maximum mean discrepancy (MMD), manifold learning, and scatter preservation to learn discriminative and domain-invariant features. Progressive Distribution Alignment Based on Label Correction (PDALC, 2021) [25] which adopts label correction to align the distribution shift caused by the target pseudo labels. Discriminant Geometrical and Statistical Alignment(DGSA, 2022) [24] which adopts density peak landmark selection and manifold learning to mine the potential structural information of the two domains. Incremental Confidence Samples into Classification(ICSC, 2022) [41] which improves DJP-MMD by progressively labeling and adaptive adjustment strategy.During iterations, the inappropriate estimations of the distributions as well as the pseudo labels are corrected. For fair comparisons, the best results from the original papers are cited for comparison.If the results for the datasetsare not available, we grid-search the hyper-parameters listed in the methods and report the best results.For the proposed method, we fixT=10, τ=10-3, and α=5.Then, we gridsearch the regularization parameterλin [0.01, 0.02, 0.05, 0.1,0.2, 0.5, 1, 2, 5, 10], the dimensiondin [10, 20, 30, 40, 50, 60,70, 80, 90, 100], the neighborhood numberkin [8, 10, 16, 32,64], and the smooth parameterδin [0.1, 0.2, 0.3, 0.4, 0.5, 0.6,0.7, 0.8, 0.9]. TABLE III CLASSIFICATION ACCURACIES (%) ON OFFICE+CALTECH10 (SURF) TABLE IV CLASSIFICATION ACCURACIES (%) ON OFFICE31 (RESNET50) The experimental results are shown in Tables III–VII, where A → C denotes that domain A is transferred to domain C.For easy viewing, the highest accuracies are shown in bold. Results on Office+Caltech10 (SURF): As shown in Table III,AGE-CS achieves 57.10% classification accuracy and outperforms all the compared methods in average.Compared with PDALC, AGE-CS achieves 1.77% improvement on average.Finally, AGE-CS achieves 64.75% classification accuracy on task A → W which is 10.15% higher than PDALC. Results on Office31 (ResNet50): The results are shown in Table IV.AGE-CS obtains 89.31% classification accuracy which is 3.24% higher than ICSC.Next, AGE-CS achieves 93.17% and 93.08% classification accuracy on tasks A → D and A → W, which is higher than ICSC by 5.37% and 5.28%,respectively.Four best performances out of six tasks are achieved by AGE-CS. Results on Office-Home (ResNet50): From Table V, AGECS achieves nine best performances with 69.66% classification accuracy.In the experiments, AGE-CS shows its competitiveness with PDALC, and achieves 0.66% improvement compared to PDALC. Results on ImageCLEF-DA (ResNet50): The results are shown in Table VI.AGE-CS, PDALC, and ISCS achieves 90.60%, 89.79%, and 88.83% classification accuracy, respectively.AGE-CS achieves 0.81% improvement compared to the PDALC and five best performances out of six tasks. Results on COIL20: As shown in Table VII, AGE-CS achieves 99.38% classification accuracy, while GPDA achieves 96.15% classification accuracy.Compared to PDALC and ICSC, AGE-CS achieves 6.67% and 9.38% average improvement, respectively. Based on the experimental observations, the following conclusions are given: 1) AGE-CS is effective.In the experiments, AGE-CS outperforms PDALC, ICSC, and GPDA, and achieves the best average performances on the five datasets.The promising results might be attributed to the effectiveness of the proposed adaptive supervision graph embedding method.In other words, AGE-CS appropriately measures the similarity between the samples of the two domains, and reduces the dis-crepancies of the two domains during the iteration.As a result,the appropriate data structure is learned, while the distributions are well-aligned. TABLE V CLASSIFICATION ACCURACIES (%) ON OFFICE-HOME (RESNET50) TABLE VI CLASSIFICATION ACCURACIES (%) ON IMAGECLEF-DA (RESNET50) TABLE VII CLASSIFICATION ACCURACIES (%) ON COIL20 2) AGE-CS is stable.In the experiments, some compared methods might lose their competitiveness for some specific datasets.For example, ICSC achieves 86.07% classification accuracy on Office31, while obtaining 90% classification accuracy on COIL.In contrast, AGE-CS achieves all the best performance on the involved datasets, which demonstrates that AGE-CS is considered to be comprehensive. The sensitivity of parameterα: As shown in Fig.2(a), t results show that classification accuracy increases with t increase ofα(α ≤5) , and decreases when α=10.Obviousl he he y,an appropriate value ofαcan facilitate the transfer of the two domains, but a large value ofαmight lead to large discrepancies.In this case, we propose to set α =5. The sensitivity of parameterλ: The results are shown in Fig.2(b).The change inλhas a bit of impact on classification accuracy.AGE-CS achieves the best performances when λ=0.1 on the Office+Caltech and λ=0.05 on the COIL.For the other datasets, the best performances are achieved when λ=0.01.With the above observations,λcan be set as 0.01 for most datasets, and changed for some specific tasks. The sensitivity of dimensiond: The results are shown in Fig.2(c).AGE-CS achieves the best performance whend=20 on COIL and ImageCLEF-DA,d=100 on Office31 and Office-Home, andd=60 on Office+Caltech10, respectively.Moreover, the performance becomes stable whend∈[30,100].Therefore, we can fixd=100 for most datasets and change it according to specific tasks. Fig.2.The sensitivity of hyper-parameters with respect to α, λ, d, and the convergence analysis of the iteration with respect to T. Convergence Analysis with respect to the number of iterationT: We fixT=20 and run AGE-CS to analyze the convergence of AGE-CS.For the observation purpose, the objective function values are recorded.As shown in Fig.2(d),the objective function value decreases with the increase in iteration.The results indicate that the proposed method has a good convergence property. In some emerging fields, there may not be any labels for the target domain, which makes the choice of hyper-parameters more difficult.As an empirical result of the ablation experiment, we letd=100, α=5, λ=0.1 (or 0.01),k=10, and σ=0.1, and verify the effectiveness of AGE-CS by some parameter-free metrics [42].Then, a series of heuristic search strategies [43] onλandσcan be conducted to achieve advanced performance, and be applied in big data scenarios. The ablation experiments are conducted on the five datasets.We fix GECS as the basic component, and add the combinations of the other two components to it.For simplicity, we denote the components: 1) maximum mean discrepancy(MMD); and 2) AGE.The results are shown in Table VIII,and the ablation methods of AGE-CS are as follows: ● GECS: the method that removes both MMD and AGE,and use GECS only; ● GECS+AGE: the method that uses GECS and AGE; ● GECS+MMD: the method that uses GECS and MMD; ● AGE-CS: the method that uses GECS, MMD, and AGE. TABLE VIII THE ABLATION STUDY OF AGE-CS ON FIVE DATASETS From the results of Table VIII, we can draw the following conclusions: a) MMD is important for transfer tasks.In the experiments,the results of GECS, GECS+MMD, and AGE-CS show that MMD is vital to the proper measurement of similarity.If the discrepancies between the two domains are large, AGE might fail to generate a compact similarity matrix.As a result, performance is degraded.In contrast, AGE-CS achieves better performance than GECS+MMD, with 2.31%, 1.42%, 0.62%,2.16%, and 7.5% improvements on Office+Caltech10,Office31, Office-Home, ImageCLEF-DA, and COIL, resepectively. b) AGE helps improve performance.The experimental results of GECS and GECS+AGE show that AGE promotes the integration of the two domains, and improves classification performance.Finally, by comparing GECS+AGE and AGE-CS, we find that MMD facilitates AGE to achieve the better performance, which confirms the significance of reducing the domain discrepancies. In this paper, we propose a method called adaptive graph embedding with consistency and specificity (AGE-CS) to address two problems of graph embedding.AGE-CS includes two parts: graph embedding with consistency and specificity(GECS), and adaptive graph embedding (AGE).GECS jointly learns the similarity of samples under the geometric distance and semantic similarity metrics, while AGE adaptively adjust the relative importance of them.By AGE-CS, compact structures are preserved while discrepancies are reduced.Both the experimental results conducted on five datasets and the ablation study verify the effectiveness of AGE-CS. Limitations: Although AGE-CS achieves promising results,there are three problems that need to be studied in depth: 1)Research on Adaptive Strategies: In this study, we propose Theorem 1 to adaptively tune the hyper-parameterβof semantic graphG.Although some promising results are achieved, the relative importance of distribution alignment and geometric structure is not well addressed.In reality, a parameter-free algorithm is more promising for broad applications.Hence, further studies on the latent relationship between constraints are required. 2)Research on Incomplete Data: Since AGE-CS measures the geometric and semantic distance effectively, it assumes that the data is complete.In reality, there are some domains with incomplete features.In this case, AGE-CS might not work well.A promising way is to complement this incomplete data with information from its nearest neighbors [44],which is left as our follow-up work. 3)Research on Effective Algorithm: Due to the serial nature of generalized eigen-decomposition problem, AGE-CS is difficult to extend as a parallel algorithm.In this case, an application of the gradient descent approach [45] may help AGECS solve this tricky problem. Proof of Theorem 1: Equation (5) can be written as ∀i∈[1,n], (29) can be further written in a vector form as where γiis the optimal parameter ofxiwith respect toγ. By introducing the Lagrangian operator, (30) can be solved by which indicates that the optimal solution ofsi,jis whereξis a constant that makessi,j≥0. For thek-nearest neighbor clustering, we havesi,k+1≤0.Therefore, By bringing (32) into (33), we get Hence, the value ofξis By combining (35) and (36), we get Let and Bringing (38) and (39) to (37), we obtain Obviously, when RHS1Right hand sideof γiis greater than LHS2Left hand sideof γi, the value of γimakes sense.Hence, βishould satisfy Inequality (42) indicates that βican be given as where ϵ is a very small positive number. Since limϵϵ=0, within the error tolerance, (43) indicates that the value of βican be given by where τ ∈R is an arbitrary value used to emphasize semantic information. When βiis learned, we can setγas same as [34].That is,G. Time Complexity


IV.EXPERIMENTS
A. Involved Datasets
B. Comparison Method
C. Experimental Setting


D. Comparison Experiments


E. Parameter Sensitivity and Convergence Analysis

F. Ablation Study

V.CONCLUSION
APPENDIX
 IEEE/CAA Journal of Automatica Sinica2023年11期
- IEEE/CAA Journal of Automatica Sinica的其它文章
- Multi-Objective Optimization for an Industrial Grinding and Classification Process Based on PBM and RSM
- Containment-Based Multiple PCC Voltage Regulation Strategy for Communication Link and Sensor Faults
- GraphCA: Learning From Graph Counterfactual Augmentation for Knowledge Tracing
- The ChatGPT After: Building Knowledge Factories for Knowledge Workers with Knowledge Automation
- An Optimal Control-Based Distributed Reinforcement Learning Framework for A Class of Non-Convex Objective Functionals of the Multi-Agent Network
- Can Digital Intelligence and Cyber-Physical-Social Systems Achieve Global Food Security and Sustainability?
