Decametric Solar Radio Spectrometer Based on 4-element Beamforming Array and Initial Observational Results
Shao-Jie Guo ,Guan-Nan Gao ,Fa-Xin Shen ,Feng-Hui Yang ,Liang Dong ,and Min Wang
1 Yunnan Observatories,Chinese Academy of Sciences,Kunming 650216,China;guosj891025@ynao.ac.cn
2 University of Chinese Academy of Sciences,Beijing 100049,China
3 Yunnan Key Laboratory of the Solar Physics and Space Science,Kunming 650216,China
4 Key Laboratory for the Structure and Evolution of Celestial Objects,Chinese Academy of Sciences,Kunming 650216,China
Abstract The dynamic spectral observation at decametric wavelength is important to study solar radio physics and space weather.However,the observing system is difficult to observe with high sensitivity at this band due to the fact that the system temperature is dominated by the sky background noise and the antenna is difficult to design with high gain.An effective solution to improve the sensitivity is constructing an antenna array based on the beamforming method.Accordingly,we develop a decametric solar radio spectrometer system based on a 4-element beamforming array.The system consists of four antennas,an 8-channel analog receiver and a digital receiver.We use the true time delay to implement the beamformer and the classical FFT method to perform spectrum analysis in the digital receiver.Operating at a frequency range of 25–65 MHz with dual-circular polarizations,the system provides high resolution dynamic spectrum with spectral resolution of ∼12 kHz and temporal resolution of ∼5.3 ms (typical).Tens of solar radio bursts have been observed successfully during the period of the trial observation,demonstrating the system’s ability to detect fine structures with high spectral and temporal resolution.In this article,we present the design,implementation,and initial observational results of the decametric solar radio spectrometer system in detail.
Key words: instrumentation: spectrographs– methods: observational– Sun: radio radiation– radiation: dynamics
1.Introduction
Solar radio bursts,associated with flares and corona mass ejections (CMEs),can carry valuable information about the magnetic field and plasma in the corona,which cover a frequency range of about tens of kHz to GHz.They were classified into five types (Type I,II,III,IV,and V) by Wild(1963).With the increasing of spectral and temporal resolution,many new fine structures were found continuously,such as spikes,type U bursts,fibers,and so on (Chernov et al.2014).The dynamic spectral observation of solar radio burst helps us to understand transient activities (such as flares and CMEs),as well as diagnose or constrain the magnetic field,and plasma parameters,such as temperature and density(Nakariakov et al.2014).Additionally,since solar radio bursts sometimes appear the rise phase of solar flare,they are important for forecasting and warning space weather (Cane &Reames 1988).Radio bursts of decametric wavelength correspond to the plasma emission from the higher corona,roughly about 1.5–3 solar radii.Since the Earth’s ionosphere limits ground-based observation,the decametric wavelength is a critical bridge between ground-based and space-based observation.Achieving high spectral and temporal resolution is crucial for dynamic spectral observation of solar radio bursts,Bastian et al.(2019)recommend a spectral resolution of at least 0.1% and a temporal resolution of at least 10 ms for current solar dynamic spectral observations.Table 1 lists some solar radio observing instruments operating at around decametric wavelength.

Table 1Parameters of Solar Radio Observing Instruments Operating Around Decametric Wavelength
Because the system temperature is dominated by the sky background noise and the antenna is difficult to design with high gain,the observing system is difficult to observe with high sensitivity at this band.To increase the effective receiving area and improve sensitivity,constructing an antenna array using beamforming methods has been shown to be an effective solution (Ellingson 2005).One example of a successful beamforming array for solar observation is the Gauribidanur Low-frequency Solar Spectrograph (GLOSS),which consists of eight log-periodic dipole antennas (LPDAs) (Kishore et al.2014).However,the analog beamforming method used by GLOSS is lack of flexibility and accuracy.Recently,the digital beamforming method has been widely used because of its flexibility and high accuracy.Beamformer can be implemented by applying phase shift or by using true time delay (Gunst &Bentum 2010).The phase shift is realized by multiplying the weight vector in the frequency domain,and the true time delay is realized by introducing the integral period delay and the fractional period delay in the time domain.For example,the Low Frequency Array (LOFAR,10–90 MHz and 110–240 MHz) applies phase shift to implement the beamformer at station level (de Vos et al.2009),while the Long Wavelength Array(LWA,10–88 MHz)uses true time delay at station level(Ellingson et al.2013).However,they are not instruments dedicated to solar radio observation.Two years ago,an observation instrument (25–110 MHz) dedicated to solar radio bursts was installed at the Chashan Solar Observatory (CSO)using the digital beamforming method with three LPDAs.It implements the beamformer by applying phase shift (Wang et al.2022).
Phase shift is dependent on the signal frequency,and only one phase shift can be applied per band,limiting the beamformer’s operation to a narrow frequency band.To perform beamforming over a wide frequency band,the band must be divided into many narrow bands before beamforming operation be carried out,which complicates digital signal processing.In contrast,true time delay is independent of signal frequency,enabling the beamformer to operate easily over a wide frequency band.It is also called “full RF” (full radio frequency) beamforming because it performs beamformer in entire bandwidth at once (Ellingson et al.2009).
We developed a decametric spectrometer system based on 4-element array using digital beamforming.We use true time delay to implement the beamformer because of its characteristic of broadband.The system is designed to operate with the frequency range of 25–65 MHz and has spectral resolution of 12 kHz,typical and maximum temporal resolutions of 5.3 ms and 0.4 ms,respectively.To minimize the impact of radio frequency interference (RFI),the decametric spectrometer system is located at the southeast of the Qinghai-Tibet Plateau(29°6′24.48〞N,100° 6′ 31.80〞E,the altitude of approximately 5000 m),in Daocheng City,Sichuan Province.This article presents a description of the decametric spectrometer system and the initial results of solar radio bursts.In Section 2,we provide a detailed accounts of the system’s design and implementation,mainly including the digital signal processing used in the digital receiver.Section 3 reports the initial observational results of solar radio bursts,and we make a summary in Section 4.
2.System Overview
Figure 1 shows the schematic of our decametric spectrometer system,which is designed based on a 4-element array using digital beamforming.Each antenna with dual-circular polarizations is individually instrumented and digitized,so both the analog receiver and the digital receiver process and digitize the signal with eight channels.The linear polarization signals are converted to circular polarization signals by phase-shift and then fed into the analog receiver.The analog receiver is used to amplify and filter the signals.The digital receiver performs beamforming and spectrum analysis,and the spectral data is transferred to the host computer via a USB3.0 transmission line.An observer can interact with the digital receiver using a control software,which enables the configuration of beamforming parameters,spectral resolution,and start and stop of observation.The specifications of the decametric spectrometer system are detailed in Table 2.

Figure 1.The schematic of the decametric spectrometer system.
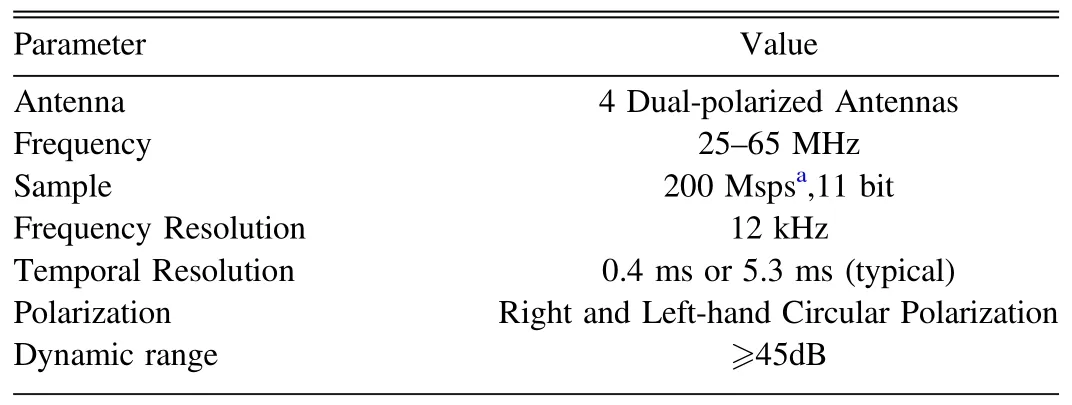
Table 2The Specifications of Decametric Spectrometer System
2.1.Antenna
The antenna used in this system is depicted in Figure 2.It consists of two mutually perpendicular dipole-like elements.Each dipole arm is composed of a triangle parallel to the ground,and an isosceles trapezoid bent down at an angle 45° to the ground.The antenna has dimensions of 3.00 m×3.00 m×1.53 m,and it is supported by a mast with a diameter of 0.15 m and a height of 1.53 m.To enhance stability,a supporting rod made of polyvinyl chloride(PVC)pipe is connected between the dipole arm and the mast.The black box at the top of the mast houses the front-end,including phase-shift,and low noise amplify (LNA).

Figure 2.The designed diagram of antenna.(Top left)Designed diagram viewed from front.(Top right)Designed diagram viewed from top.(Bottom)The physical diagram of antenna.
The antenna’s gain and half power beamwidth (HPBW) are simulated and presented in Figure 3.The gain is higher than 7.7 dB,and HPBW is 49°.2–95°.6 at a frequency range of 25–65 MHz.The Voltage Standing Wave Ratio(VSWR)is measured directly in an outdoor environment,and is shown in Figure 4.The VSWR is less than 3.5 within a frequency range of 25–65 MHz,indicating that the signal captured by the antenna is maximally transmitted to the LNA.Table 3 lists the specifications of antenna,which demonstrates that antenna possesses relatively good performance with a simple and compact structure.

Figure 3.The simulation of antenna performance.(Left) Gain of antenna at different frequencies.(Right) HPBW of antenna at different frequencies.
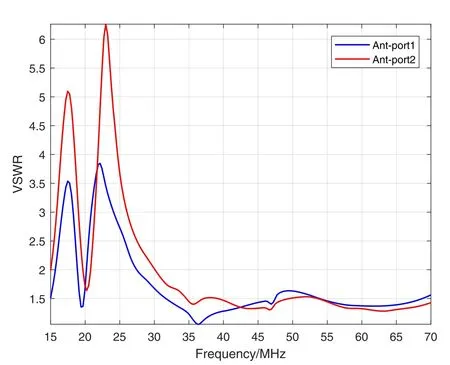
Figure 4.The measured VSWR of the antenna.
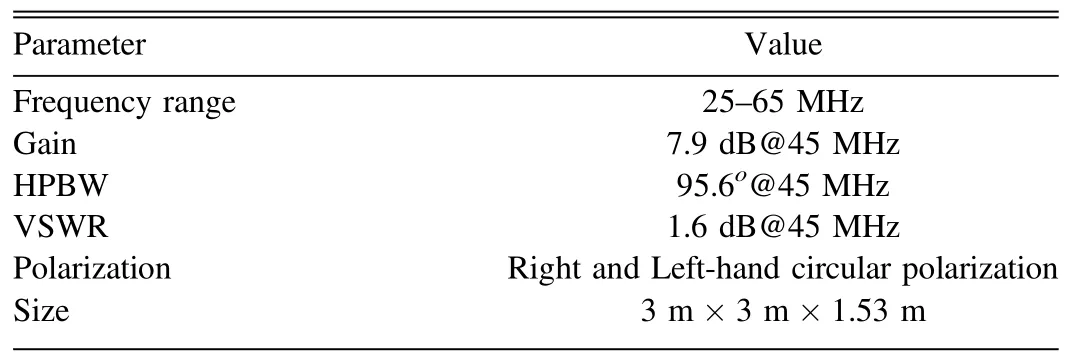
Table 3The Specifications of Antenna
To enhance the performance of the antenna array,a metal mesh is laid under the antenna array.The mesh area is 25 m2(5 m×5 m),with the hole size of 10 cm.This approach offers two advantages.5https://www.faculty.ece.vt.edu/swe/lwa/,York,J.,Kerkhoff,A.,Taylor,G.,et al.,“LWDA Ground Screen Performance Report,” Long Wavelength Array Memo(95),2007 July 23.First,it isolates the antenna from variable ground,such as moisture content,ensuring the stability of antenna’s electric performance.Second,it improves the gain of antenna.
2.2.Analog Receiver
The analog receiver consisting of LNA,filter,and postamplifier,is used to amplify signal to a suitable level for sampling and filter RFI.LNA connects closely the antenna output to minimize the receiver noise.Filter and post-amplifier constitute an analog module,which is installed in the observation room.LNA has a gain of around 34 dB–0.2 dB with a noise figure of 2.3 dB.Analog module has 3 dB bandwidths of 25–65 MHz and gain of around 29 dB–1.0 dB.Coaxial cables are used to transmit radio frequency signals between the LNAs and the analog modules.These cables have the same length of 75 meters with the loss of about 4.2 dB @45 MHz.Analog receiver is designed to be a simple structure without the mixer,the leakage of coaxial cables may impact on the system seriously.Therefore,the coaxial cables are buried under the ground.
2.3.Digital Receiver
2.3.1.Principle of Beamforming
Beamforming is a signal processing technique to synthesize directional beam and improve the spatial selectivity of the antenna array (Sclocco et al.2012).The signals emitted by a source arrive at different antennas at different times,which causes phase difference among the signals captured by different antennas.In order to synthesize the required beam,the signals from each antenna are delayed to realized the phase alignment before being summed together.The delay required to be compensated depends on the position of the source and of the antennas,and is denoted by τc.It can be divided into an integral period delay (integral sample period) and a fractional period delay (smaller than sample period),as described by Equation (1).The integral delay is achieved by using First in First Out (FIFO),which shifts the digital signal stream to perform the integral period delay.The factional delay is achieved by using Finite Impulse Response(FIR)filter,which convolves with the digital signal stream to perform the fractional period delay6https://www.faculty.ece.vt.edu/swe/lwa/,Ellingson,S.W.,LWA Beamforming Design Concept,Long Wavelength Array Memo(107),2007 October 30.(Soriano et al.2011).
whereh[n]is the FIR filter coefficient,w[n]is the coefficient of window function,andNis the taps of FIR filter.Lcandh[n]are called beamforming parameters,which need to be quantized to an integral bit for application in FPGA.
2.3.2.Architecture of Signal Processing
The digital signal processing in the digital receiver is modular.First,the signals from the analog receiver are digitized at 200 Msps with 11 bit resolution.Second,the digital signals are processed by the beamforming unit to generate required beam.Third,dynamic spectrum is obtained by FFT analysis.Finally,the spectral data is formatted into User Datagram Protocol (UDP) packets and transmitted to the host computer.
Beamforming Unit—Figure 5 shows the signal processing of the beamformer.To generate the desired directional beam,the identical polarized signals from the four antennas are first delayed using FIFO and FIR filter,and then combined together using adding module.The maximum depth of FIFO is designed to be 64,which is sufficient to compensate the delay caused by the size of antenna array with maximum baseline of 15 m.To ensure delay accuracy,a 41-tap FIR filter is designed with the Chebyshev window (sidelobe magnitude of 100 dB),and its coefficient is quantized to be 16 bit.The adjustments of delay are programmed to ensure the array beam point to the desired direction in real-time.
Spectrum Analysis Unit—The output signals of the beamforming unit are analyzed using the classical FFT method.The spectral resolution is determined by the word length of FFT operation and the sample frequency,which are 16,384 and 200 Msps,respectively,resulting in spectral resolution of about 12 kHz (Du et al.2017).The spectra are obtained every 81.92 us.The temporal resolution is determined by the number of accumulation of spectra,which can be set as either 5 or 65,resulting in temporal resolution of 0.4 ms or 5.3 ms,respectively.The spectral data is output in a linear format of 2 bytes (16-bit data length) and transported to the host computer.
2.3.3.Implementation of Digital Receiver
The digital receiver is developed to meet the requirements of the signal processing flow described above.It is implemented by using custom printed circuit board,which includes a signal processing board,a digitizer board,and a communication board,see Figure 6 in detail.The FPGA Mezzanine Card(FMC) physical interface is used to connect the signal processing board with the digitizer board and the communication board.
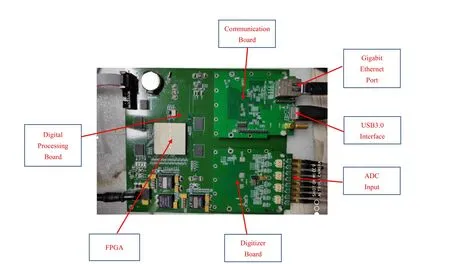
Figure 6.The physical diagram of the digital receiver.
The digitizer board is equipped with two AD6657a analogto-digital converters,which can digitize 8-channel analog signals in total.It samples the signals from the analog receiver at a clock rate of 200 Msps with 11 bit resolution.The analog signals are connected to the digitizer board via SSMA connector and are converted to the differential signal though balun before being sampled.The output data transports to the signal processing board for further processing.
The digital processing board includes an Intel Stratix III EP3SE110F1152I3N FPGA,which receives the digital signal from the digitizer board and performs the signal processing.One of its key advantages is that it can be reprogrammed according to the new requirements easily.
The communication board is equipped with a Gigabit Ethernet physical interface chip and a USB3.0 interface chip.They are connected to the host computer though network cable and USB3.0 transmission line,respectively.The Gigabit Ethernet physical interface chip is responsible for communicating with the host computer to enable monitoring and controlling functions,as well as receiving the beamforming parameters.The USB3.0 interface chip is responsible for transmitting the spectral data to the host computer.
2.3.4.Test Results of Beamforming
We designed and conducted a laboratory experiment to test the effectiveness of beamforming.The signal from source generator is divided into eight channels though the power divider.The signals of each channel are transmitted to the digital receiver independently through separate coaxial cable with known length.The beamforming parameters are calculated to compensate time delay,which is caused by different lengths of coaxial cable,and are configured into the digital receiver.Table 4 lists the coaxial cable’s length of each channel and the corresponding delay compensation in the experiment.The group velocity of the electromagnetic signal in the coaxial cable is 2c/3,wherecis the speed of light in the free space.The effectiveness of beamforming is verified by comparing the power of beamforming channel with that of a single channel,as shown in Figure 7.The left three panels show the signal power of beamforming channel (red line) and the signal power of single channel (blue line) for different signal frequencies(30 MHz,52 MHz,and 65 MHz).The different amplitudes correspond to varying output power of source generator,which is set to“sweep amplitude”mode.The right three panels show the ratio,expressed in logarithmic form,between the signal power of beamforming channel and that of single channel.The blue line is the measured value,and the red line is the theoretical value.The measured value range from 11.2-12.4 dB,demonstrating good agreement with the theoretical value of 12 dB.The test result verifies the effectiveness of beamforming and demonstrates that the FIFO and the FIR filter perform delay compensation accurately.
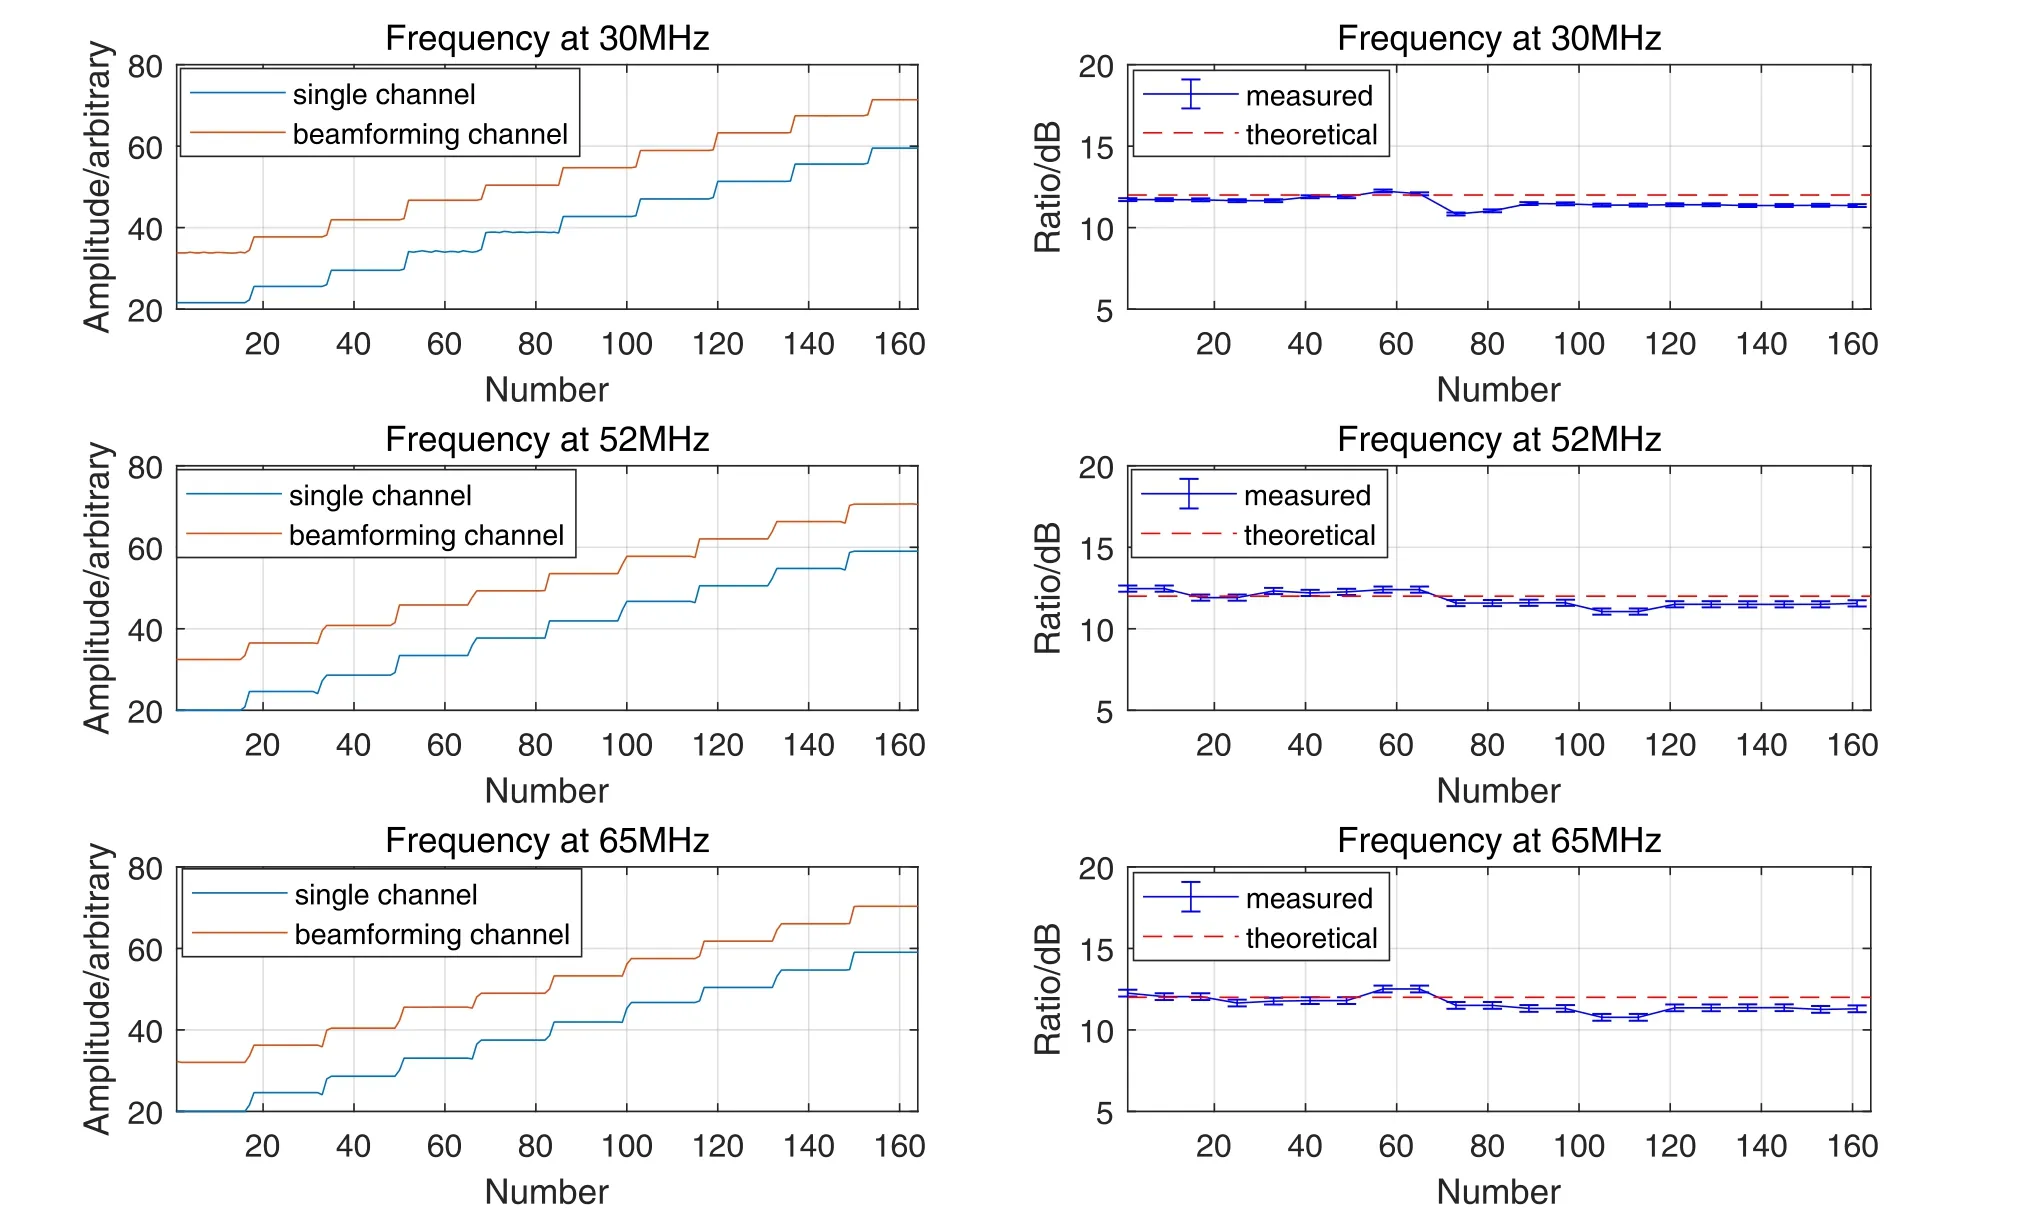
Figure 7.The tested result of beamforming.The left three panels are comparison of power between the beamforming channel and the single channel.The red line is the signal power of beamforming channel,and the blue line is the signal power of single channel.Different amplitude correspond to varying output power of source generator,which is set to“sweep amplitude”mode.The selected signal frequencies are 30 MHz,52 MHz,and 65 MHz in the order from top to bottom.The right three panels show the ratio,expressed in the logarithmic form,between the beamforming channelʼs power and the single channelʼs power.They correspond to the frequencies and amplitudes of the left three panels.The blue line is the measured value,and the red line is the theoretical value.
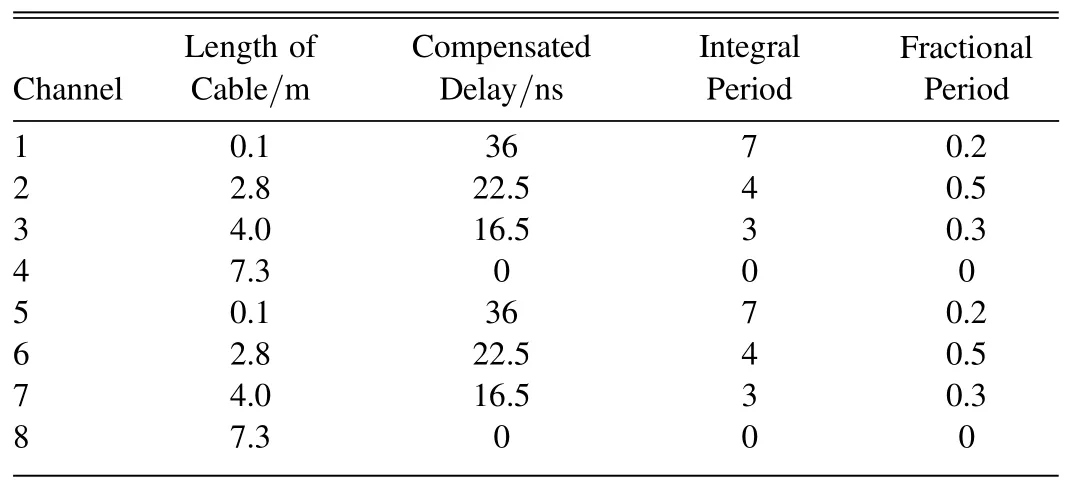
Table 4The Coaxial Cable’s Length of Each Channel and Corresponding Delay Compensation
2.3.5.Beam Pointing and Tracing the Sun
During observation,the beam center of antenna array should point toward the Sun.To achieve this,the compensated delay τcneeds to be calculated according to the position of the Sun and the antennas.The beamforming parameters can then be obtained using the method described in Section 2.3.1.Because the compensated delay τcis always changing with the position of the Sun,the beamforming parameters need to be adjusted in real-time to ensure that the beam center is always pointing to the Sun.The beamforming parameters are calculated at different time and then recorded into a track file prior to the observation.During the observing period,the host computer reads the track file and configures beamforming parameters into the digital receiver to realize the tracking of the Sun.At present,the host computer configures the beamforming parameters every five seconds.
3.Initial Observational Results
The complete decametric spectrometer system is arranged as a 1D array in the east–west direction with an adjacent antenna distance of 5 m,as shown in Figure 8.The system has realized the routine observation between 01:30:00 and 09:30:00 UT every day,since 2022 August.Up to now,tens of solar radio bursts and fine structures have been observed.

Figure 8.The layout of antenna array.
3.1.An Event on 2022 November 11
Figure 9 presents a dynamic spectrum observed by our decametric spectrometer,with a high signal-to-noise ratio and significant frequency drift.This event with wideband flux enhancements,was observed in both left polarization and right polarization,occurring approximately between 01:48:20 and 01:50:44 UT on 2022 November 11.Figure 10 presents the same event,exhibiting flux across different frequencies.

Figure 9.Dynamic spectrum of solar radio burst at left polarization (left panel)and right polarization (right panel) at 01:48:20–01:50:44 UT on 2022 November 11 observed by our decametric spectrometer.

Figure 10.Flux at different frequencies at left polarization (left panel) and right polarization (right panel) of the same events in Figure 9.
3.2.Type III Bursts
In the solar radio dynamic spectrum,type III bursts are the fast frequency drifting signatures.They are interpreted as the radio signatures of energetic electron beams propagating along the magnetic field lines in the corona or interplanetary space with a speed of 0.2–0.6c(Reid&Ratcliffe 2014;Rengifo et al.2021).On 2022 November 11,between 04:37:29 and 04:39:32 UT,an event was observed by our decametric spectrometer,with spectral resolution of 12 kHz and temporal resolution of 5.3 ms,as shown in the right panel of Figure 11,which displays the fine structures of the type III bursts.The same dynamic spectra were observed by the Learmonth Station with spectral resolution of 125 kHz and temporal resolution of 3 s,as shown in the left panel of Figure 11,which cannot resolve the fine structures clearly.It indicates the importance of high resolution and sensitivity,which is the advantage of the beamforming array.
3.3.Type II Bursts
Type II radio bursts are the slowly frequency drifting signatures and usually observed in the metric and decametric bands.CME-driven shock acceleration is the generally accepted mechanism of type II radio bursts.A GOES M1.6 class flare in soft X-rays occurred in active region AR 13 078 on 2022 August 19 (see the solar monitor webpage:https://www.solarmonitor.org/index.php?date=20220819).The left panel of Figure 12 presents a type II burst recording at 04:36–04:43 UT with the frequency range of 30–100 MHz on 2022 August 19.The type II burst was associated with a CME with the velocity of 832 km s−1(see the LASCO CME Catalog webpage:http://cdaw.gsfc.nasa.gov/CME_list).The harmonic band with split-band structure of this type II solar radio burst was observed by Learmonth Station and the fundamental band is very faint (marked with F and H in the left panel of Figure 12).The type II solar radio burst observed by our decametric spectrometer with spectral resolution of 12 kHz and temporal resolution of 1 s,as presented in the right panel of Figure 12,which corresponds the white box in the left panel.It is the part of the harmonic band and displays the more fine structures,which may show the details of shock accelerating energy electrons.Depending on the coronal electron density model proposed by Newkirk (1961),the velocity of the shock is estimated of 610 km s−1,which is basically agreement with the velocity of CME.

Figure 12.Dynamic spectrum of solar radio bursts on 2022 August 19.(Left) Observed by Learmonth Station,with spectral resolution of 125 kHz and temporal resolution of 3 s.(Right) Dynamic spectrum (zoomed-in image indicated by the white rectangle in the left panel) observed by our decametric spectrometer,with spectral resolution of 12 kHz and temporal resolution of 1 s.
4.Summary
This article presents the design and implementation of a new decametric spectrometer system,which consists of a 4-element array,an 8-channel analog receiver and a digital receiver.The digital receiver is the core of the system,which is implemented on the FPGA.The main digital signal processing includes digital beamforming and spectrum analysis.We use true time delay to implement the beamformer due to its characteristic of broadband.The required time delay compensation is accomplished by using the FIFO and the FIR filter.The beamforming parameters are configured in real time to ensure that the antenna array’s beam center points to the Sun in real time.The effective beamforming allows the system to achieve high spectral and temporal resolution with high sensitivity.Tens of solar bursts and fine structures have been observed successfully,which further validates the effectiveness of decametric spectrometer system.We will further update the analog receiver and digital receiver to extend the highest frequency to at least 100 MHz in the near future.Although the beamforming was achieved in a 1D array,as a prototype of digital beamforming array,we knew how to combine the array signals to form the beam.In the future,we plan to increase the number of the antennas and the size of the array,and further implement the beamforming in 2D array for higher sensitivity and spatial resolution.
Acknowledgments
This work was supported by the National Natural Science Foundation of China (NSFC) grants 11703089 and 11903080.G.Gao acknowledges the support by the National SKA Program of China (No.2022SKA0120101) and Yunnan Fundamental Research Projects (No.202 301AT070325).L.Dong acknowledges the support by Kunming International Cooperation Base Project (GHJD-2021022).We acknowledge the support of Yunnan Key Laboratory of Solar physics and Space Science,Kunming (202205AG070009).We acknowledge WuMing Mountain Observation Station,Yunnan Observatories,Chinese Academy of Sciences for supporting the construction of decametric spectrometer system.We also acknowledge the data from the Learmonth Observatory.
 Research in Astronomy and Astrophysics2023年8期
- Research in Astronomy and Astrophysics的其它文章
- Preliminary Exploration of Areal Density of Angular Momentum for Spiral Galaxies
- A Pre-explosion Effervescent Zone for the Circumstellar Material in SN 2023ixf
- Type Ia Supernova Explosions in Binary Systems: A Review
- Velocity Dispersion σaper Aperture Corrections as a Function of Galaxy Properties from Integral-field Stellar Kinematics of 10,000 MaNGA Galaxies
- A Catalog of Collected Debris Disks: Properties,Classifications and Correlations between Disks and Stars/Planets
- Attention-Based Deep Learning Model for Image Desaturation of SDO/AIA
