Velocity Dispersion σaper Aperture Corrections as a Function of Galaxy Properties from Integral-field Stellar Kinematics of 10,000 MaNGA Galaxies
Kai Zhu,Ran Li,Xiaoyue Cao,Shengdong Lu,Michele Cappellari,and Shude Mao
1 National Astronomical Observatories,Chinese Academy of Sciences,Beijing 100101,China;ranl@bao.ac.cn
2 Institute for Frontiers in Astronomy and Astrophysics,Beijing Normal University,Beijing 102206,China
3 School of Astronomy and Space Science,University of Chinese Academy of Sciences,Beijing 100049,China
4 Department of Astronomy,Tsinghua University,Beijing 100084,China
5 Sub-department of Astrophysics,Department of Physics,University of Oxford,Denys Wilkinson Building,Keble Road,Oxford,OX1 3RH,UK
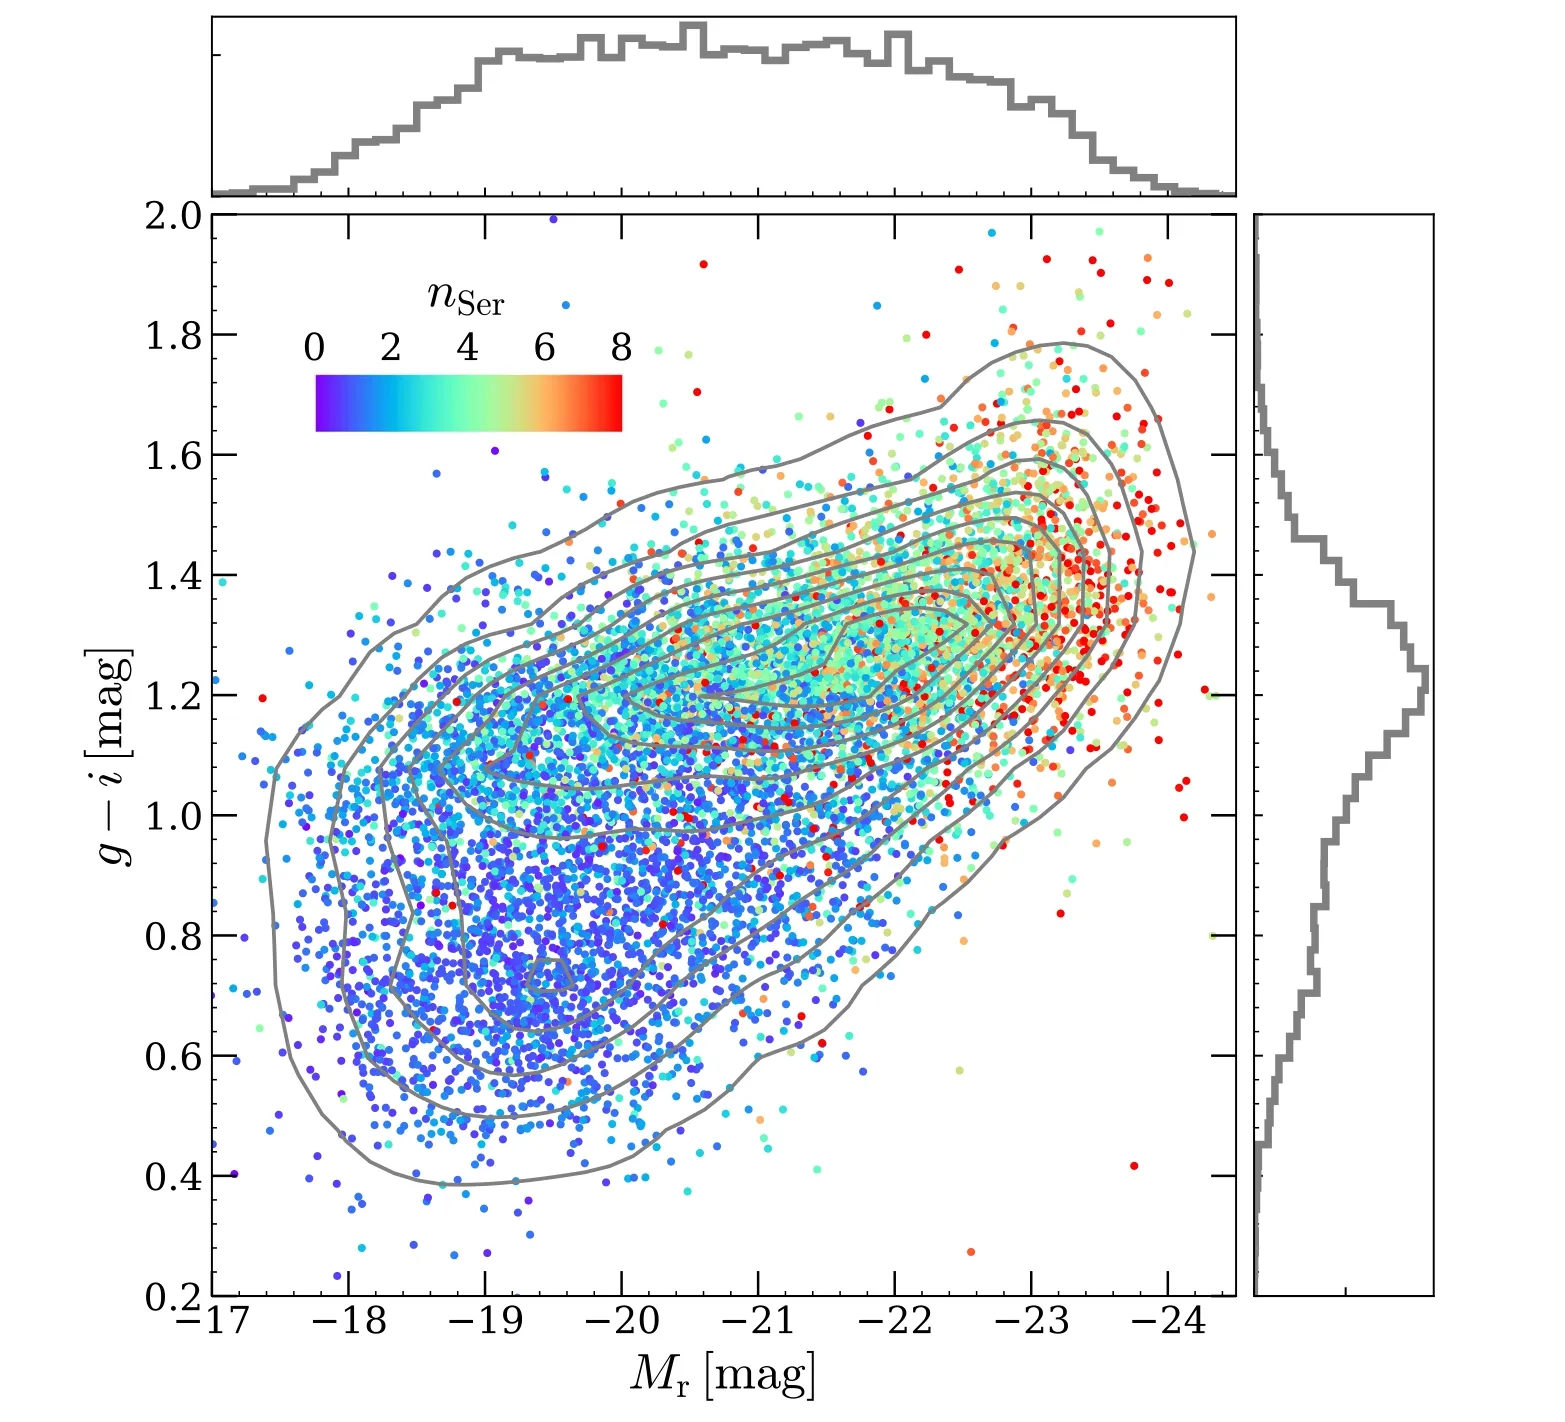
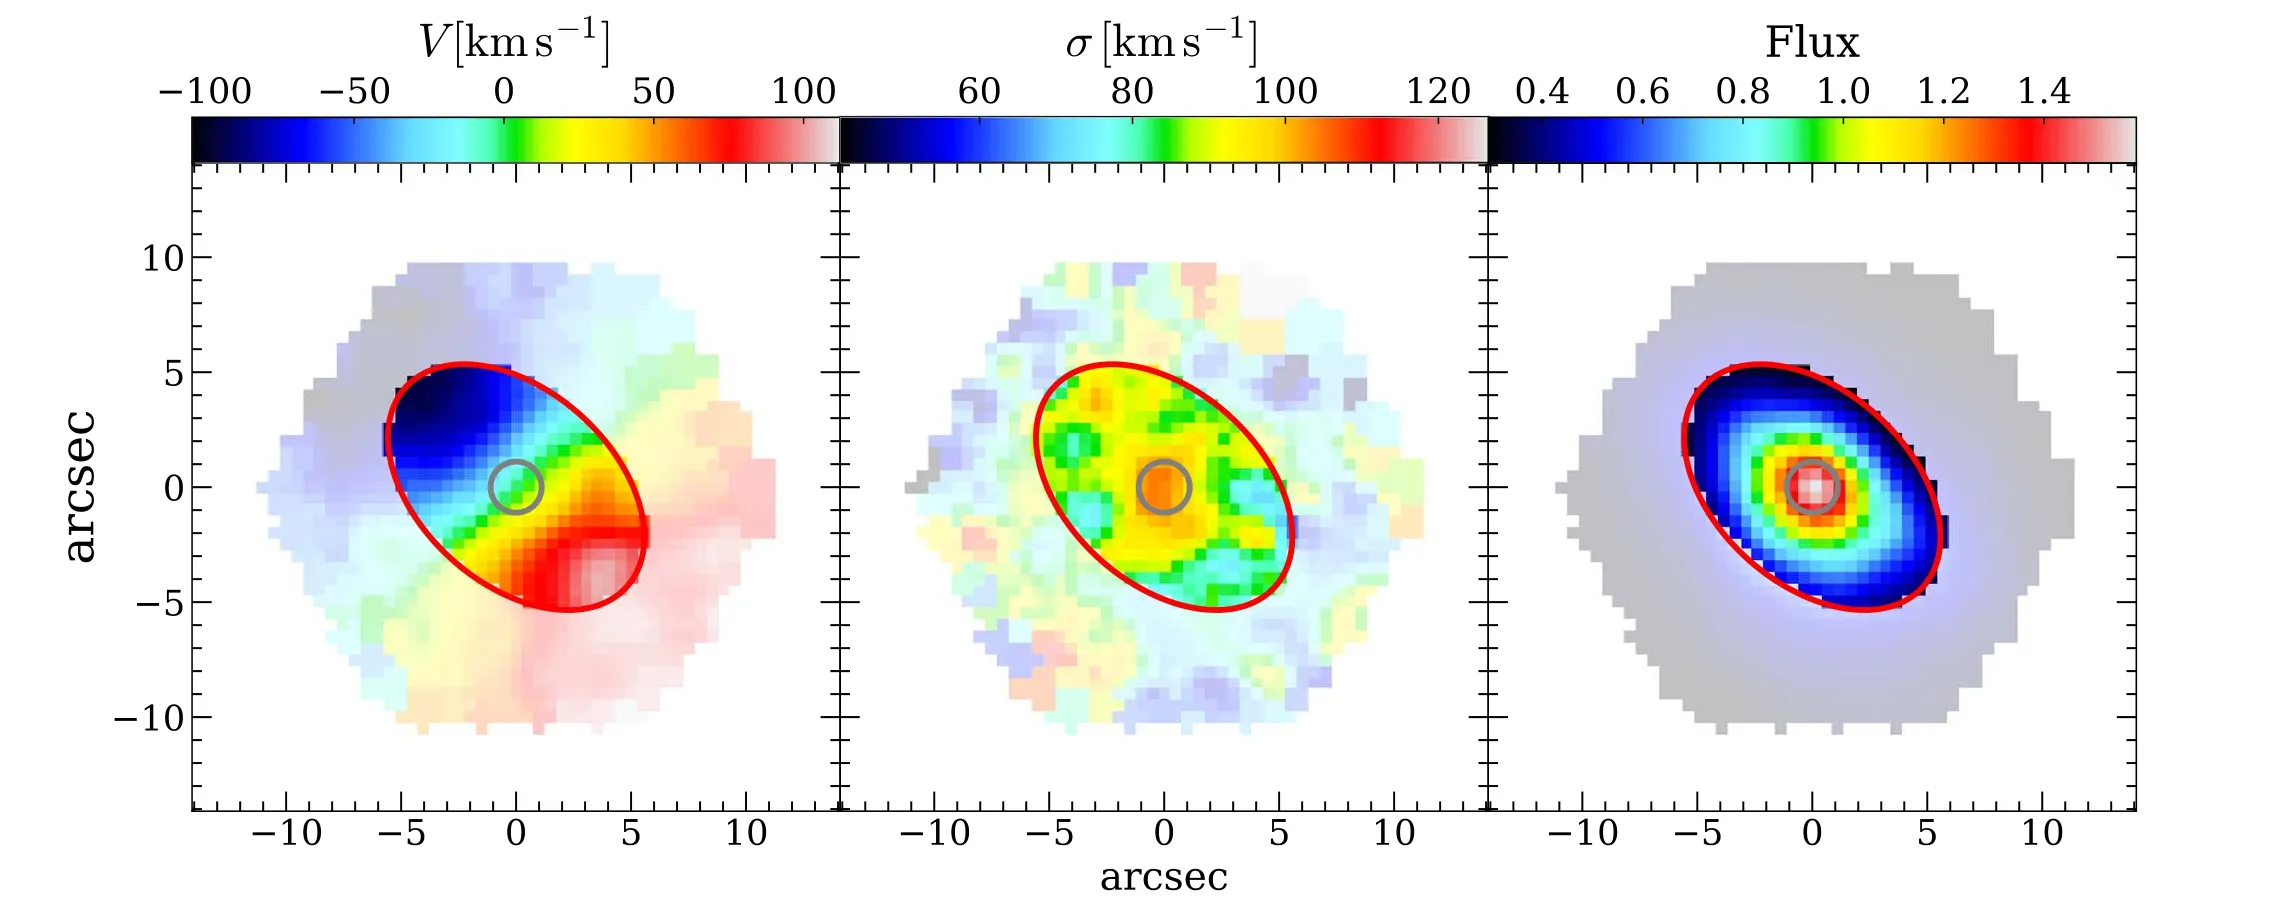
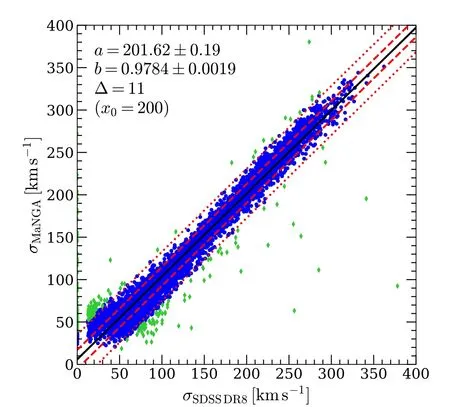
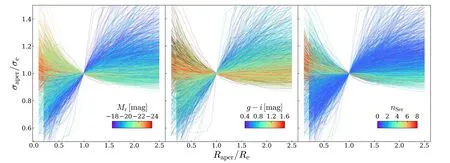
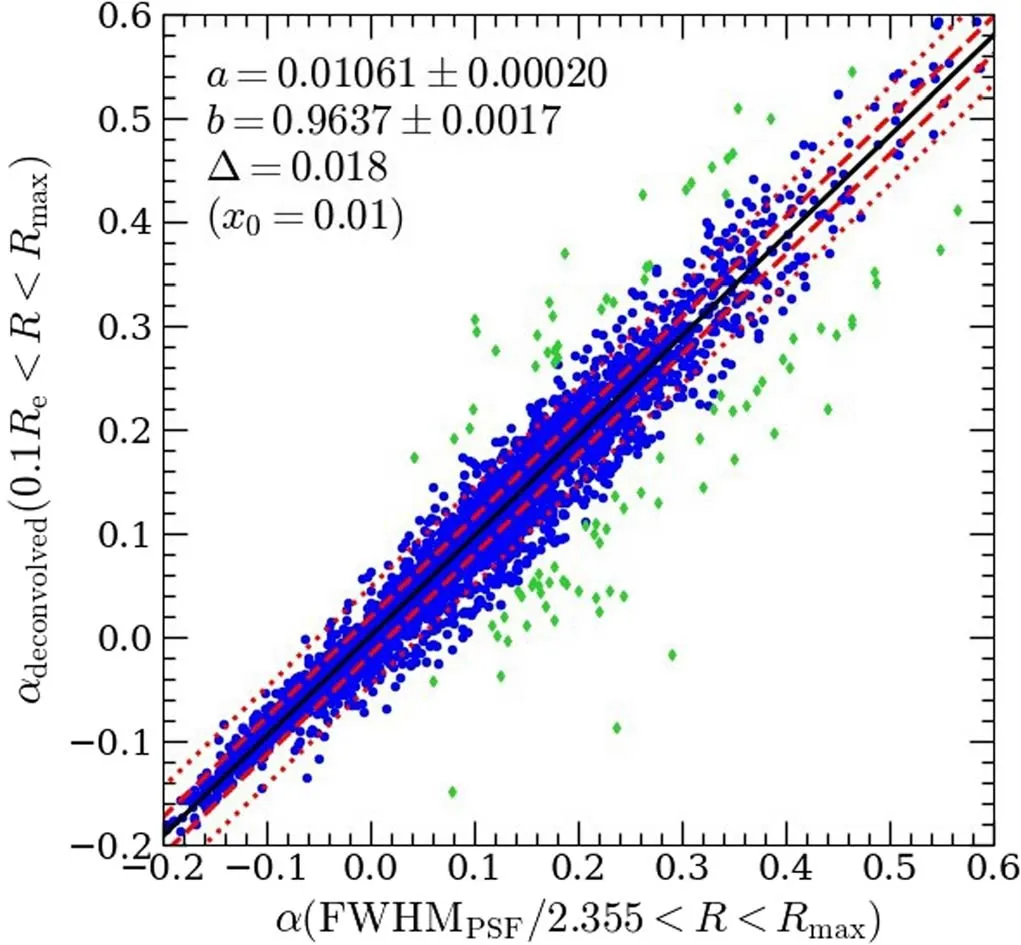
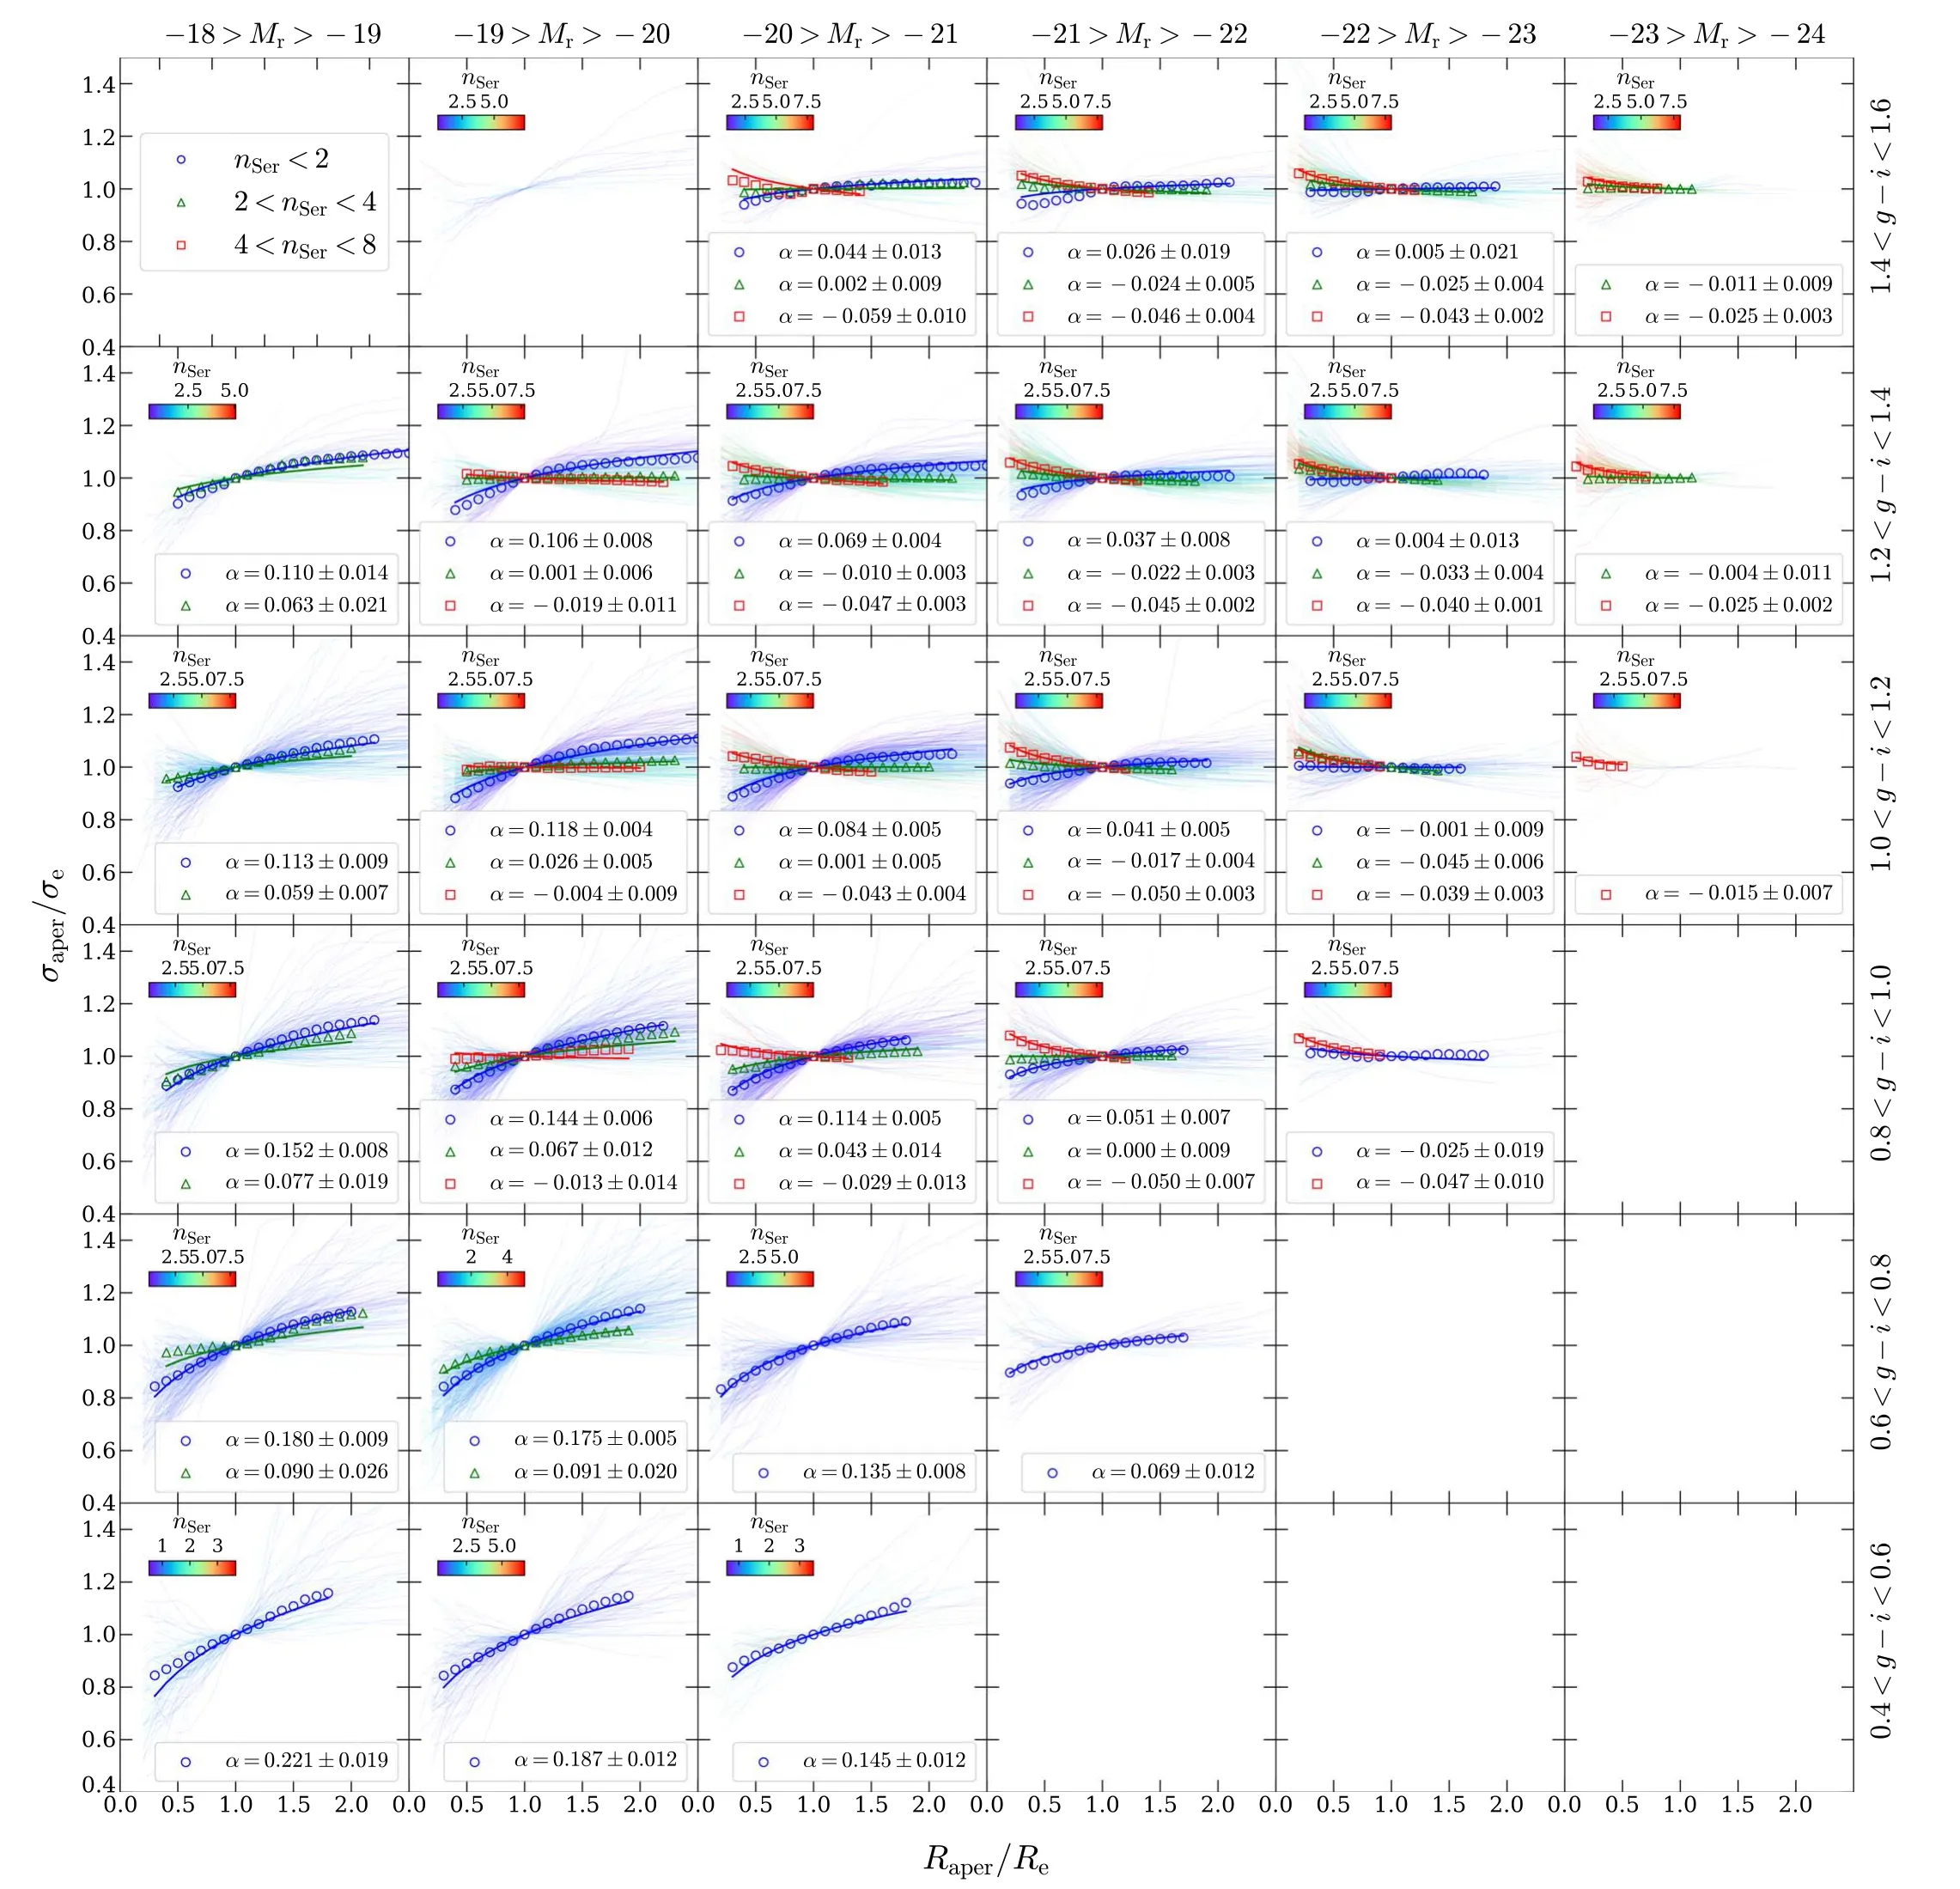
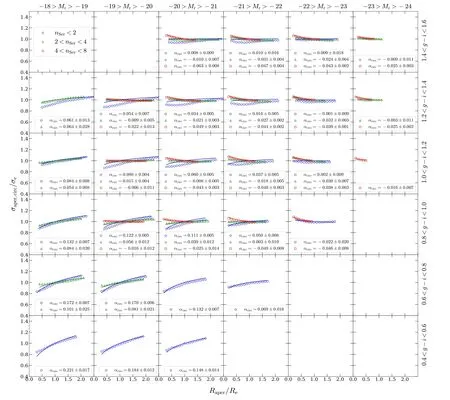
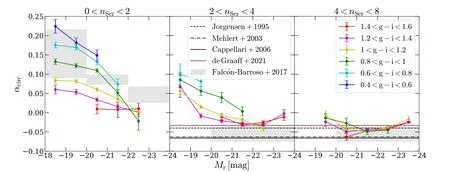
Abstract The second moment of the stellar velocity within the effective radius,denoted by ,is a crucial quantity in galaxy studies,as it provides insight into galaxy properties and their mass distributions.However,large spectroscopic surveys typically do not measure σe directly,instead providing σaper,the second moment of the stellar velocity within a fixed fiber aperture.In this paper,we derive an empirical aperture correction formula,given by σaperσe=(Raper Re)α,using spatially resolved stellar kinematics extracted from approximately 10,000 Sloan Digital Sky Survey–Mapping Nearby Galaxies at Apache Point Observatory integral field unit observations.Our analysis reveals a strong dependence of α on the r-band absolute magnitude Mr, g–i color,and Sérsic index nSer,where α values are lower for brighter,redder galaxies with higher Sérsic indices.Our results demonstrate that the aperture correction derived from previous literature on early-type galaxies cannot be applied to predict the aperture corrections for galaxies with intermediate Sérsic indices.We provide a lookup table of α values for different galaxy types,with parameters in the ranges of −18>Mr>−24,0.4 Key words: galaxies: evolution– galaxies: formation– galaxies: kinematics and dynamics– galaxies: structure Stellar kinematics provide crucial information for understanding the mass distributions of galaxies.The advent of integral field spectroscopy (IFS) surveys,such as the Spectroscopic Areal Unit for Research on Optical Nebulae(SAURON;de Zeeuw et al.2002),ATLAS3D(Cappellari et al.2011),Calar Alto Legacy Integral Field Area (CALIFA;Sánchez et al.2012),Sydney/AAO Multi-object Integral-field spectrograph(SAMI;Bryant et al.2015),and Mapping Nearby Galaxies at Apache Point Observatory (MaNGA;Bundy et al.2015),has allowed for spatially resolved stellar kinematics,which,when combined with well-established dynamical modeling methods,such as Schwarzschild modeling (Schwarzschild 1979) and Jeans Anisotropic Modeling (JAM;Cappellari 2008,2020),can provide accurate measurements of the mass distribution of galaxies(Cappellari et al.2006,2013;Scott et al.2015;Li et al.2018;Zhu et al.2018,Zhu et al.2023a).The scaling relations between the dynamical properties and the stellar populations of the galaxies can be explored in detail(e.g.,Cappellari 2016;Li et al.2018;Lu et al.2023). However,the high cost of obtaining spatially resolved kinematics limits the applicability of IFS to a significantly larger number of local galaxies,such as the millions of galaxies in the Sloan Digital Sky Survey (SDSS),or distant galaxies at high redshift that cannot be spatially resolved.Thus,the second moment of stellar velocity within an aperture σaper,which is measured using single-fiber spectroscopy,remains a fundamental quantity for understanding the dynamics of galaxies.Important scaling relations,such as fundamental plane(Djorgovski &Davis 1987;Dressler et al.1987;Jorgensen et al.1995)and mass plane(e.g.,Auger et al.2010;Cappellari et al.2013;Zhu et al.2023b),are derived with respect to σaperas well.However,galaxies have different angular sizes spanning a wide dynamic range,but the fiber size is fixed.As a result,velocity moments are not measured coherently for the entire galaxy sample.Therefore,researchers need to correct the measured velocity dispersion to a physically meaningful radius,which is typically the effective radius of a galaxy(Auger et al.2010;Chen et al.2019;de Graaff et al.2021). Earlier studies on velocity dispersion aperture corrections focused on early-type galaxies,with velocity dispersion profiles typically described as a power-law function of the form shown in Equation (2).Jorgensen et al.(1995) derived a power-law slope of α=−0.04 for the early-type galaxies in nine clusters,while Mehlert et al.(2003)found α=−0.063 for 35 early-type galaxies in the Coma cluster.A later study based on the SAURON IFS data analyzed 40 early-type galaxies and reported a slope of α=−0.066±0.035 (Cappellari et al.2006).The aperture corrections were extended to 300 CALIFA galaxies across the Hubble sequence (Falcón-Barroso et al.2017),which found a consistent power-law slope for the earlytype galaxies(α=−0.055±0.020)and a strong variation of α with magnitude (or stellar mass) for the late-type galaxies(α=0.047±0.021 forMr<−22,α=0.086±0.013 for−22 In this work,we take advantage of the full sample(∼10,000)of MaNGA IFS observations to perform a more detailed classification of galaxies and try to obtain more accurate aperture corrections for each type of galaxy.We investigate the relations between the shape of velocity dispersion profiles(quantified by a power-law form) and other properties,e.g.,magnitude,color,and Sérsic index (Sersic 1968).By selecting galaxies within a narrow parameter range,we aim to eliminate the effect of sample bias and provide a lookup table that can be applied to various types of galaxies,resulting in more precise aperture corrections. The organization of this paper is as follows.In Section 2,we provide a brief overview of the stellar kinematic data and the MaNGA sample.Our main results are presented in Section 3.Finally,we summarize our conclusions in Section 4.We adopt a standard cosmology with Ωm=0.3,ΩΛ=0.7,andH0=70 km s−1Mpc−1throughout this work. As a part of the SDSS-IV,the MaNGA (Bundy et al.2015)is an integral field unit (IFU) survey that uses tightly packed arrays of optical fibers to obtain spectral measurements of approximately 10,000 nearby galaxies.Using the Baryon Oscillation Spectroscopic Survey spectrographs (Smee et al.2013;Drory et al.2015) on the Sloan 2.5 m telescope (Gunn et al.2006)at the Apache Point Observatory,this survey covers a radial range up to 1.5 effective radii (Re) for the primary+sample and up to 2.5Refor the secondary sample (Law et al.2015;Wake et al.2017).MaNGA provides spatially resolved spectra with a spaxel size of 0.5〞,and the averageg-band pointspread function (PSF) FWHM throughout the survey is about 2.54〞 (Law et al.2016). The spectral measurements across the wavelength range of 3600–10300 Å have a spectral resolution of σ=72 km s−1(Law et al.2016).The raw observational data require spectrophotometric calibration (Yan et al.2016),which is performed using the Data Reduction Pipeline(DRP)(Law et al.2016).The DRP processes the data to produce threedimensional data cubes that can be used to create spatially resolved maps of the galaxies under observation. The Data Analysis Pipeline (DAP;Belfiore et al.2019;Westfall et al.2019) is responsible for producing higher-level products,such as stellar kinematics,nebular emission-line properties,and spectral indices of galaxies.The stellar kinematic information is derived from the IFU spectra using the PPXF software (Cappellari &Emsellem 2004;Cappellari 2017,2022),which fits absorption lines with a subset of the Medium resolution Isaac Newton Telescope Library of Empirical Spectra (MILES;Sánchez-Blázquez et al.2006;Falcón-Barroso et al.2011) stellar library,MILES-HC.The spectra are Voronoi binned (Cappellari &Copin 2003) to S/N=10 to ensure the reliability of the derived stellar velocity dispersions,which are presented as a combination of the intrinsic velocity dispersion of stars (σ*) and the quadrature difference between the instrumental dispersion of the galaxy template and the MaNGA data (σdiff).The velocity dispersion of the galaxy can be obtained using the equation,where σobsis the observed velocity dispersion (Westfall et al.2019).In this work,we make use of the maps of stellar velocity,stellar velocity dispersion,andg-band flux,which are taken from the DAP outputs6https://www.sdss.org/dr17/manga/manga-data/data-access/. We obtain 10,735 DAP outputs from SDSS DR17(Abdurro’uf &Aerts 2022),which includes 10,296 observations of galaxies and the ancillary program targets,such as the Coma,IC342,M31,and globular clusters.After excluding 151 flagged data cubes that have been identified as critical quality or unusual quality from 10,296 galaxy observations,there are 10,145 high-quality data cubes corresponding to 10,010 unique galaxies and 135 repeat observations.The sample has a nearly uniform distribution of stellar masses in the range of 109–6×10¹¹M⊙and a median redshift of approximately 0.03 (Wake et al.2017). In this work,we use the stellar kinematics of 10,010 unique galaxies but remove the galaxies that have been identified as having bad stellar kinematics (Zhu et al.2023a).Finally,we obtain a sample of 9132 galaxies.The distribution of the whole sample is presented in Figure 1,in which the colorg–i,therband absolute magnitudeMr,and the Sérsic index are taken from the PyMorph catalog (Domínguez Sánchez et al.2022).As shown in Figure 1,the sample spans a wide range of galactic properties:from the faint(Mr=−18 mag)to the bright(Mr=−24 mag) and from the blue (g–i=0.4 mag) to the red(g–i=1.6 mag).The large sample and various types of galaxies (i.e.,the red sequence,the blue cloud,and the green valley)enable us to comprehensively study the aperture effects on the velocity dispersion. Figure 1.Color–magnitude diagram,with symbols color-coded by the Sérsic index.All the quantities(r-band absolute magnitude,g–i color,and Sérsic index nSer)are taken from the PyMorph catalog(Domínguez Sánchez et al.2022).The gray contours are the two-dimensional number density distributions,while the gray histograms on the top and right are the one-dimensional distributions (normalized to unity). We derive the integrated stellar velocity dispersion within a set of apertures and obtain the aperture profiles for the whole sample.The integrated velocity dispersion is defined as the flux-weighted second velocity moments within a given elliptical aperture of areaπ=A,written as whereVk,σk,andFkare the stellar velocity,stellar velocity dispersion,andg-band flux in thekth spaxel,respectively.Following Cappellari et al.(2013,Section 3.3.3),we choose to use the elliptical aperture instead of the circular aperture to properly account for the inclination effects.Using elliptical apertures is also more appropriate for flat galaxies,which are typically dominated by rotation.If a circular aperture defined by the effective radius is used,the peak of rotation may be located outside the aperture,resulting in an underestimated σaper.Because theVand σ of DAP outputs are derived from the Voronoi binned spectra,we assign the binned values to each 0.5〞×0.5〞spaxel belonging to each Voronoi bin.We calculate σaperwithin the elliptical apertures with fixed ellipticity and position angle (PA),which are derived from the singlecomponent Sérsic fits (Domínguez Sánchez et al.2022). In Figure 2,we present an example to illustrate the calculation of integrated stellar velocity dispersion within a given elliptical aperture.In this figure,the pixels within the red ellipse of areaπ=Aare adopted to estimate the effective velocity dispersion σeusing Equation (1).The effective velocity dispersion σeis demonstrated to agree well with that measured from a single fit on the stacked spectra within the same aperture(Cappellari et al.2013).Moreover,we also calculate the integrated velocity dispersion within a circular aperture with a diameter of 3〞,like the SDSS single fibers using Equation(1).Then,we match the galaxies with the spectroscopic catalog of SDSS DR87https://www.sdss3.org/dr8/data_access.php(Aihara et al.2011) and compare the velocity dispersion values obtained with two methods in Figure 3.To ensure that the velocity dispersions derived from the SDSS single-fiber spectra are reliable,we only select the spectral measurements with median S/N>10.As shown in Figure 3,we perform a linear fit to the two quantities with the LTS_LINEFIT8https://pypi.org/project/ltsfit/software (Cappellari et al.2013),which combines the least-trimmed-squares robust technique of Rousseeuw&Driessen(2006)into a least-squares fitting algorithm and allows for the intrinsic scatter and errors in all coordinates.As shown in the figure,the slope(b=0.9784±0.0019)and the small rms scatter(Δ=11 km s−1)denote the high consistency between the two measurements,while most detected outliers are potential unreliable measurements with velocity dispersions below the resolution limit (100 km s−1) of the SDSS spectrograph.This justifies the accuracy of Equation (1) in estimating the integrated stellar velocity dispersion within a given aperture from the IFU kinematics. Figure 2.Illustration for the definition of σaper(MaNGA ID:12-180432).The panels from left to right are the maps of stellar velocity,stellar velocity dispersion,and g-band flux.The gray circle denotes the FWHMPSF/2.355,while the red ellipse is the half-light isophote of area π=A ,where Re is the effective radius.The Re,ellipticity,and PA are taken from the single Sérsic fits(Domínguez Sánchez et al.2022).The σe is calculated using Equation(1)and the pixels within the red ellipse,while σaper values are determined within the concentric ellipses of area π=A . Figure 3.Comparison of the stellar velocity dispersion derived from the MaNGA survey with the SDSS DR8 measurements(Aihara et al.2011)within the same circular aperture of 3〞diameter.The velocity dispersions of MaNGA are computed using Equation (1),while those from SDSS DR8 are from the single fit of the integrated spectra with the same aperture.The black solid,red dashed,and red dotted lines are the best-fitting,1σ,and 2.6σ lines obtained using the LTS_LINEFIT procedure(with clip=3).The coefficients of the bestfitting y=a+b×(x −x0) are shown in the panel,while Δ is the observed rms scatter.The green symbols are the detected outliers of LTS_LINEFIT beyond 3σ confidence level. For each galaxy,we calculate the σaperwithin a set of elliptical apertures of areaA=.Raperranges from 0.1Reto 2.5Re,with a linear step of 0.1Re.We use theReand the effective velocity dispersion σeas normalization factors to rescale the integrated velocity dispersion profiles.The normalized profiles are presented in Figure 4,which are colored by the SDSSr-band (Stoughton et al.2002) absolute magnitudeMr(left panel),the colorg–i(middle panel),and the Sérsic indexnSer(right panel).As can be seen,the σaperprofiles vary significantly with different galactic properties: the brighter and redder galaxies with higher Sérsic index tend to have decreasing σaperprofiles,while the fainter and bluer galaxies with lower Sérsic index show increasing trends toward outside.The increasing (decreasing) trends of σaperprofiles are due to their differentV/σ profiles.The σaperof massive and red galaxies with higher Sérsic index tend to be dispersion dominated and the dispersions decrease with increasing radius,while the less massive and blue galaxies are rotation supported and the σaperprofiles increase in tandem with rotation curves. Figure 4.The stellar velocity dispersion integrated within elliptical apertures (the area equals π) as a function of radius.The profiles are normalized by the effective radius Re and the dispersion σe within an elliptical aperture of area A=πRe.The profiles are colored by r-band absolute magnitude Mr (left), g–i color(middle),and Sérsic index nSer (right). The dependencies of σaperprofiles on other galactic properties are consistent with the large variations of σaperprofiles across a wide range of morphological types observed in Falcón-Barroso et al.(2017),which analyzed the σaperprofiles for 300 CALIFA galaxies (Sánchez et al.2012).However,the significantly larger sample (approximately 10,000 galaxies) of MaNGA enables a more detailed analysis and provides more accurate aperture corrections for integrated velocity dispersion measurements for specific types of galaxies. Following previous works in the literature (Jorgensen et al.1995;Cappellari et al.2006;Falcón-Barroso et al.2017),we use a power-law function to quantify the slopes of the normalized σaperprofiles as We fit the individual σaperprofiles for each galaxy within a range of [Rin,Rout] defined as where the FWHM is ing-band(from DAP),andRmaxis the largest radius of Voronoi bins,to avoid the PSF effects on the determination of α parameters.As discussed in Section 6 of Falcón-Barroso et al.(2017),beam smearing may affect the integrated velocity dispersion at the very center of galaxies and lead to potential bias in measuring α parameters.However,we argue here that α will not be clearly affected because most data points of the σaperprofiles are the integrated velocity dispersion within much larger apertures compared to the dispersion of PSF.Following Falcón-Barroso et al.(2017),we tried to convolve the MaNGA PSF to the model σaperprofiles when fitting them to the observed ones.In Figure 5,we present the comparison between the α with PSF deconvolved (fitting in a range of [0.1Re,Rmax]) and the α with PSF un-deconvolved (fitting in a range of [FWHM/2.355,Rmax]),and find the two values are in good agreement with a slope of 0.9637±0.0017 and a small rms scatter of Δ=0.018 using the LTS_LINEFIT procedure.Practically,aperture correction is usually applied to correct the velocity second moment measured within a fiber aperture that is comparable to or even larger than the effective radius of the galaxy,to the effective radius.The PSF smearing effect at the inner region of the MaNGA data is not expected to introduce a significant bias to this correction.In our project,we did not include the PSF effect in our fiducial analysis. Figure 5.Comparison of the power-law index α from fitting within FWHMPSF2.355 We divide the full sample into different subsamples based on theirr-band absolute magnitudeMrandg–icolor.There are sixMrbins ranging from −18 to −24(from faint to bright)in a step of 1 mag and six bins ofg–icolor from 0.4 to 1.6(from blue to red).In Figure 6,we present the σaperprofiles color-coded by Sérsic index,which still show large variations in a given narrow bin of(Mr,g–i).Thus,in each (Mr,g–i) bin,we further split the galaxies into different Sérsic index groups,i.e.,nSer<2,2 Figure 6.Normalized integrated velocity dispersion profiles in different Mr and g–i bins,where Mr is the r-band absolute magnitude and g–i color is the difference between g-band and i-band absolute magnitudes.The σaper profiles are colored by the Sérsic index nSer.In each panel within a given (Maper, g–i) bin,the biweight mean profiles for different nSer are shown as blue circles(nSer<2),green triangles(2 We create a lookup table9A Python script is provided in https://github.com/kaizhu-astro/aperture_correction to obtain the correction factors from the lookup table.(Table 1) of aperture corrections for various types of galaxies by assuming a power-law function of σaperprofiles.The table lists the mean and standard deviation of α,which are determined from bootstrapping with 100 iterations,for galaxies within given (Mr,g–i,nSer) bins. Table 1Lookup Table for the Aperture Correction Factors of Integrated Stellar Velocity Dispersion In Figure 7,we investigate the relations between α parameters andMrfor galaxies with differentg–icolor and Sérsic index.Overall,the α values are smaller for brighter(smallerMr),redder(higherg–i)galaxies with highernSer.The smaller α parameters(i.e.,the galaxies have larger central σaper)for galaxies with highernSerare due to the fact that a largernSerimplies a greater concentration of central stellar mass,resulting in an increased central σaperand a steeper σaperprofile. Figure 7.Power-law index α of integrated velocity dispersion profiles as a function of r-band absolute magnitude Mr for different g–i color (see the legends in the right panel)and Sérsic index nSer(see the top of each panel).The horizontal black dashed line is α=−0.04 from Jorgensen et al.(1995),the horizontal black dashed–dotted line is α=−0.063 from Mehlert et al.(2003),and the black solid line is α=−0.066 from the SAURON project(Cappellari et al.2006).The value of MaNGA subset (brown horizontal line),α=−0.033,is taken from de Graaff et al.(2021),whose sample is dominated by the high Sérsic index galaxies but is not selected based on morphology.The gray-shaded squares are taken from the CALIFA survey (Falcón-Barroso et al.2017),which derived α for both early-type and late-type galaxies. The left panel of Figure 7 shows that for galaxies with 0 Similar but weaker trends,where brighter and redder galaxies have smaller α,are also observed in the sample with 2 Our results for the 4 The results of this paper demonstrate that the aperture correction derived from previous literature on early-type galaxies cannot be applied to predict the aperture corrections for galaxies with intermediate Sérsic indices,regardless of their color. The clear trends that α varies withMr,g–i,andnSerhighlight the enhanced accuracy of aperture corrections in this study.However,it is difficult to apply such aperture corrections in reality due to the fact of circular apertures in single-fiber observations.To further account for the effect of aperture shape,we also calculate the σaper,circ,which is also defined as Equation(1)but within a circular aperture with a radius ofRaper.We fit the σaper,circprofiles for each galaxy,which are normalized as to obtain the power-law index αcirc.The αcirccan be applied in real single-fiber observations to obtain the σe. In Figure 8,we show the αcirc−α as a function of axial ratioq≡b/a.As can be seen,the systematic difference between α and αcircis negligible for galaxies withq>0.4,while flat galaxies(q<0.4)tend to have smaller αcircthan α.Given the small fraction(∼20%)of galaxies withq<0.4 in our sample,we do not present the αcircvalues in each (Mr,g–i,nSer),which are expected to be similar to α.As shown in the Appendix,similar trends can be seen if replacing α in Figure 7 with αcirc.However,we also found that the biweight mean σaper,circ/σeprofiles in some(Mr,g–i,nSer)bins cannot be well described by the function,especially for thenSer<2 galaxies that may suffer from strong inclination effects.This is likely due to the fact that the normalization of σaper,circ/σeis nonphysical and will bring uncertainties when stacking the normalized profiles in a given(Mr,g–i,nSer)bin.Thus,we choose to only present the α values and derive an empirical relation between α and αcirc,which relates to the axial ratioqin the form of Figure 8.The αcirc −α as a function of axial ratio q.The α and αcirc are derived from Equations (2) and (4),respectively,while the q is derived from Sérsic fits (Domínguez Sánchez et al.2022).The black dashed curve and the gray-shaded region are the median value and [16th,84th] percentiles.The red curve is the best-fitting empirical relation for all galaxies. One can use Table 1 to obtain α in a given (Mr,g–i,nSer) bin and then use Equation (5) to obtain the αcircif necessary(q<0.4),but one should also be aware of the large scatter of(αcirc−α) for very flat galaxies. We conducted a comprehensive analysis of the aperture corrections for the integrated stellar velocity dispersion σaperusing the full MaNGA sample.With a large sample size of approximately 10,000 galaxies,we were able to study aperture corrections in detail for a diverse range of galaxy types(Figure 1)for the first time.We derived the σaperprofiles for the entire sample (Figure 4) and used a power-law function(Equation (2)) to quantify the profiles of different subsamples based on theirr-band absolute magnitudeMr,g–icolor,and Sérsic indexnSer(Figure 6).The relationships between the power-law index α and the three properties (Mr,g–i,andnSer)are presented in Table 1 and Figure 7. Our analysis revealed several important findings regarding the aperture corrections of the integrated stellar velocity dispersion σaper.First,we observed decreasing trends of the power-law index α with increasingMr,redderg–icolor,and higher Sérsic indexnSer.While the α values of early-type galaxies with highnSer(4 In addition,we established an empirical relation between the power-law index α and αcirc,as shown in Equation (5).Here,αcircis defined as the power-law index derived from the velocity dispersion profile measured within circular apertures,which can be used to calculate σefor circular apertures with any given radius defined by the size of observational fiber.We believe that our findings will enable more precise aperture corrections for single-fiber spectroscopic survey,such as those from the SDSS and Dark Energy Spectroscopic Instrument survey.However,our empirical relations are derived from the MaNGA sample with a median redshift ofz=0.03,and some care should be taken when extrapolated to higher redshift galaxies.A possible solution could be using the higher redshift IFS observations (e.g.,Multi Unit Spectroscopic Explorer) to calibrate the relations. Acknowledgments We acknowledge the support of the National Natural Science Foundation of China(Nos.11988101 and 12022306),National Key R&D Program of China(No.2022YFF0503403),Ministry of Science and Technology of China(No.2020SKA0110100),science research grants from the China Manned Space Project(Nos.CMS-CSST-2021-B01 and CMS-CSST-2021-A01),CAS Project for Young Scientists in Basic Research (No.YSBR-062),and K.C.Wong Education Foundation. Funding for the Sloan Digital Sky Survey (SDSS)-IV has been provided by the Alfred P.Sloan Foundation,the U.S.Department of Energy’s Office of Science,and the participating institutions. SDSS-IV acknowledges support and resources from the Center for High Performance Computing at the University of Utah.The SDSS website is www.sdss.org. SDSS-IV is managed by the Astrophysical Research Consortium for the Participating Institutions of the SDSS Collaboration,including the Brazilian Participation Group;Carnegie Institution for Science;Carnegie Mellon University;Center for Astrophysics—Harvard and Smithsonian;the Chilean Participation Group;the French Participation Group;Instituto de Astrofísica de Canarias;The Johns Hopkins University;Kavli Institute for the Physics and Mathematics of the Universe/University of Tokyo;the Korean Participation Group;Lawrence Berkeley National Laboratory;Leibniz-Institut für Astrophysik Potsdam;Max-Planck-Institut für Astronomie (MPIA Heidelberg);Max-Planck-Institut für Astrophysik (MPA Garching);Max-Planck-Institut für Extraterrestrische Physik;National Astronomical Observatories of China;New Mexico State University;New York University;University of Notre Dame;Observatório Nacional/Ministério da Ciência,Tecnologia e Inovações;The Ohio State University;Pennsylvania State University;Shanghai Astronomical Observatory;United Kingdom Participation Group;Universidad Nacional Autónoma de México;University of Arizona;University of Colorado Boulder;University of Oxford;University of Portsmouth;University of Utah;University of Virginia;University of Washington;University of Wisconsin;Vanderbilt University;and Yale University. Appendix Tests on Using αcirc to Predict σaper,circ Profiles We present two figures(Figures A1 and A2)that are similar to Figures 6 and 7,but σaperprofiles and α are replaced with σaper,circprofiles and αcirc,respectively.We do not recommend directly using αcircto predict σaper,circprofiles.See the text in Section 3.3 for a detailed discussion. Figure A1. The same as Figure 6,but replacing σaper with σaper,circ. Figure A2. The same as Figure 7,but replacing α with αcirc. ORCID iDs1.Introduction
2.Data
2.1.The MaNGA Survey
2.2.Stellar Kinematics
2.3.Sample Selection
3.Results
3.1.Integrated Stellar Velocity Dispersion Profiles
3.2.Slopes of σaper Profiles for Different Types of Galaxies


3.3.Corrections for the Velocity Dispersion Measured within a Circular Aperture

4.Conclusions
 Research in Astronomy and Astrophysics2023年8期
