Effect of Neutrinos on Angular Momentum of Dark Matter Halo
Yu Chen ,Chang-Zhi Lu ,Yu Lu ,Tingting Zhang ,and Tong-Jie Zhang
1 Institute for Frontiers in Astronomy and Astrophysics,Beijing Normal University,Beijing 102206,China;tjzhang@bnu.edu.cn
2 Department of Astronomy,Beijing Normal University,Beijing 100875,China
3 Beijing Planetarium,Beijing Academy of Science and Technology,Beijing 100044,China
4 College of Command and Control Engineering,PLA Army Engineering University,Nanjing 210017,China
5 Institute for Astronomical Science,Dezhou University,Dezhou 253023,China
Abstract Massive neutrinos are expected to affect the large-scale structure formation,including the major component of solid substances,dark matter halos.How halos are influenced by neutrinos is vital and interesting,and angular momentum (AM) as a significant feature provides a statistical perspective for this issue.Exploring halos from TianNu N-body cosmological simulation with the co-evolving neutrino particles,we obtain some concrete conclusions.First,by comparing the same halos with and without neutrinos,in contrast to the neutrino-free case,over 89.71% of halos have smaller halo moduli,over 71.06% have smaller particle-mass-reduced (PMR) AM moduli,and over 95.44% change their orientations of less than 0°.65.Moreover,the relative variation of PMR modulus is more visible for low-mass halos.Second,to explore the PMR moduli of halos in dense or sparse areas,we divide the whole box into big cubes,and search for halos within a small spherical cell in a single cube.From the two-level divisions,we discover that in denser cubes,the variation of PMR moduli with massive neutrinos decreases more significantly.This distinction suggests that neutrinos exert heavier influence on halos’ moduli in compact regions.With massive neutrinos,most halos (86.60%) have lower masses than without neutrinos.
Key words: (cosmology:)dark matter–neutrinos–(cosmology:)large-scale structure of universe–methods:data analysis
1.Introduction
The angular momentum (AM) plays an important role in the formation of dark matter halos.Dark matter halos in equilibrium exhibit some expected general properties,such as a universal density profile (the NFW profile,Navarro et al.1997) of virialized halos in cosmologicalN-body simulations.The universal AM profile of dark matter halos was also carefully investigated by Liao et al.(2017) with Bolshoi cosmological simulation (Klypin et al.2011).In suchN-body simulation for dark matter halos,their measured AMs(although the plural form is Angular Momenta,we still use AMs for simplicity)will vary with the concrete particle sampling in mass resolution (or unit mass) configuration (Bullock et al.2001;Chen et al.2003).Consequently,it is necessary to perform with a finer mass resolution for better computation on AM.
At present,neutrinos are the only detectable dark matter candidate for the usually extremely weak interplay with general substance (Lineros 2017),but their mass has not been known precisely.A heavier neutrino can reduce the small-scale structure in the universe and change the power spectrum of total matter (Yu et al.2017).Accordingly,neutrinos should only be a fraction of dark matter (Massey et al.2015).Nowadays the lower limit on the sum of neutrinos’ mass is≿0.05eV(Olive 2014),and the upper limit isMν≾0.12 eV (Planck Collaboration et al.2020).
The interaction between neutrinos and galactic dark matter halos via neutrino oscillation was explored by de Salas et al.(2016).Furthermore,Yu et al.(2019) believed that neutrinos make a unique contribution to the orientation of the AM fields of galaxies and halos.Based on the halos’AM profile research(Liao et al.2017),it is quite natural to seek what effect neutrinos impose on the AMs of dark matter halos.
Massive neutrinos affect dark matter and the large-scale structure in a linear perturbation (Lesgourgues &Pastor 2006)at the early universe,but their influence now is highly nonlinear(Zhu et al.2014) and complicated for analytic investigation(Castorina et al.2015;Carbone et al.2016).Hence,our current knowledge of neutrinos dynamics mainly relies on numerical simulations.AnN-body simulation with transparent mechanism,tremendous scale and high mass resolution (Liao et al.2017)of dark matter and especially neutrinos is entailed to our research.Although in some previousN-body simulations(Pearson 2014),neutrinos were set to have zero mass and contributed little to dark halos.
Fortunately,one of the world’s largestN-body neutrino simulations,TianNu can be used for our research.Based on a flat ΛCDM model,including more than 3 trillion particles in a giant 1200 h−1Mpc-side-length cube,the TianNu simulation was run on Tianhe-2 supercomputer to obtain a precise CDMneutrino dipole(Inman et al.2017)and to reveal the neutrinos’differential condensation according to their local dark halo density (Yu et al.2017).Additionally,Qin et al.(2018) also used the TianNu data to research the effects of massive neutrinos on the CDM halos’spatial distribution in the form of Delaunay Triangulation (DT) voids.TianNu is an improved version of the public cosmologicalN-body code CUBEP3M(Harnois-Déraps et al.2013) supporting the co-evolution of CDM and neutrinos.
This paper is organized as follows.We make statistics of simulated halos in Section 2,including their variation of AM moduli and orientations with and without neutrinos.We analyze the relation between halo AM modulus and its environmental density in Section 3.Our discussions and conclusions are given in Sections 4 and 5,respectively.
2.Methodology
2.1.Data from TianNu Simulation
As for the TianNu simulation,all of its physical configurations are listed in Yu et al.(2017),and all of its code details are available in Emberson et al.(2017).We just use TianNu and TianZero halos data and run the code of AM statistics.
Two independentN-body simulations,TianNu and TianZero,are performed for comparison.TianNu contains two light species in the background cosmology by CLASS transfer function(Blas et al.2011)and a heavy one(mν=0.05eV)traced by simulated particles,while TianZero only discards massive neutrinos (ormν=0 eV) with the same other conditions.
A flat ΛCDM is applied in the simulations.The density parameters of CDM (Ωc) and baryons (Ωb),reduced Hubble parameter (h),initial tilt (ns) and fluctuations of the power spectrum(mass variance at 8 h−1Mpc,σ8)are assigned as 0.27,0.05,0.67,0.96 and 0.83 separately.Given neutrino density parameter Ων,7Note here,Ων ≡1.68 h−2×10⁻⁵ for Σimνi=0,otherwise Ω ν≡ (9 4 h2 eV)−1Σi mνi.the total matter density parameter is ΩM=Ωc+Ωb+Ων,and it leads to ΩΛ=1 −ΩM.
The simulation is conducted with only 69123CDM particlegroups (mass resolution,Mr,ν=6.9×10⁸M⊙in TianNu andMr,z=7×10⁸M⊙in TianZero)fromz=100 toz=5.At lower redshift,the TianNu is injected with 138243neutrino particlegroups (mass resolution 3×10⁵M⊙) to co-evolve,while the TianZero keeps neutrino-free.Under this preset of mass resolutions,the total masses of the two simulations are almost equal,making Ων≈0.37%ΩM≈0.0011.The simulation information is saved in 21 checkpoints including all positions and velocities,and the data we use are the checkpoints atz=0.01.
A Spherical Overdensity (SO) algorithm (Yu et al.2017) is used to discover halos with their mass in TianZero from about 9×10¹¹to 3.6×10¹⁴M⊙.The final data we get contain two halo sets (TianNu and TianZero),where the properties of each halo are described by seven parameters: its mass,threedimensional orthogonal components of position and AM modulus.The late-time injection of neutrinos makes little impact on the halo’s mass and position,which can be seen in Figure 1.The 10%variations of mass-center position and mass concerning TianZero halos were used in the former studies(Yu et al.2017;Qin et al.2018).However,considering the potential improvement of the program,we adopt an 8% variation,summing up to a 94.9% match rate and 24301359 pairs of halos.
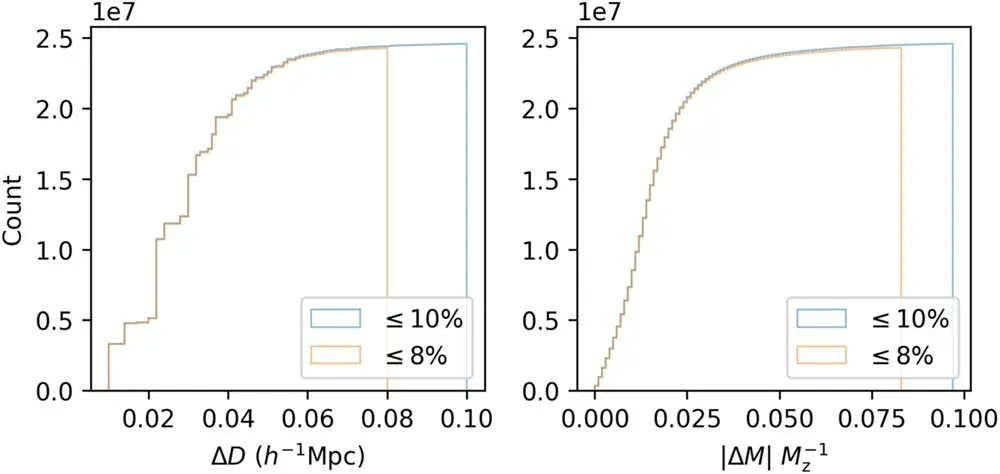
Figure 1.The cumulative count curves of distance and percent mass difference between halo pairs in the left and right panels correspondingly. M is halo mass,and ΔM=abs(Mν −Mz).The blue curve is the 10%-variation case,and the red curve is the 8%-variation case taking up 97.6% of the 10% case.
2.2.Calculation for AM
The AM J of a dark matter halo is obtained by summing up the AMs of all particles within it:
whereirepresents a single particle with its massmi,coordinate ri,and velocity vi.For the AM of every halo,we explore its modulus-and direction-difference individually between two data sets.
We define the modulus of the summed AM from Equation(1)as the halo modulus (J=|J|),and plot them for all halos in Figure 2,showing highly similar distributions of the two sets.A seemingly left-skewed lognormal function can fit the characteristics.
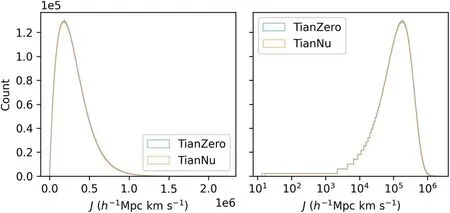
Figure 2.The count curves as functions of halo modulus.The blue and red curves are the TianZero and TianNu counts.The right panel plots the same distribution with logarithmic abscissa.
We plot the ΔJ/Jz(ΔJ=Jν−Jz,Jνis the halo modulus of TianNu andJzis the halo modulus of TianZero) count in the upper panel of Figure 3,and calculate the 1σ range enveloping the median among 100 mass bins with almost same volume in the lower panel of Figure 3.ΔJ/Jzhas the mean of −0.3717%and the median of −0.3655%,while the 89.71% of them have smallerJunder the impact of neutrinos.
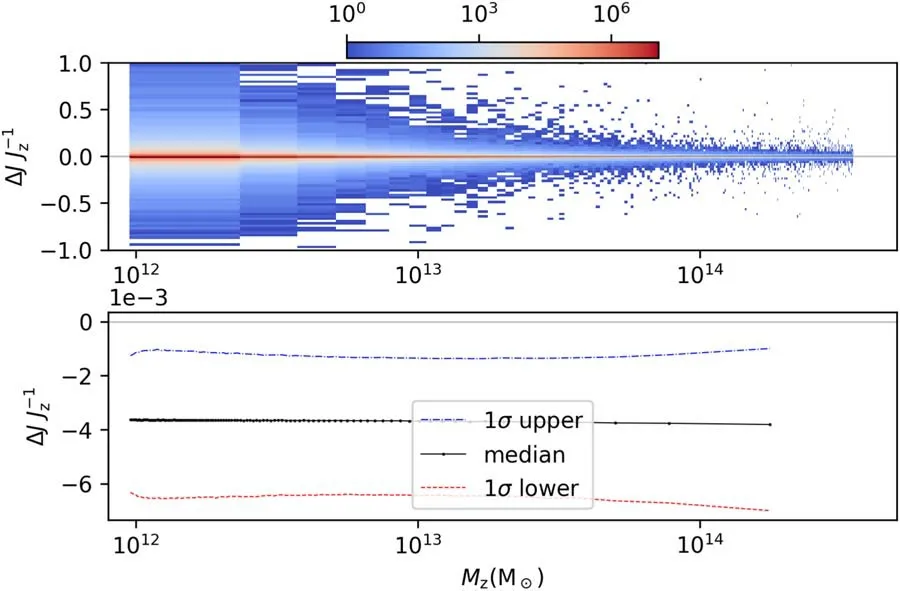
Figure 3.The ΔJ/Jz with respect to TianZero halo mass (Mz).The total count is plotted in the upper panel with a color bar indicating the counting number.In the lower panel,the black dotted line denotes the medians of ΔJ/Jz among 100 mass bins,while the blue dashed-dotted and red dashed lines present the 1σ region around the median.The upper panel uses the bins with the same width in the abscissa,and it is why the bin widths are visually smaller at higher mass.However,the lower panel uses the bins with equal halo amount,so the data points are more concentrated at lower mass.The identical discrepancies would arise in Figures 4,5 and 12.
Considering the different masses of the unit particle-groups in the two simulations,it is indirect to compare their AM modulus variation at a uniform mass and the traditional specific modulus is improper here.Instead,we re-scale their masses on a single particle-group and obtain the particle-mass-reduced(PMR) moduli,since they are the least simulated unit.Therefore,we explore the PMR modulus,Δj/jz(Δj=jν−jz,jz=Jz/Nzandjν=Jν/Nν,NzandNνare the amount of particlegroups forming a halo),and plot its distribution in Figure 4.Δj/jzhas the mean of −0.5493% and the median of−0.5650%,while the 71.06% of them have smallerjunder the impact of neutrinos.
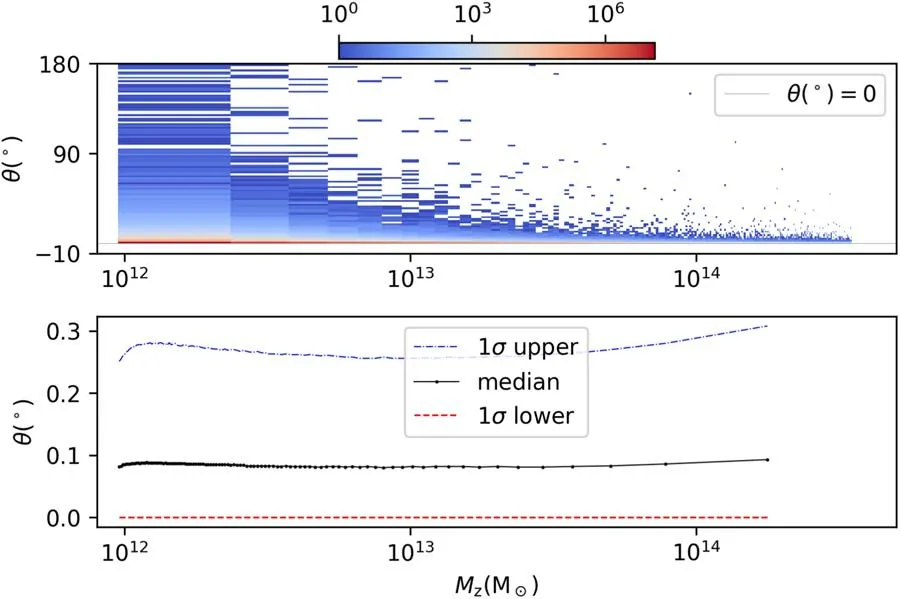
Figure 4.The Δj/jz with respect to Mz.The total count is plotted in the upper panel with a color bar indicating the counting number.In the lower panel,the black dotted line denotes the median of Δj/jz among 100 mass bins,while the blue dashed-dotted and red dashed lines present the 1σ region around the median.
In Figure 5,we plot the directional angular difference θ(degree) between Jνand Jz:
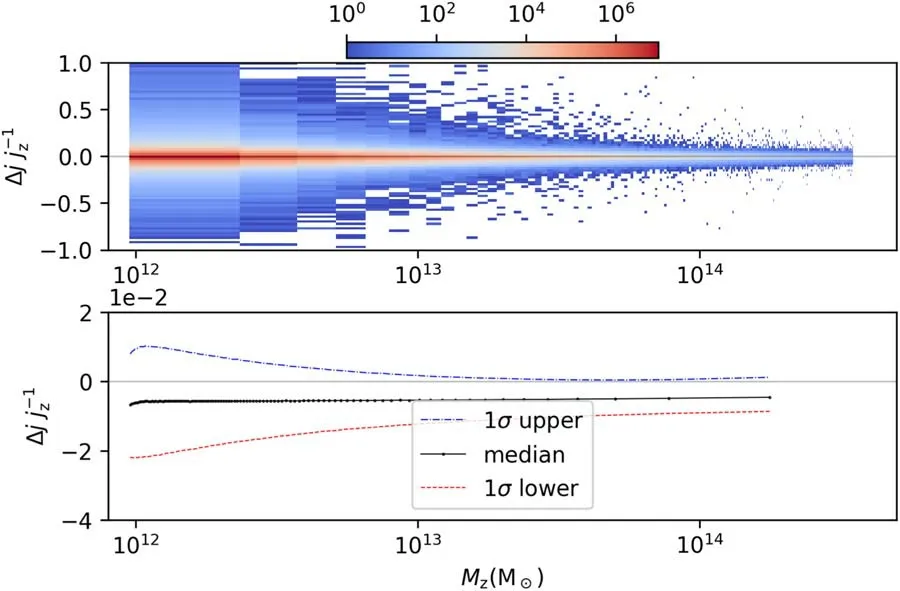
Figure 5.The orientation difference(θ)with respect to Mz.The total count is plotted in the upper panel with a color bar indicating the counting number.In the lower panel,the black dotted line denotes the median of θ among 100 mass bins,while the blue dashed-dotted and red dashed lines present the 1σ region around the median.
They have a mean of 0°.1646 and a median of 0°.0840,while 95.44% of them are smaller than 0°.6500 under the impact of neutrinos.
3.The Influence of Neutrino and Local Density
After investigating the relative modulus and direction variations from the TianNu and TianZero sets independently,we then consider the halos AM moduli with their local density environment.In the two simulations,we obtain the general halo number density of 1.406×10⁻²h3Mpc−3.
Given the irregular and fibrous condensed structures of dark halos,it is difficult to determine their local density precisely by defining an inspected volume with consistent shape and magnitude.Additionally,the enormous amount of halos in data also reduces the efficiency of searching them by pairs.
To avoid a computing-expensive global searching among all dark halos,we first partition the tremendous whole box into many coarse cubes with the side length of 50h−1Mpc.Considering that 100h−1Mpc (10h−1Mpc) is regarded as an upper(lower)boundary of smooth perturbed large-scale(smallscale)structures,the side length between the two values can be proper theoretically.
We then select a cube to explore the halo AM modulus variation with different local densities and whether the neutrinos are added.For instance,in the selected cube with maximum(or minimum)matter density plotted in Figure 6(and Figure 7),we search the 360 halos located in the most compact as well as in the most scarce cells.Every cell is a sphere with a radius of 5h−1Mpc and centered in one halo,which is at least 5h−1Mpc away from the nearest block boundary.To avoid confusion in this paper,we emphasize that we use the box,cube and cell,to denote the space with 1200h−1Mpc side length,50h−1Mpc side length and 5h−1Mpc radius respectively and strictly.For the same block in TianZero and TianNu,we obtain two sets of halos in compact and scarce local regions separately,and call them neoC (Compact-cell halo set in TianNu),neoS (Scarce-cell halo set in TianNu),zeoC (Compact set in TianZero) and zeoS respectively.To collect the halos both in TianNu or TianZero,we select the first 300 halos matched from neoC-zeoC and neoS-zeoS,and name the four data sets as NeoC,NeoS,ZeoC and ZeoS.

Figure 6.The densest cube in the TianZero box.

Figure 7.The sparsest cube in the TianZero box.
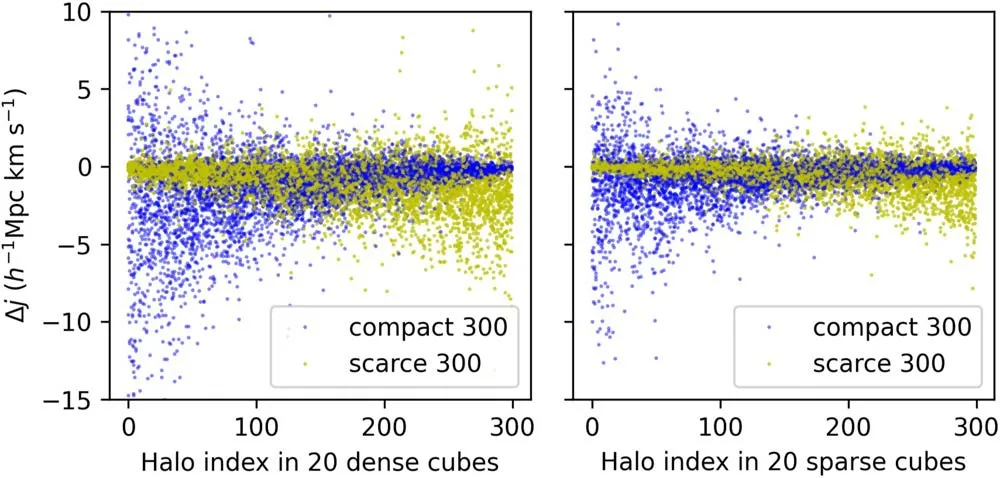
Figure 8.The variation of PMR moduli(Δj)of halos in extreme cubes.The left(or right)panel shows 6000 data points(300 halos from 20 sets)from the 20 densest(or sparsest) cubes.Less halo index indicates it has a more extreme (bigger or smaller) density environment.

Figure 9.The relative variation of PMR moduli(Δj/jz)of halos in extreme cubes.The left(or right)panel shows 6000 data points(300 halos from 20 sets)from the 20 densest (or sparsest) cubes.Less halo index indicates it has a more extreme (bigger or smaller) density environment.
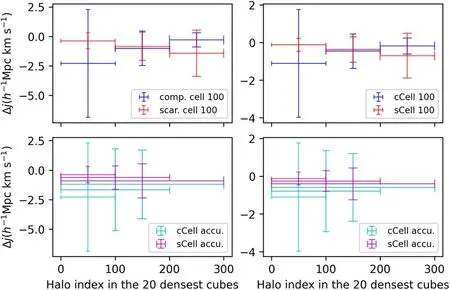
Figure 10.The statistics of Δj.The left (right) panels show the case of the densest (sparsest) cubes.The upper panels show the mean (center point) and standard deviation(vertical error bar)of every 100 halos,and the blue(red)signals denote the halos from compact(scarce)cells.The lower panels show the mean and standard deviation of the first 100,200 and 300 halos,and the cyan (magenta) signals denote the halos from compact (scarce) cells.Less halo index indicates it has a more extreme (bigger or smaller) density environment.
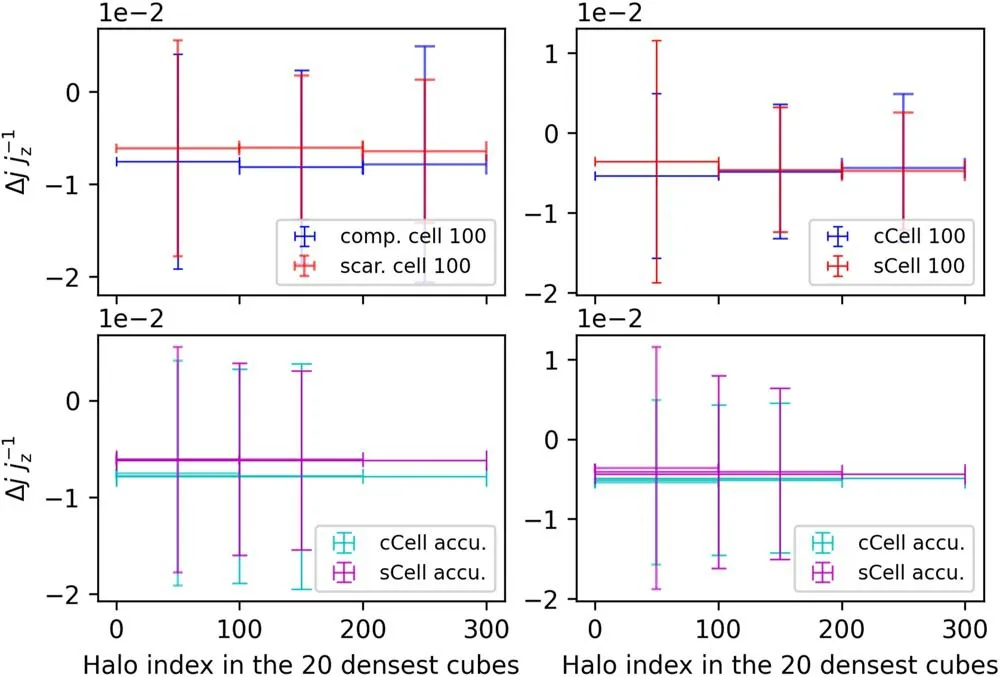
Figure 11.The statistics of Δj.The left (right) panels show the case of the densest (sparsest) cubes.The upper panels show the mean (center point) and standard deviation(vertical error bar)of every 100 halos,and the blue(red)signals denote the halos from compact(scarce)cells.The lower panels show the mean and standard deviation of the first 100,200 and 300 halos,and the cyan (magenta) signals denote the halos from compact (scarce) cells.Less halo index indicates it has a more extreme (bigger or smaller) density environment.
To include more halos in more cubes for a statistical review,we select 300 compact and 300 scarce common halos from each of the 20 densest and 20 sparsest cubes respectively,summing up to four 6000-halo subsets representing the extended NeoC,NeoS,ZeoC and ZeoS sets.
We compute each PMR modulusjfor each halo,and show the distribution of Δjand Δj/jzin the 20 densest and 20 sparsest cubes individually in Figures 8 and 9 separately.As for Δj,the halos in more compact cells(smaller index for compact halos and bigger index for scarce halos) tend to have more notable and negative Δjvalues.However,the Δj/jzseems more averagely negative for each particle-group.
Moreover,we show the mean and standard deviation of Δjand Δj/jzcorrespondingly in Figures 10 and 11 with bin-mode(upper panels) and accumulated-mode (lower panels).The densest 100 compact and 100 scarce halos have similar Δj,although the former have doubled stand deviations.The same situation occurs in the sparsest halos which have smaller stand deviations.With more halos,extreme samples take up less proportion,and the two mean Δj(for compact and scarce halos) approach closer to each other.The Δj/jzstatistics are entirely indistinguishable in the two comparison modes.
4.Discussion
The distribution of halo’s AM moduli (J) in Figure 2 displays a plausible left-skewed lognormal distribution.It is obscure to explain why theJdistribution has a maximum value and this peak also arises from Ueda et al.(1994),Catelan &Theuns (1996),van den Bosch et al.(2002) and Liao et al.(2017).
The relative halo moduli variation(ΔJ/Jz,Figure 3)and AM orientation variation (θ,Figure 5)are roughly the same for allmass-range halos according to their 1σ regions.Through this indicator,only the relative PMR moduli variation (Δj/jz,Figure 4) is more obvious for low-mass halos,which have fewer CDM particle-groups and spatial volumes and are consequently more easily affected.It is noteworthy that a few outliers still occur with huge variations.
Over 70% of ΔJ/Jzand Δj/jzare less than 0,showing that the halo and PMR moduli of TianNu halos are smaller than the TianZero’s in more cases.However,the lower negativeproportion of Δj/jzthan the minus part of ΔJ/Jzindicates there should be some extra escape of particles-groups (and more mass loss) with massive neutrinos to decrease more halo AM modulus and make extra compensation to ΔJ/Jz.Therefore we plot the percent mass variation (ΔM/Mz) in Figure 12.ΔM/Mzhas a mean of −1.2120% and median of−1.2574%,and 86.60% of them is less than 0,supporting the escape.
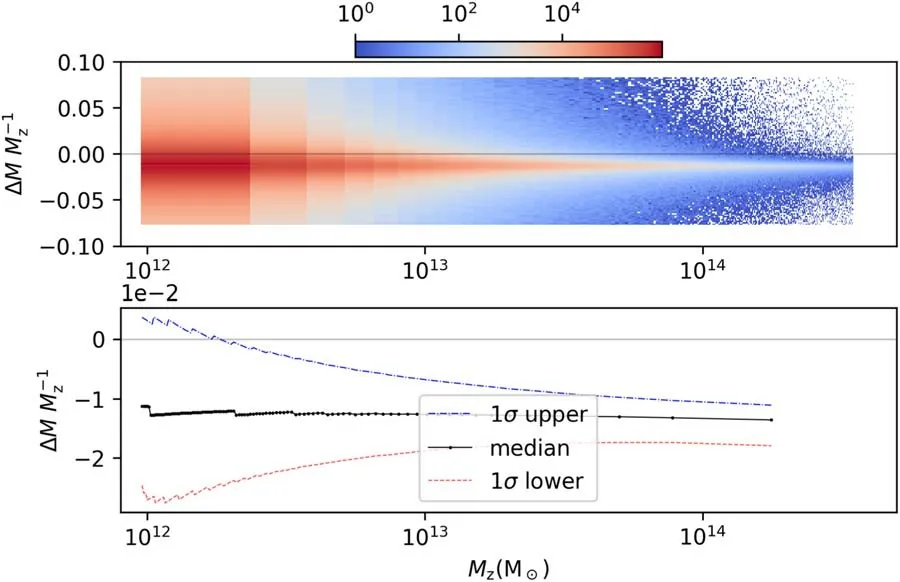
Figure 12.The ΔM/Mz distribution.The ordinate is limited in [−0.08,0.08] because we set the 8% boundary of mass variation in the halo-pair matching process.This truncation and discontinuous mass unit all contribute to the oscillation in our lower-mass statistic.The total count is plotted in the upper panel with a color bar indicating the counting number.In the lower panel,the black dotted line denotes the median of ΔM/Mz among 100 mass bins,while the blue dashed-dotted and red dashed lines present the 1σ region around the median.
There is an interesting phenomenon that Δjinvolves halo’s local density (Figure 10),while Δj/jzmore refers halo’s local density (Figure 4) instead of its mass.The former can be explained because many low-mass halos counted in the cell of a massive central halo are affected by these gravitationally gathered massive neutrinos.The latter reflects that the lowmass halo is a less-robust system since its relative PMRmodulus loss is more visible with the escape of every particlegroup.
We also notice that Liao et al.(2017) carefully research the distribution of geometric parameters for AM modulus in a pure CDM particle simulation.However,we do not record the position,mass and AM of every inner particle.Therefore we cannot study like them in this paper.
The truncated 50h−1Mpc cubes are used to make mass evaluation faster and easier,taking the risk of ignoring some wall-near halos which may be located at a high-density cell of some massive central halo.Besides,the most compact cells are usually centered in a massive CDM halo,while scarce cells usually include more low-mass halos.
The differential condensation effect (Yu et al.2017) exists between the scales of our finer cell (10h−1Mpc) and coarse cube (50h−1Mpc.),where neutrinos are more likely to cluster and collide at some dense regions,flushing away the gathered particles and diminishing the entire halo AM modulus.
TianNu was computed by CUBEP3M in the Tianhe-2 supercomputer.Its halo algorithm has some shortcomings,such as the selection of the halo mass center,the computation of AM,the coarse halo-boundary identification in SO algorithm,the possible maximum gravitational error over 200%(Harnois-Déraps et al.2013),etc.These defects could be alleviated by newer and finer code,for example,the CUBE(Yu et al.2018) which uses FoF halo finder and reduce the maximum gravitational error to 3.5%.As a co-evolution of neutrino and CDM particles,few simulations,such as the cosmo-π (Cheng et al.2020) and 4-trillion-grid Vlasov simulation (Yoshikawa et al.2021),can compete with TianNu in the particle number,box size and its resolution simultaneously.It is difficult to repeat the TianNu using the same or better conditions,and still needs more reliable data to reanalyze in further investigation.
5.Conclusion
In this work,we study the dark halos’ AMs,which are processed from TianNu CDM particle-neutrino co-evolution simulation with a flat ΛCDM model.
Investigating the halo modulus(J),PMR modulus(j),mass and orientation variations due to neutrino-injection,we find the consistency that the 89.71% of ΔJ/Jz,71.06% of Δj/jzand 86.60% of ΔM/Mzunder neutrinos have negative values separately,indicating non-negligible systematic effects such as the free-streaming and differential condensation stimulated by massive neutrinos.Moreover,the 95.44%orientation shifts are less than 0°.65.
Dividing the whole TianNu and TianZero box into coarse cubes,and searching the halos in finer local compact and scarce cells in the 20 densest and sparest cubes,we the distributions of Δjand Δj/jzfor all selected 6000 halos.In general,the Δjvaries and decreases more for the compact halos,and less for the scarce halos,indicating that Δjrelates to the halo’s local density.However,Δj/jzmore connects to halo’s mass according to their 1σ statistic instead of its local density,and more easily change in low-mass halos.
Acknowledgments
We sincerely appreciate the editor and referee’s kind patience and so many suggestions,which help us greatly improve our manuscript.We especially thank Hao-Ran Yu for the discussion about the TianNu simulation and halo AM processing in CUBEP3M.We also thank Cheng-zong Ruan,Kang Jiao and Jian Qin for their discussion and comments.This work was supported by the National Natural Science Foundation of China (grant Nos.11929301 and 61802428).
The code used in this article is CUBEP3M (Harnois-Déraps et al.2013;Yu et al.2017).
 Research in Astronomy and Astrophysics2023年8期
- Research in Astronomy and Astrophysics的其它文章
- Preliminary Exploration of Areal Density of Angular Momentum for Spiral Galaxies
- A Pre-explosion Effervescent Zone for the Circumstellar Material in SN 2023ixf
- Type Ia Supernova Explosions in Binary Systems: A Review
- Velocity Dispersion σaper Aperture Corrections as a Function of Galaxy Properties from Integral-field Stellar Kinematics of 10,000 MaNGA Galaxies
- A Catalog of Collected Debris Disks: Properties,Classifications and Correlations between Disks and Stars/Planets
- Decametric Solar Radio Spectrometer Based on 4-element Beamforming Array and Initial Observational Results
