
Effect of additional cylinders on power-extraction performance of a Savonius vertical-axis wind turbine
2023-06-16 06:50:14YangyangYANJintaoZHANGJunaoSHEWenhaoLIUJianghongDENGJianyangZHU
Yangyang YAN, Jintao ZHANG, Junao SHE, Wenhao LIU, Jianghong DENG, Jianyang ZHU
Research Article
Effect of additional cylinders on power-extraction performance of a Savonius vertical-axis wind turbine

1Institute of Robotics and Intelligent Systems, Wuhan University of Science and Technology, Wuhan 430081, China2Key Laboratory of Metallurgical Equipment and Control Technology, Ministry of Education, Wuhan University of Science and Technology, Wuhan 430081, China
To improve the power-extraction performance of the Savonius vertical-axis wind turbine (S-VAWT), additional cylinders, which are used to control the fluid flow around the wind turbine blade, were introduced into the blade design. In contrast to the traditional numerical method, a mathematical model in the form of a dynamical system was used in this study. A numerical calculation program that could effectively solve the equations of wind-induced rotation of S-VAWT was developed, and combined with the Taguchi experimental method to investigate the influence of additional cylinders on the power-extraction characteristics of the S-VAWT. The results showed that the additional cylinders have a significant impact on the power-extraction performance of the S-VAWT. At 4-m/s wind speed, the average power coefficient of the S-VAWT with additional cylinders is 15% higher than that of the conventional S-VAWT. After construction of the wind turbine prototype and power-extraction tests, the results showed that compared with a conventional S-VAWT, the output power was 29% higher for the S-VAWT with additional cylinders under the same particular conditions.
Additional cylinders; Taguchi experimental method; Savonius vertical-axis wind turbine (S-VAWT); Average power coefficient; Wind-induced rotation
1 Introduction
Development and utilization of clean renewable energy can effectively alleviate the energy shortage caused by depleting fossil fuels, as well as reduce pollution caused by fuel combustion (Ostos et al., 2019; Zhao et al., 2019; Tjahjana et al., 2021). Wind energy is a clean renewable energy source that is widely used in power production in many countries around the world, due to its ability to produce large volumes of energy and its lack of pollution (Ghoneam et al., 2021). The wind turbine is a device that converts wind energy into electrical energy. According to the relative position of the rotating axis and the incoming wind speed, wind turbines can be divided into horizontal-axis wind turbines (HAWTs) (Wang et al., 2015; Li et al., 2018) and vertical-axis wind turbines (VAWTs) (Saha et al., 2008; Manatbayev et al., 2021; Sun and Zhou, 2022). In comparison to HAWTs, VAWTs have the advantages of no yaw, insensitivity to incoming flow direction, and low noise (Jiang et al., 2007; Shaheen et al., 2015; Yin et al., 2017; Sun et al., 2021). The Savonius vertical-axis wind turbine (S-VAWT) is a typical VAWT structure which has attracted more and more attention due to its superior self-starting performance and low manufacturing costs (Nobile et al., 2014; Celik et al., 2020). However, the S-VAWT has low wind-energy utilization efficiency, which severely hinders its prospects for development and application.
To improve the wind-energy utilization efficiency of the S-VAWT, El Baz et al. (2015) installed a baffle downstream of the S-VAWT and studied the influence of baffle-position parameters on the performance of the turbine. The simulation results showed that the baffle improved the aerodynamic performance of the wind turbine, and the maximum power coefficient of the turbine reached 0.3. Takao et al. (2009) studied the effect of a row of arc guide plates on the performance of wind turbines through wind tunnel experiments and concluded that an optimized arc guide plate improved the power-extraction efficiency of a wind turbine by 1.8 times. Irabu and Roy (2007) designed a current-guiding box to improve the rotational speed and output power of a wind turbine at low wind speed. They concluded that the wind turbine was able to obtain the maximum rotational speed and power coefficient at a 0.43 area ratio of the inlet and outlet of the guiding box. Pope et al. (2010) uniformly installed curved guide vanes in the outer ring of the S-VAWT. The results showed that this structure not only increased the stability of wind turbine operation in strong wind but also the aerodynamic performance of wind turbines at a low tip-speed ratio. Nimvari et al. (2020) studied the influence of porous-media deflectors on the power-extraction performance of wind turbines and found that the power coefficient of the wind turbine could be increased by 10% by using the porous-medium deflector.
By analyzing the above literature, we can conclude that installing a flow-control structure outside an S-VAWT can improve its aerodynamic performance. Nevertheless, this approach requires more resources when the entire power-generation unit is operational, and reduces the practical applicability of the turbine. Therefore, in this study, we incorporated the additional cylinders into the wind turbine blade design, and the vortex generated by the additional cylinders was employed to control the fluid flow around the wind turbine blade in order to improve the power-extraction performance of the S-VAWT. In addition, the angular velocity was fixed in advance when studying the rotation of the wind turbine in most published research literature (Almohammadi et al., 2013; Qasemi and Azadani, 2020), but the rotation of the wind turbine is caused by the wind according to the actual situation. Therefore, when analyzing the power-extraction performance of an S-VAWT with additional cylinders, we considered the operation progress of the wind turbine, which reaches a stable state under the interaction between the fluid flow and wind turbine. We developed a numerical calculation program that could effectively solve the wind-induced rotation of S-VAWTs, and combined it with the Taguchi experimental method to optimize the parameters of the additional cylinders. The results of this research provide effective guidance for the development of the S-VAWT with higher power-extraction efficiency and a more compact structure.
2 Physical model and parameter definitions
Compared with a three-blade S-VAWT, a two-blade S-VAWT has higher wind-energy utilization efficiency (Saha et al., 2008). Therefore, we selected an S-VAWT with two blades and a semi-cylindrical shape for research in this study; the top view of the turbine is shown in Fig. 1a.is the rotation radius of the wind turbine,is the inner diameter of a blade, andtis the outer diameter of a blade. According to Akwa et al. (2012) and Ebrahimpour et al. (2019), the maximum power coefficient is obtained when the overlap ratio is 0.2, so we set it to 0.2. To improve the power-extraction performance of the conventional S-VAWT, we introduced additional cylinders into the wind turbine blade design, as shown in Fig. 1b. Two cylinders of the same size were added inside the rotating structure of the wind turbine. Pointis the rotation center of the wind turbine, pointis the blade center, pointis the intersection point of the line passingandpoints and the circle with a radius of, and pointis the center of the additional cylinder. The relative position relationship between the additional cylinders and the S-VAWT was determined using the structural parametersand.denotes the diameter of the circle centered on point.represents the angle betweenand, that is, the turning angle of the centerrelative to.represents the diameter of the additional cylinder. The details of the geometric parameters of the conventional S-VAWT are summarized in Table 1.
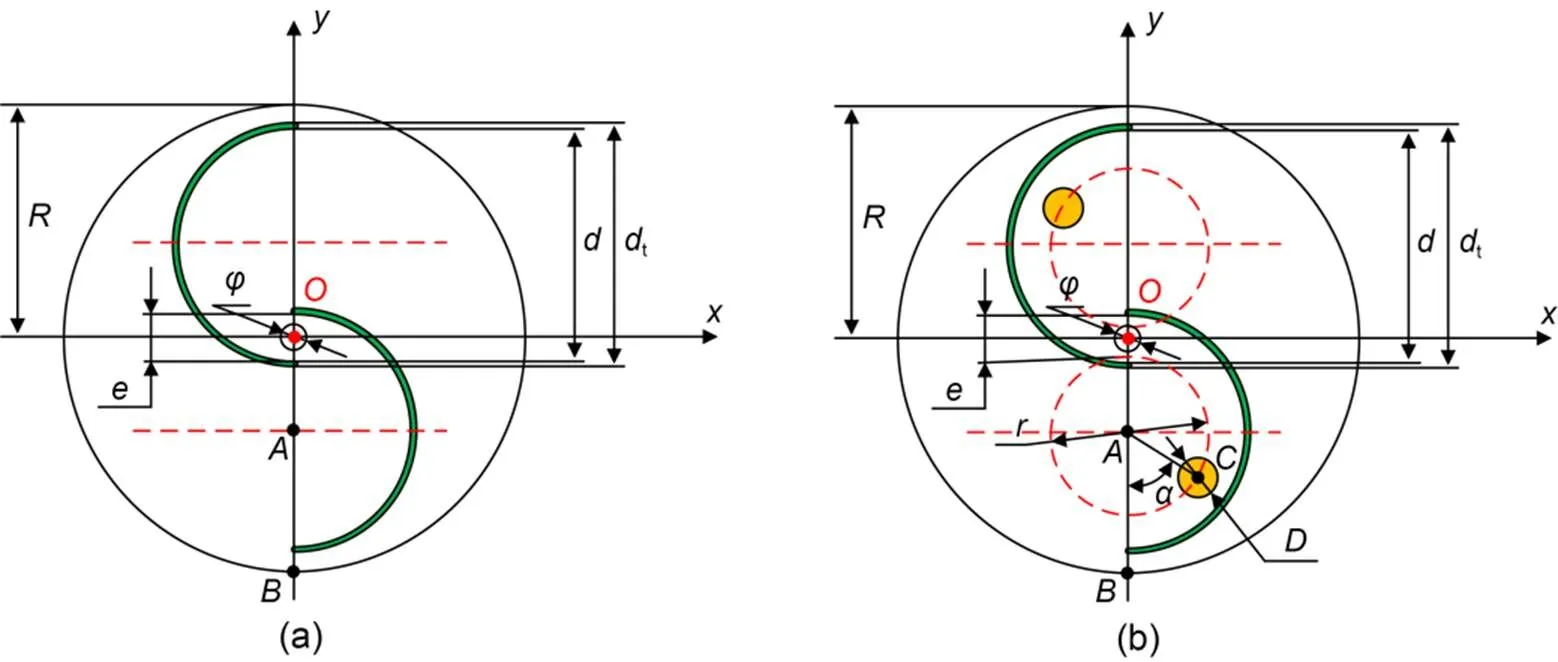
Fig. 1 Top view of wind turbine structure of a conventional S-VAWT (a) and an S-VAWT with additional cylinders (b). φ is the center shaft diameter; e is the overlap distance
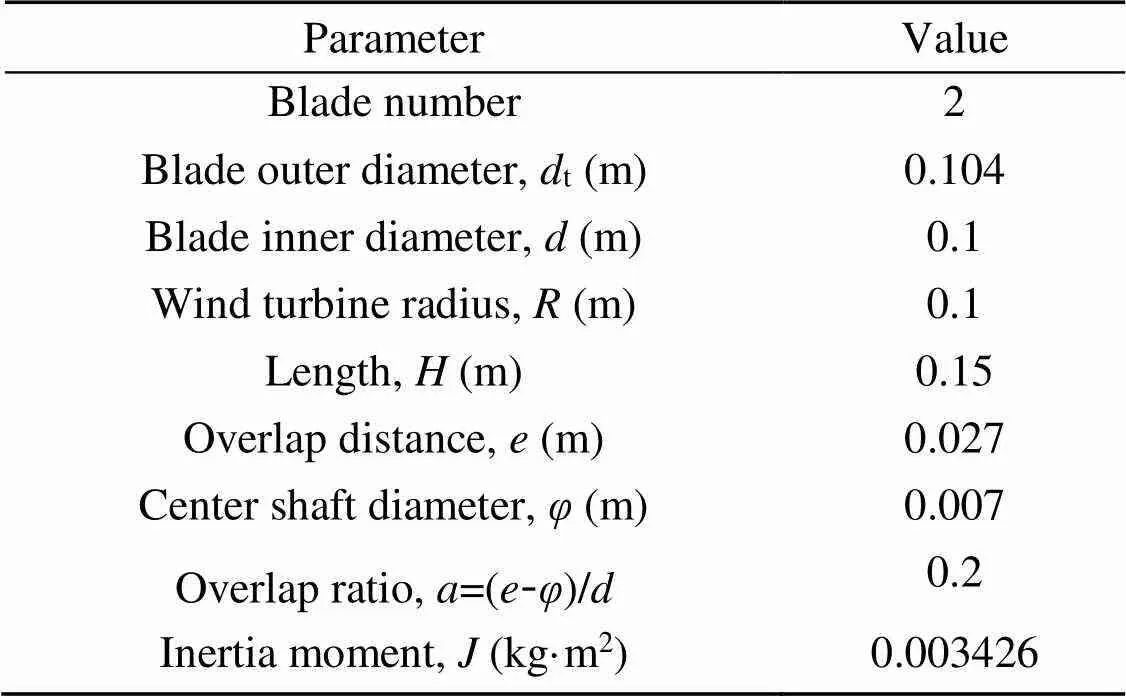
Table 1 Characteristic parameters of a wind turbine


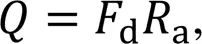
wheredis the resultant force of the pressure difference on both sides of the blades, andais the distance between the rotation centerand the action point of the resultant force. Thus, the power extracted from the wind by the turbine can be obtained:


3 Numerical method and validation
3.1 Numerical method for solving wind-induced rotation S-VAWT
In this study, the designed wind turbine was mainly used to capture low-speed wind energy. The incoming wind speed was fixed at=4 m/s. The Reynolds number () of the wind turbine can be calculated by:
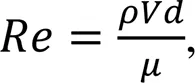
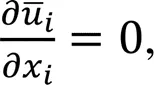
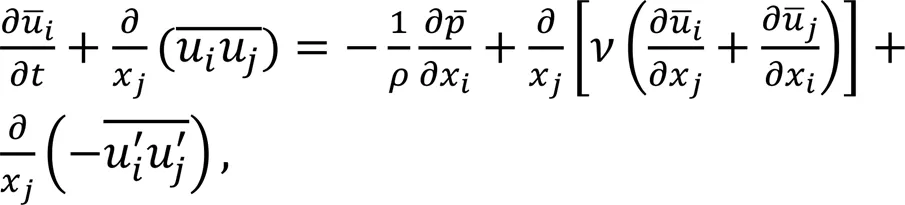
where=1.225 kg/m3;is the characteristic length, which is the single-blade diameter in this case, and=0.1 m;is the kinematic viscosity of the fluid, and=1.48×10⁻⁵Pa·s. After calculation,=3.32×10⁴. According to Oliveira et al. (2001), when>2300, the state of fluid will transform into turbulence. Therefore, the fluid-control equations for the area around the wind turbine are unsteady Reynolds-averaged Navier-Stokes (URANS) equations:
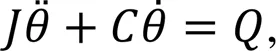
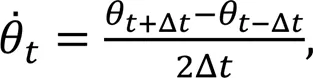
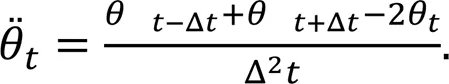
In order to solve Eq. (1), the second-order central difference method is used to discrete Eq. (1). The angular velocity and angular acceleration of the wind turbine at a certain timeare:
Eqs. (10) and (11) are introduced into Eq. (1), and the calculation equation of the azimuth angle with time can be obtained as Eq. (S3). The weak coupling method was used to solve the flow field of the wind-induced rotation of S-VAWT. The control equations (Eqs. (8) and (9)) were solved by Fluent 6.3. The coupling of pressure and velocity was decoupled by the SIMPLE (semi-implicit method for pressure-linked equation) algorithm. The momentum, pressure, turbulent kinetic energy, and turbulent dissipation rate were solved by the second-order upwind. The control equation (Eq. (S3)) was coupled to the fluid solver through the user-defined function (UDF) for the synchronous solution. Wind-induced rotation of wind turbines was realized by dynamic mesh technology. After initialization of the solution program, the control equations (Eqs. (8), (9), and (S3)) were solved successively until the wind turbine generated a stable periodic rotation. The specific solution process is shown in Fig. S2 of the ESM. It should be noted that the accuracy and effectiveness of the numerical model of the wind-induced rotation were verified in detail in the published work of the research group (Zhu and Tian, 2019), and the investigation of the sensitivity of the numerical results to grid density and the iteration time step is shown in Section S1 of the ESM.
3.2 Grid generation and boundary conditions
Fig. 2 shows the grid division and boundary conditions of the computational domain for the S-VAWT numerical simulation. The computational domain was divided by triangular meshes, including the internal rotation domain and the external stationary domain. Based on Almohammadi et al. (2013), we set the left side of the calculation domain to 20away from the rotor shaft of the wind turbine, and applied the velocity-inlet boundary condition. We set the right side of the calculation domain to 40away from the rotor shaft of the wind turbine, and applied the pressure-outlet boundary condition. In order to avoid the influence of the wall effect on the aerodynamic performance of the wind turbine, we set the upper and lower boundaries of the calculation domain to 20away from the rotor shaft of the wind turbine, and applied symmetric boundary conditions. The blade surface had a non-slip wall boundary condition. In order to ensure that the flow details around the blade could be captured during the rotation of the wind turbine, 20 structured mesh boundary layers were used around the blade surface (Zhu and Tian, 2019). Based on the NASA+calculator, the grid height of the first layer was set to 0.01, and the growth rate was set to 1.05 so that the+was maintained near 1.0 during the calculation process.
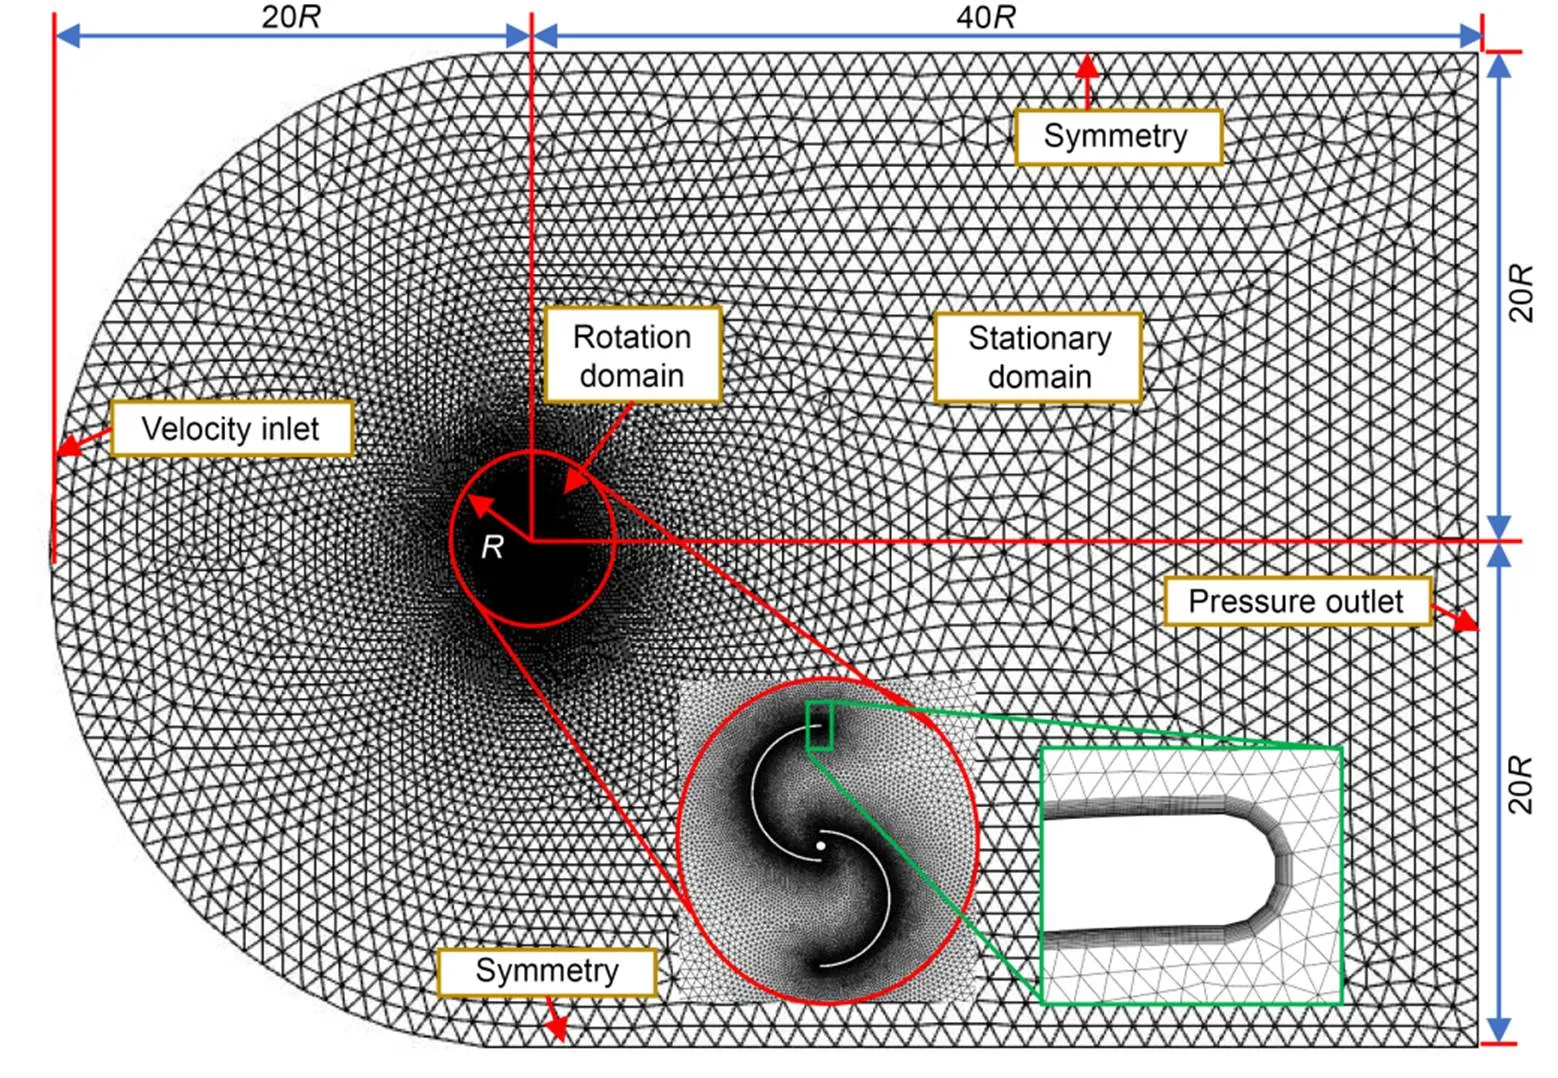
Fig. 2 Computational domain and mesh structure
4 Taguchi experimental design and analysis
4.1 Taguchi experimental design
Taguchi experimental design is a design optimization method for high efficiency and low cost, which was proposed by Genichi Taguchi, and is often used to solve engineering problems (Qasemi and Azadani, 2020). According to Celik et al. (2020), the Taguchi experiment does not list all possible parameter combinations, but only requires specific parameters to be arranged, which can significantly reduce the computational resources required. Therefore, we combined Taguchi design and numerical simulation to optimize the position of additional cylinders. The optimized factors and levels are shown in Table 2.
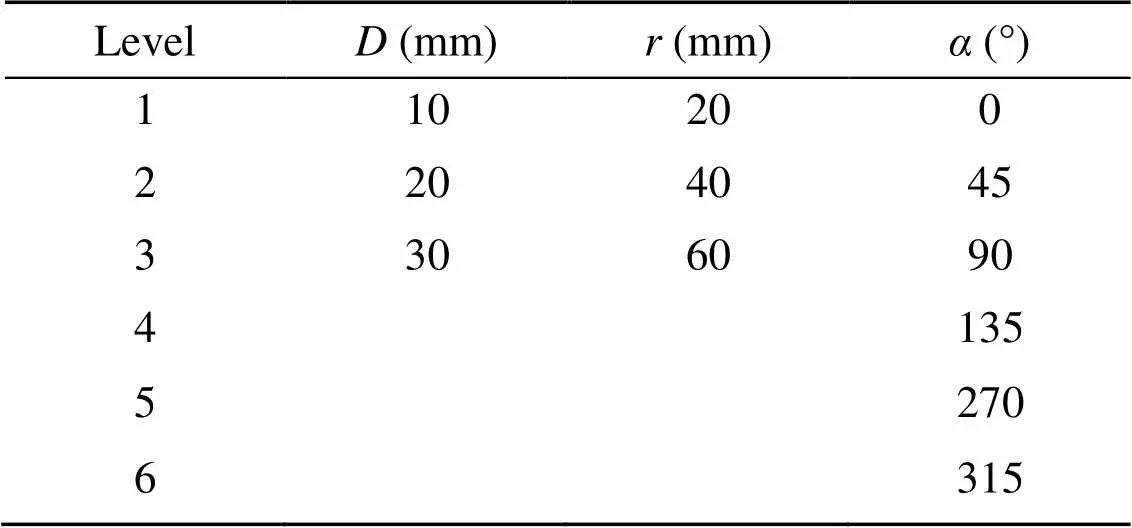
Table 2 Optimized factors and levels
Meanwhile, Table 3 shows a mixed orthogonal experiment table for18(6132) with three factors for,, and.andhad three levels, whilehad six levels. The average power coefficient of the stable rotation wind turbines was selected as the optimization objective. According to Qasemi and Azadani (2020), the greater the signal-to-noise (S/N) ratio, the greater the average power coefficient of the wind turbine, and thus the better the performance of the wind turbine. Therefore, the larger the S/N ratio, the better the evaluation scheme. The S/N ratio calculation equation is:
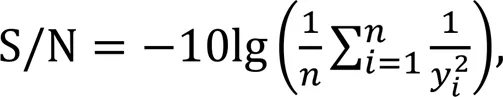
whereis the number of samples, andyis the statistical sample, namely the average power coefficient according to Eq. (6).
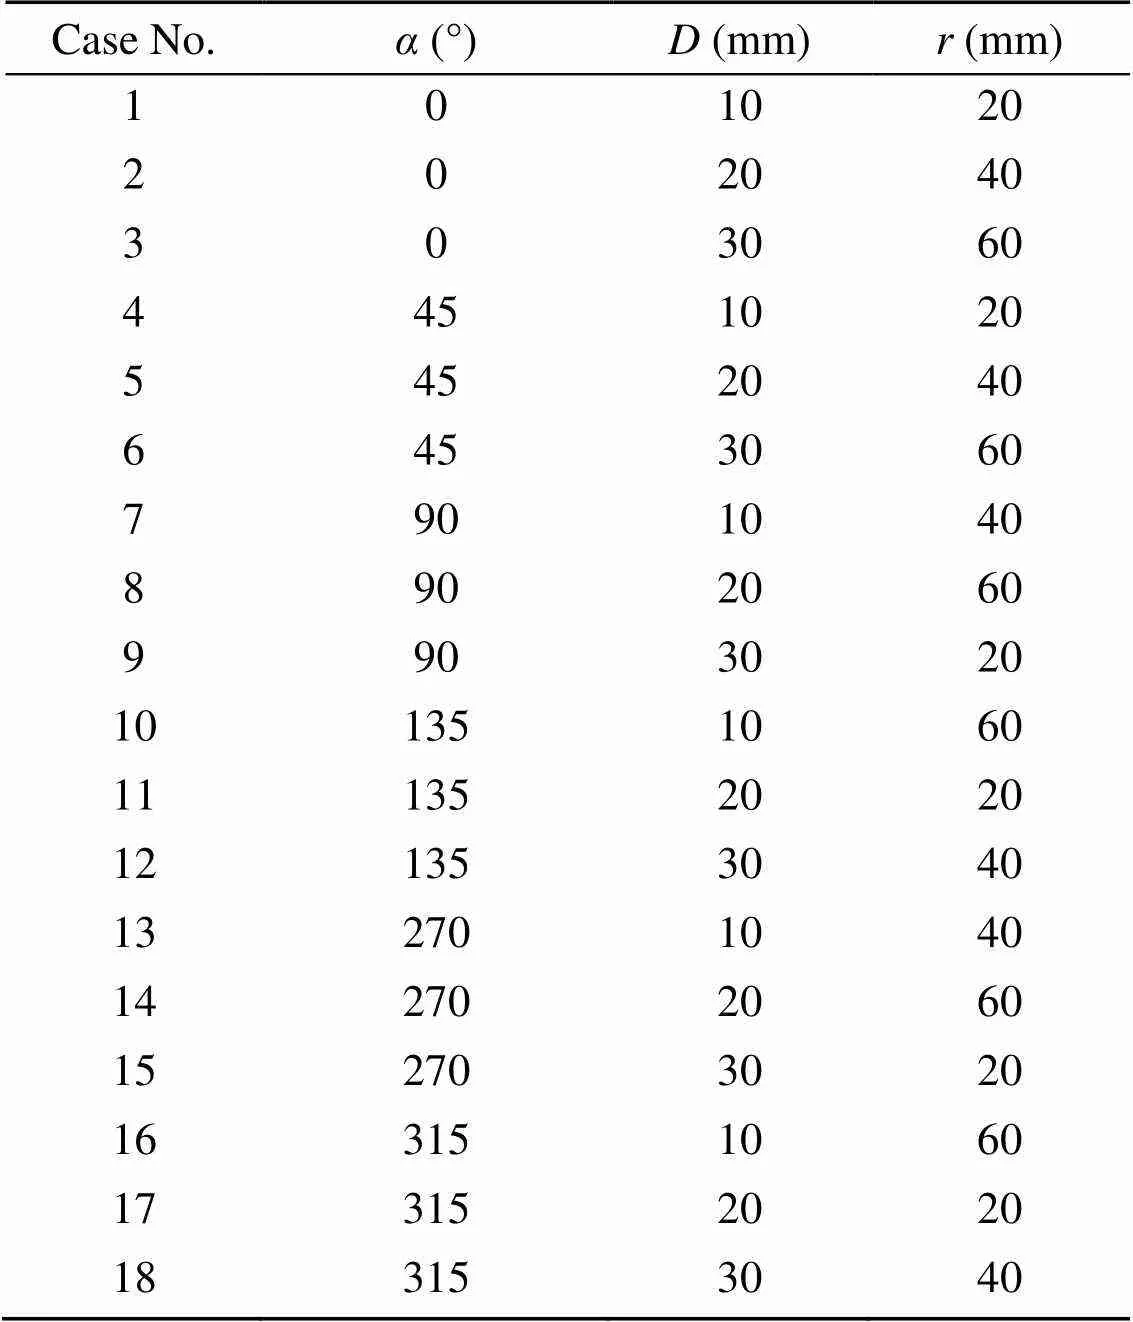
Table 3 Mixed orthogonal experiment array for L18(61 32)
4.2 Analysis of Taguchi results

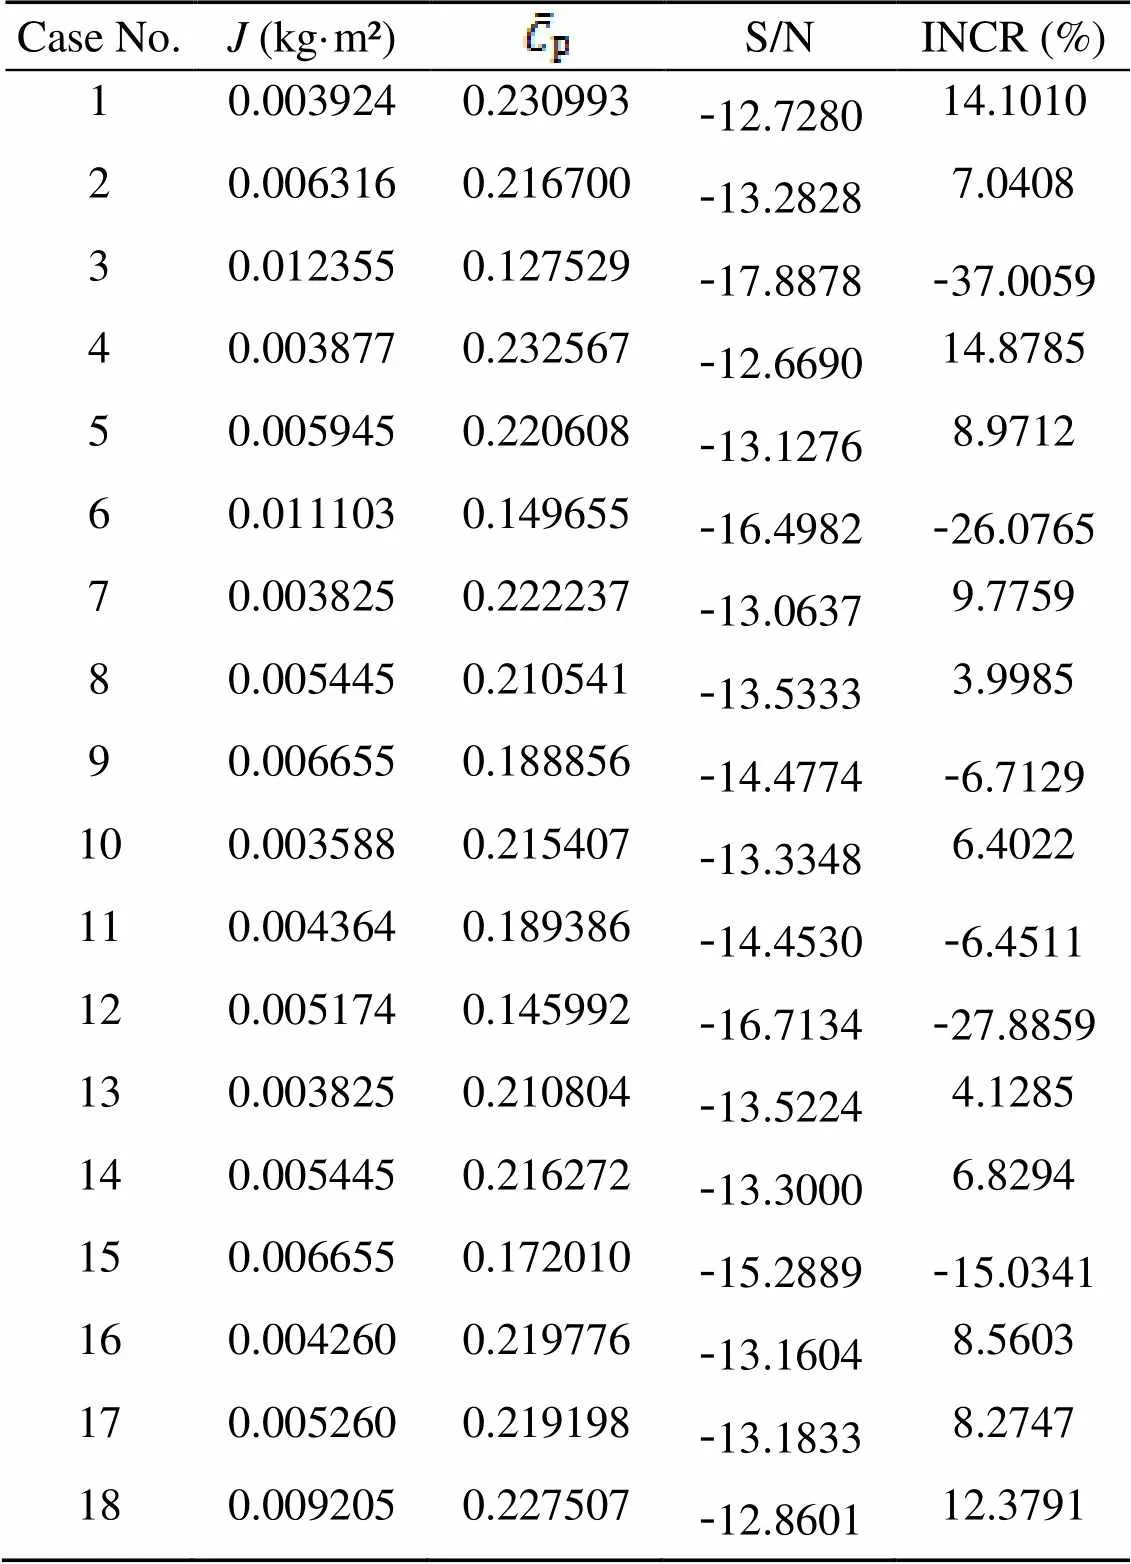
Table 4 Simulation results of Taguchi experiment
In order to determine the effect degree of each factor on the average power coefficient of the wind turbine, the following two dimensionless parameters are defined:
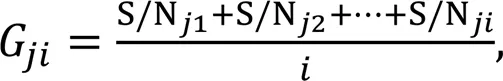


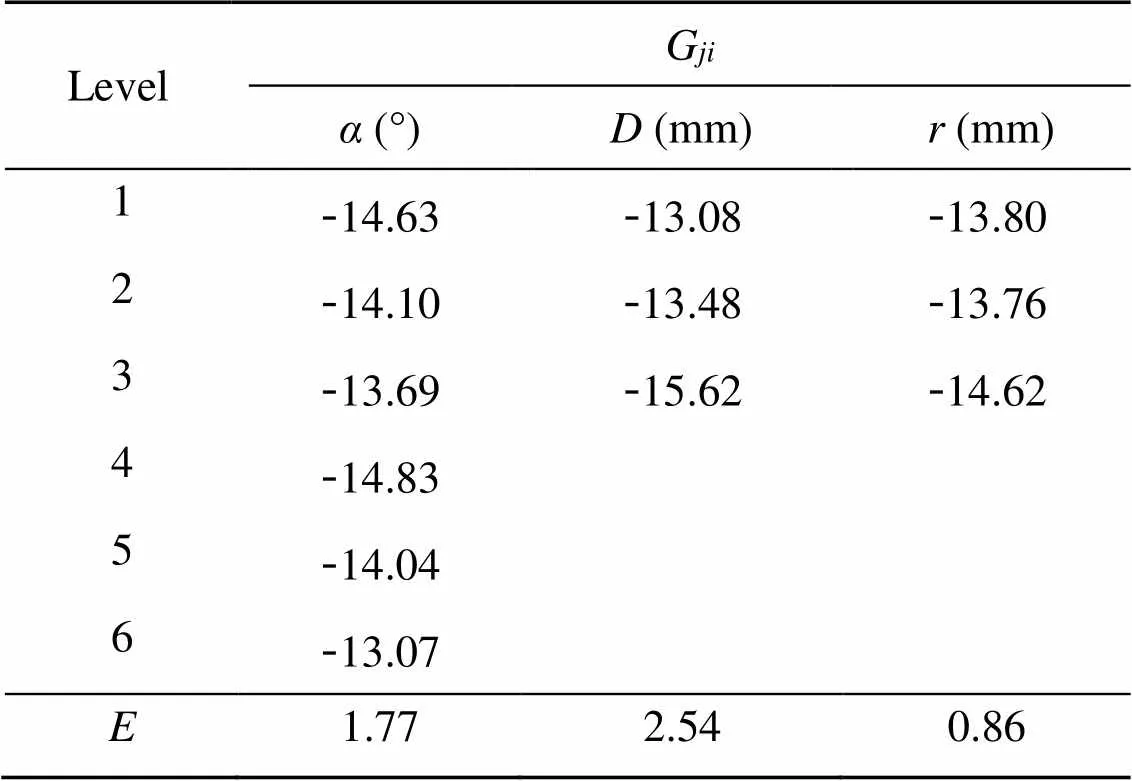
Table 5 Mean S/N ratio Gji of each factor
We used Minitab 19.0 to analyze the mean S/N ratios of various factors at different levels (Mohanavel and Ravichandran, 2022). The analysis results are shown in Fig. 3. It can be observed that the mean S/N ratio offirst increased and then decreased, and then continued to increase as the placement angle became steeper. When=315°, the wind turbine had better aerodynamic performance. When=135°, the average power coefficient of the wind turbine was the lowest. The mean S/N ratio ofdecreased as the diameter of the additional cylinder widened. When=10 mm, the aerodynamic performance of the wind turbine was the best. The mean S/N ratio offirst increased and then decreased as the level rose. When=40 mm, the mean S/N ratio was at its maximum.
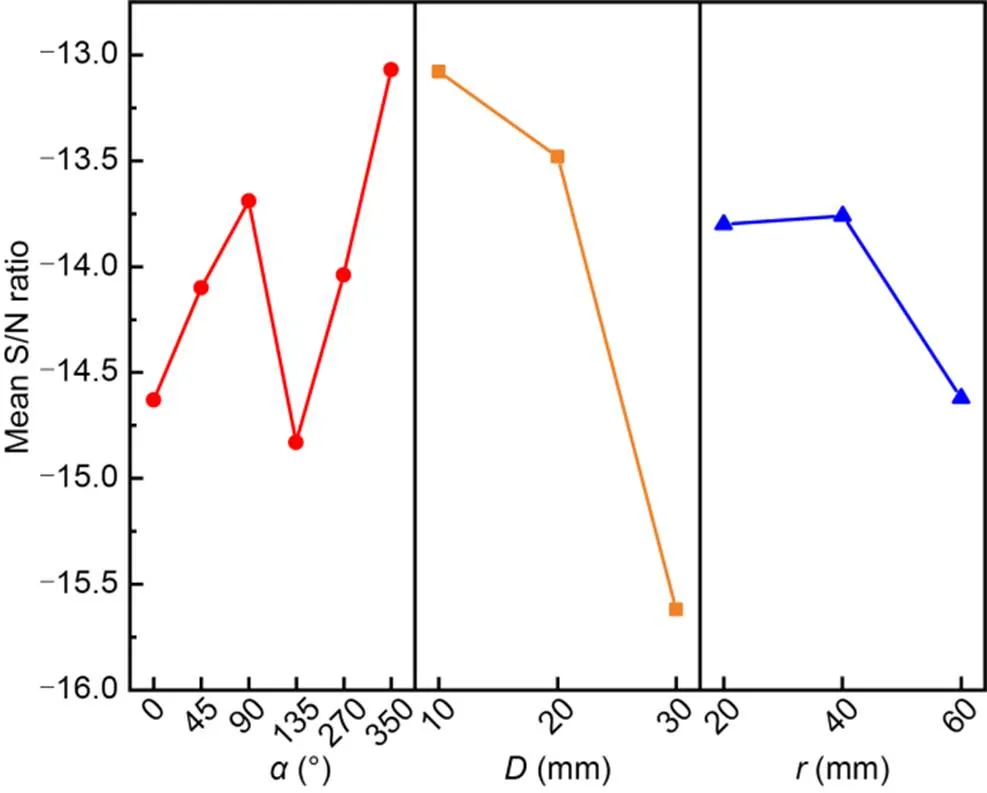
Fig. 3 Mean S/N ratios of various factors at different levels
Using the information in Table 5, the effect degreeof each factor on the average power coefficient of the wind turbine can be obtained, as shown in Fig. 4. It can be seen that the values ofof,, andare 1.77, 2.54, and 0.86, respectively. Therefore, the effect degrees of the above three factors on the average power coefficient of the wind turbines are ranked as>>. The results show thathas the greatest influence on the average power coefficient of the wind turbine, followed by, andhas the least influence.
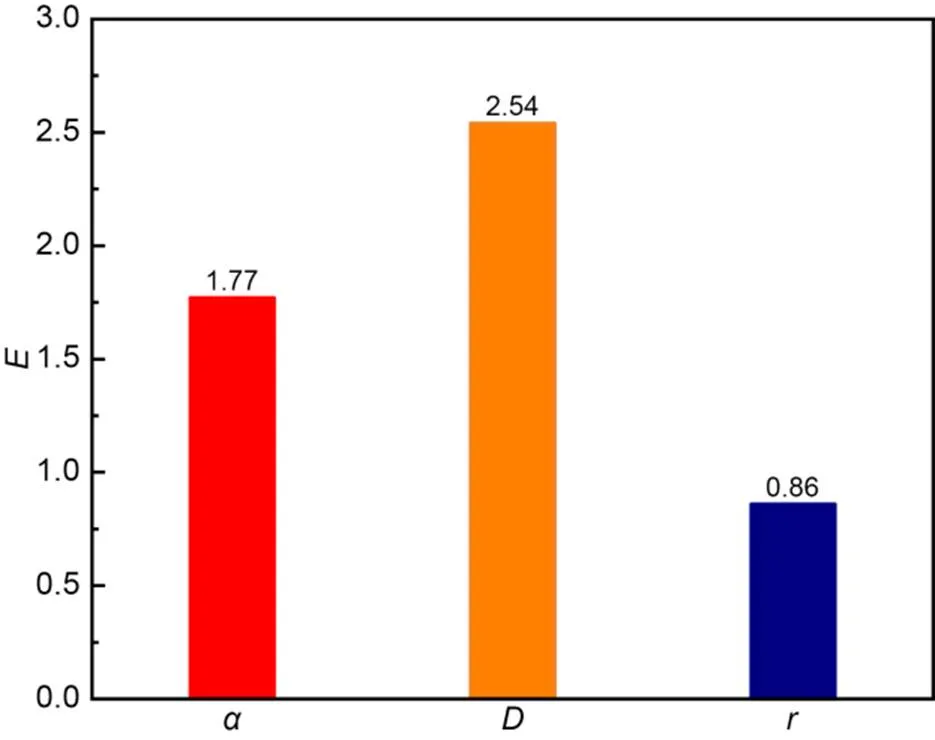
Fig. 4 Effect degrees of different factors
4.3 Performance comparison between S-VAWT with additional cylinders and conventional S-VAWT
To explore how the additional cylinders improve the energy utilization performance of the S-VAWT, the angular velocity, torque coefficient (m), power coefficient (p), vorticity contours, and pressure contours of Case 4 (=45°,=10 mm, and=20 mm) and the conventional S-VAWT are analyzed in detail below.
4.3.1Influence on wind turbine angular velocity
Fig. 5 shows the angular velocity with time of Case 4 and a conventional S-VAWT. It is clear that the change trends of the two curves are roughly the same. However, the stable angular velocity of Case 4 is 34.5 rad/s, while that of the conventional S-VAWT is slightly lower at 32.0 rad/s. The reason for this phenomenon is that after introducing the additional cylinders into the blade design of a conventional S-VAWT, the additional cylinders change the flow-field structure inside the conventional S-VAWT so that it has a higher stable angular velocity.
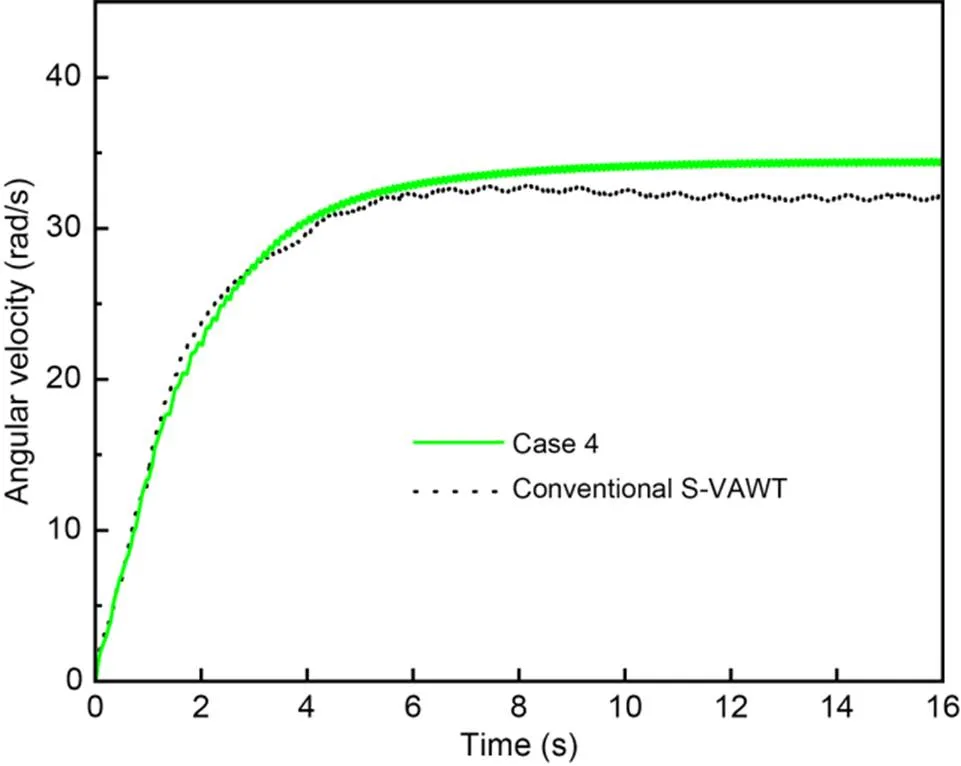
Fig. 5 Angular velocities with time of Case 4 and a conventional S-VAWT
4.3.2Influence on wind turbine torque coefficient and power coefficient
We used Eqs. (4) and (5) to draw the torque coefficient and power coefficient curves for Case 4 and a conventional S-VAWT in a stable rotation cycle, as shown in Fig. 6. In a rotation cycle, the torque coefficients of the two wind turbines have the same variation trend, and both reach their peak value when=100° and=280°, as shown in Fig. 6a. However, the performance of Case 4 is significantly better than that of the conventional S-VAWT in the upwind region. When=100°, the maximum torque coefficient of Case 4 is 56.4%, which is 7.6% higher than that of the conventional S-VAWT. This means that the S-VAWT with additional cylinders has better aerodynamic performance at this azimuth. When the wind turbine operates in the downwind region, the torque coefficient of Case 4 is always slightly higher than that of the conventional S-VAWT. When=10° and=190°, the torque coefficient curves of the two wind turbines essentially coincide. In a rotation cycle, the average torque coefficient of Case 4 is 27.06%, which is about 7% higher than that of the conventional S-VAWT.
Fig. 6b plots the power coefficient curves of both wind turbines for one cycle. It is evident that the change trend of the power coefficient of the two wind turbines is similar. When=100° and=280°, the two wind turbines reach the power coefficient peaks. However, when=100°, the power coefficient of Case 4 is 48.38%, which is 15.85% higher than that of the conventional S-VAWT at the same azimuth. The power coefficient of Case 4 is always slightly higher than that of the conventional S-VAWT when the wind turbine operates in the downwind region. In a rotation cycle, the average power coefficient of Case 4 is 23.26%, approximately 15% higher than that of the conventional S-VAWT.
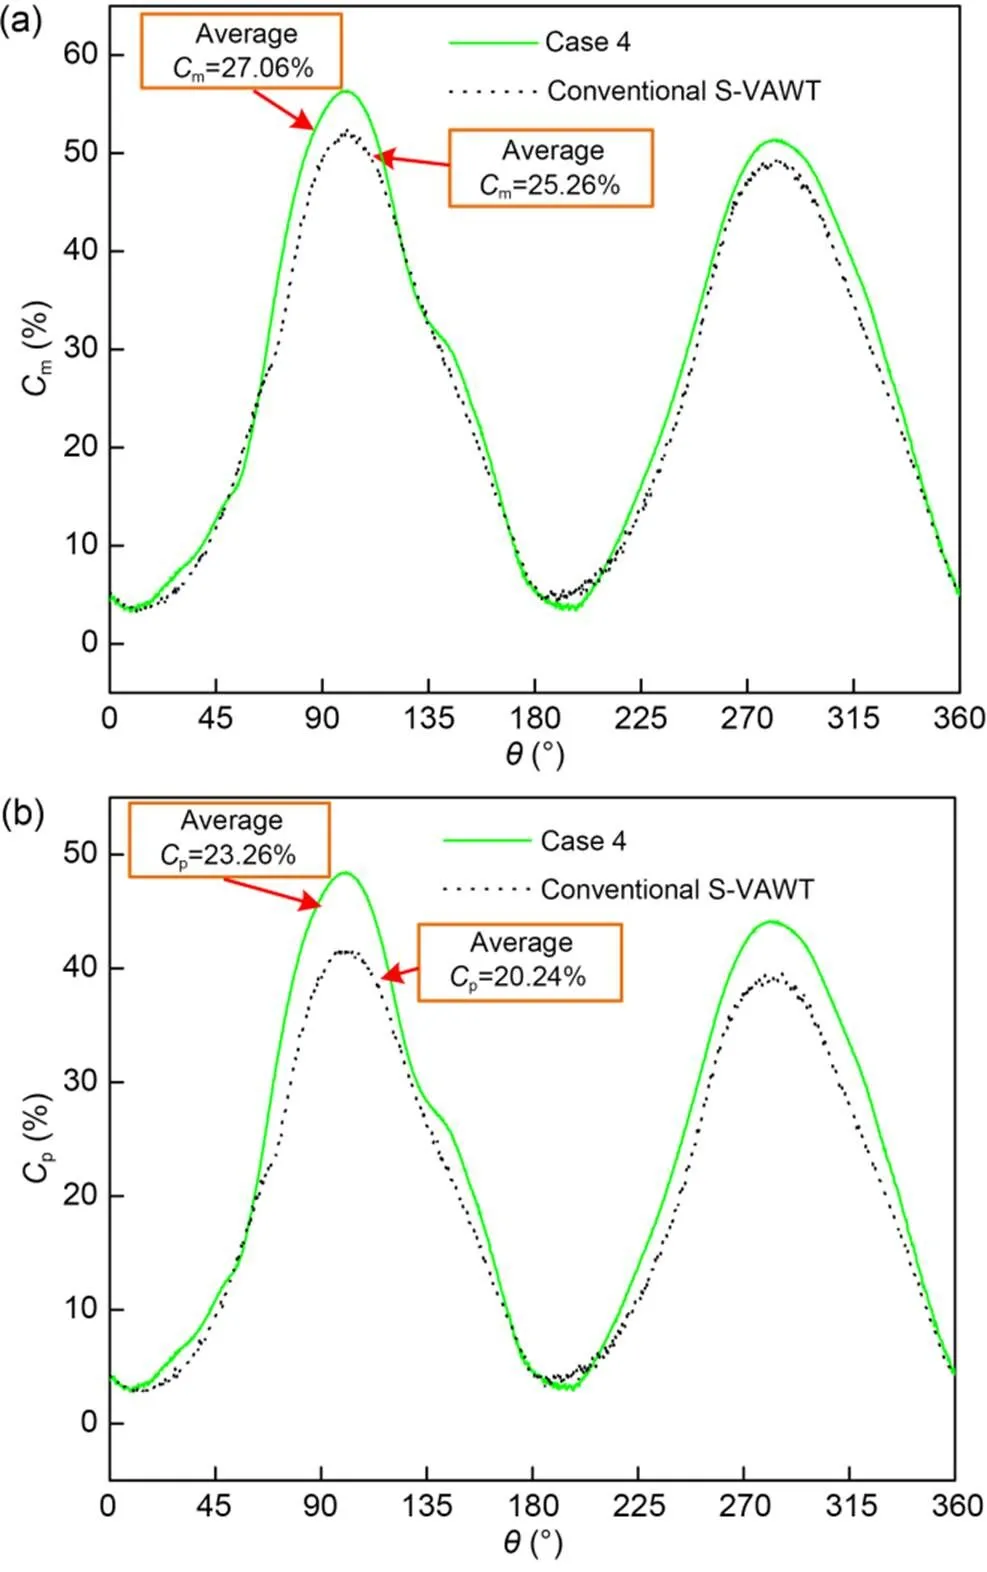
Fig. 6 Torque and power coefficients of a single cycle for Case 4 and a conventional S-VAWT: (a) torque coefficient (Cm); (b) power coefficient (Cp)
4.3.3Vorticity contours
In order to reveal the internal mechanism that improves the average power coefficient of the S-VAWT with additional cylinders, we plotted the vorticity contours at=10°, 100°, 190°, and 280° after the wind turbine reached a stable rotation cycle (Fig. 7). It can be seen that when=10° or 190°, the vortex distribution of the two wind turbines is basically the same. This is also the reason why the torque coefficient curves of the two wind turbines are coincident at this azimuth, as shown in Fig. 6a. When=100° or 280°, the shedding speed of the vortex which acts on the concave surface of the return blade is faster in Case 4, due to the influence of the additional cylinders; this causes greater differential pressure on both sides of the blade. Therefore, the power coefficient of the S-VAWT with additional cylinders is larger than that of the conventional S-VAWT at this azimuth.
4.3.4Pressure contours
Fig. 8 shows the pressure contours of the two wind turbines after reaching a stable rotation cycle at=10°, 100°, 190°, and 280°. When=10° or 190°, there is a large area of high pressure on the concave surface of the forward blade and a large area of low pressure on its convex surface. For Case 4, when=100°, the concave surface of the return blade has a larger high-pressure zone and the convex surface of the return blade has a larger low-pressure zone, resulting in a larger differential pressure on both sides of the blade and higher wind turbine torque. This is also the main reason why the average power coefficient of Case 4 is larger than that of the conventional S-VAWT. However, when=280°, the primary reason for the increase of the average power coefficient of Case 4 is that the concave surface of the forward blade has a larger high-pressure zone and its convex surface has a larger low-pressure zone.
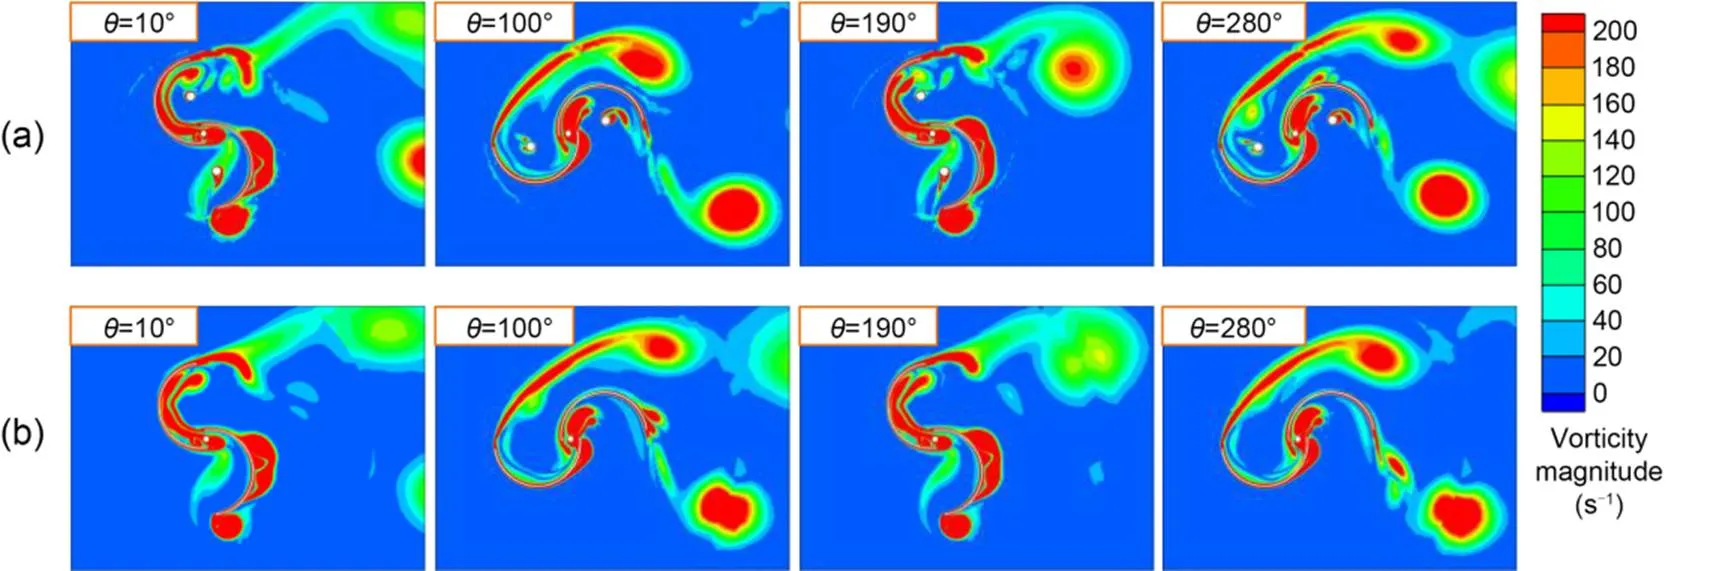
Fig. 7 Comparison of vorticity contours between Case 4 (a) and a conventional S-VAWT (b) at θ=10°, 100°, 190°, and 280°
5 Experimentation
5.1 Experimental setup
Based on the results from numerical simulation, we fabricated an S-VAWT with additional cylinders (=45°,=10 mm, and=20 mm) to test its output power at a wind speed of 4 m/s. The experimental device is shown in Fig. 9. In order to obtain better manufacturing accuracy and surface quality, the S-VAWT with additional cylinders was made of polylactic acid (PLA) with a 3D printer (A5s, JGMAKER, China) which had printing dimensions of 305 mm (length)×305 mm (width)×320 mm (height). For the prototype, the infill density was set to 100% and the layer height was set to 0.1 mm.
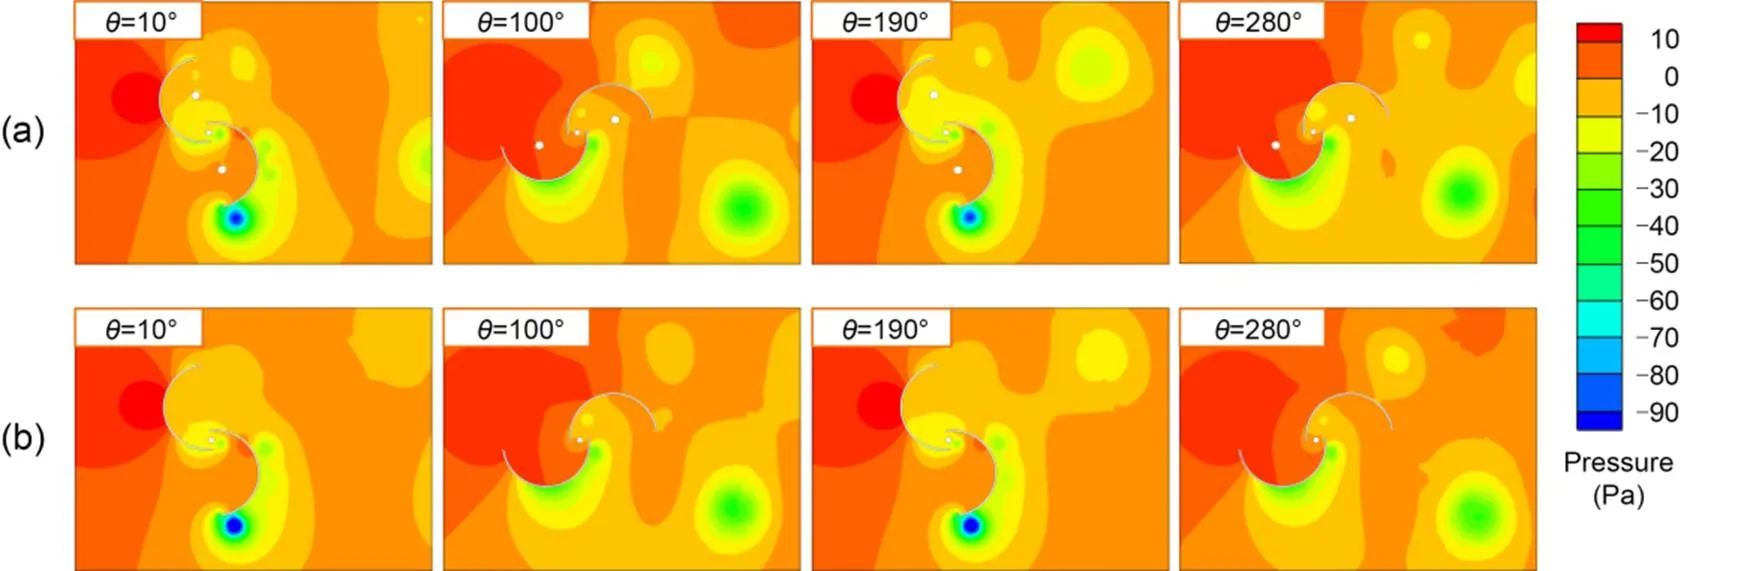
Fig. 8 Comparison of pressure contours between Case 4 (a) and a conventional S-VAWT (b) at θ=10°, 100°, 190°, and 280°
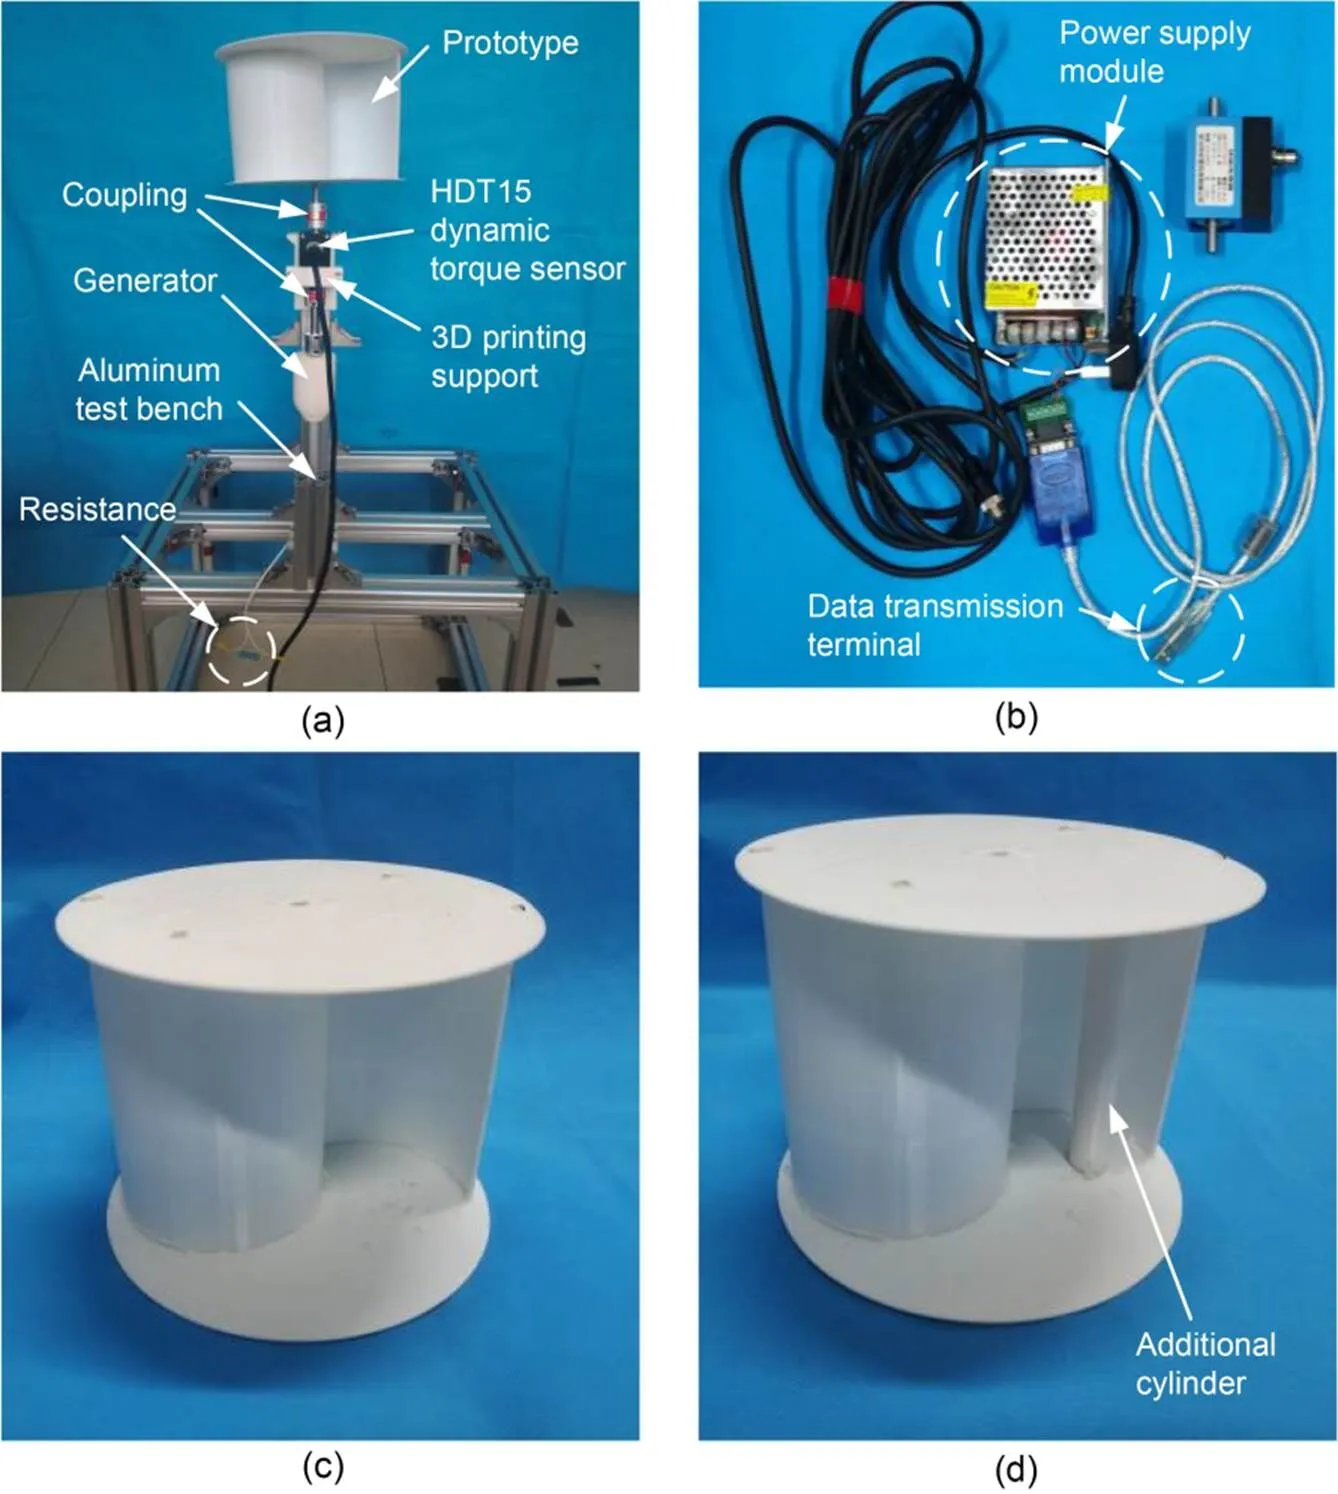
Fig. 9 Experimental facility: (a) test rig; (b) data acquisition device; (c) conventional S-VAWT; (d) S-VAWT with additional cylinders
To facilitate measurement of the torque and angular velocity of the S-VAWT, the transmission shaft of the wind turbine was connected with the input shaft of the dynamic torque sensor (HDT-15, SEASON, China), which had a precision level of 0.3% FS (full scale) and a range of 0.1 N·m, through the coupling. Another coupling was used to connect the output shaft of the dynamic torque sensor with the electromagnetic generator, which had a load resistance of 10 kΩ. The electromagnetic generator and its supporting device were fixed on the aluminum test bench with hinged parts.
To obtain the appropriate experimental location, we used the following method to determine the experimental position of the prototype: after the wind source was opened, the wind speed at a certain point was measured 10 times by an anemometer in front of the wind source, and the average value was taken. The measured results showed that the experimental position was 0.65 m from the front of the wind source and 1.05 m from the ground.
After determining the experimental position, we mounted the conventional S-VAWT and the S-VAWT with additional cylinders on the experimental platform. After the wind speed was stable, the wind turbine was adjusted to the same starting position as the numerical model, and the HDT15 dynamic torque sensor was used for data acquisition. The collected data was displayed in Labview.
5.2 Experimental results
In order to ensure the repeatability of the experiment, we collected the torques and angular velocities of the conventional S-VAWT and Case 4 five times, for 300 s each time. The average value of the five collected angular velocities is shown in Fig. 10a. The starting time of the two wind turbines was basically the same, but the stable value of the angular velocity of Case 4 was higher than that of the conventional S-VAWT. We also found that after the two wind turbines ran for 50 s, the angular velocity reached a stable state. Therefore, we selected the average torque and average angular velocity values to calculate the output power of the conventional S-VAWT and Case 4 in the range of 200–300 s. As shown in Fig. 10b, the average angular velocity of the conventional S-VAWT was 28.7925 rad/s and the average torque was 0.000338 N·m. The average angular velocity of Case 4 was 34.0275 rad/s, and the average torque was 0.000370 N·m. The output power is the product of average angular velocity and average torque in the range of 200–300 s. After calculation, the output power was 0.00973 W and 0.01259 W for the conventional S-VAWT and Case 4, respectively, which indicates that the average output power of Case 4 was about 29% higher than that of the conventional S-VAWT. This conclusion is consistent with the numerical calculation analysis.
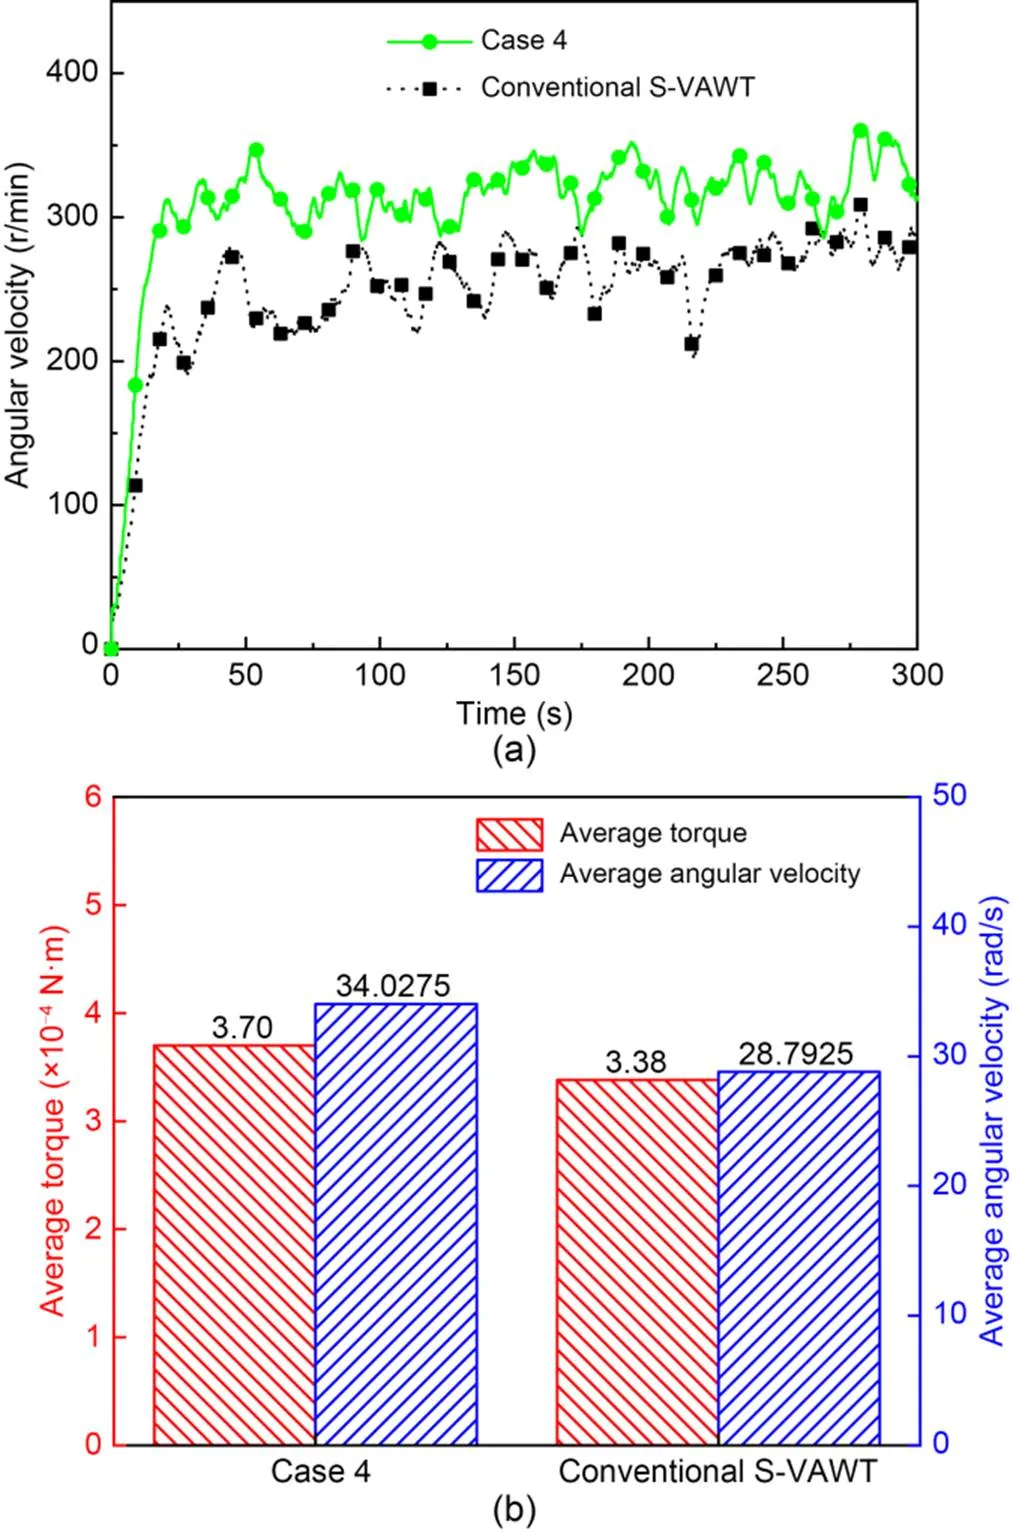
Fig. 10 Comparison of the conventional S-VAWT and Case 4: (a) angular velocity; (b) average torque and average angular velocity in the range of 200–300 s
6 Conclusions
In order to improve the low-wind-energy utilization of the existing S-VAWT wind turbine design, we introduced additional cylinders into the blade design. We developed a numerical calculation program that could effectively solve the wind-induced rotation of the S-VAWT and combined it with the Taguchi experimental method in order to systematically analyze the influence of additional cylinders on the power-extraction characteristics of the S-VAWT. Finally, based on the numerical simulation results, we made the wind turbine prototype and carried out a power-extraction experiment. The main conclusions are as follows:
1. Additional cylinders effectively improve the aerodynamic performance of S-VAWTs. When=45°,=10 mm, and=20 mm, compared with the conventional S-VAWT, the average torque coefficient and average power coefficient of the S-VAWT with additional cylinders are about 7% and 15% higher, respectively (whenis fixed at 0.0015 kg·m2/s).
2. The influence of three characteristic parameters of the S-VAWT with additional cylinders on the average power coefficient is ranked as>>. This indicates that the cylindrical diameter has the greatest impact on the power-extraction performance of the wind turbine. Selecting smaller-diameter cylinders can improve the average power coefficient.
3. The main reason for the better average power coefficient of the S-VAWT with additional cylinders is that they accelerate the shedding speed of the vortex. This acts on the concave surface of the return blade, which leads to greater differential pressure on both sides of the blade.
4. Compared with a conventional S-VAWT, the output power was 29% higher for an S-VAWT with additional cylinders under the same particular conditions, which is consistent with the simulation results.
This work is supported by the National Natural Science Foundation of China (No. 51975429).
Yangyang YAN designed the research and wrote the first draft of manuscript. Jianyang ZHU supervised and administrated the project. Jintao ZHANG and Wenhao LIU helped to organize the manuscript. Junao SHE and Jianghong DENG revised and edited the final version.
Yangyang YAN, Jintao ZHANG, Junao SHE, Wenhao LIU, Jianghong DENG, and Jianyang ZHU declare that they have no conflict of interest.
Akwa JV, da Silva Júnior GA, Petry AP, 2012. Discussion on the verification of the overlap ratio influence on performance coefficients of a Savonius wind rotor using computational fluid dynamics., 38(1):141-149. https://doi.org/10.1016/j.renene.2011.07.013
Almohammadi KM, Ingham DB, Ma L, et al., 2013. Computational fluid dynamics (CFD) mesh independency techniques for a straight blade vertical axis wind turbine., 58:483-493. https://doi.org/10.1016/j.energy.2013.06.012
Celik Y, Ma L, Ingham D, et al., 2020. Aerodynamic investigation of the start-up process of H-type vertical axis wind turbines using CFD., 204:104252. https://doi.org/10.1016/j.jweia.2020.104252
Ebrahimpour M, Shafaghat R, Alamian R, et al., 2019. Numerical investigation of the Savonius vertical axis wind turbine and evaluation of the effect of the overlap parameter in both horizontal and vertical directions on its performance., 11(6):821. https://doi.org/10.3390/sym11060821
El Baz AM, Mahmoud NA, Hamed AM, et al., 2015. Numerical modelling of Savonius wind turbine with downstream baffle. ASME Turbo Expo 2015: Turbine Technical Conference and Exposition. https://doi.org/10.1115/GT2015-43992
Gan D, 2021. Optimization Design and Performance Analysis of Savonius Vertical Axis Wind Turbine Blade. MS Thesis, Hubei University of Technology, Wuhan, China(in Chinese).
Ghoneam SM, Hamada AA, Sherif TS, 2021. Dynamic analysis of the optimized Savonius vertical axis wind turbine composite blades., 143(5):054502. https://doi.org/10.1115/1.4050519
Irabu K, Roy JN, 2007. Characteristics of wind power on Savonius rotor using a guide-box tunnel., 32(2):580-586. https://doi.org/10.1016/j.expthermflusci.2007.06.008
Jiang ZC, Yasuaki D, Zhang SY, 2007. Numerical investigation on the flow and power of small-sized multi-bladed straight Darrieus wind turbine., 8(9):1414-1421. https://doi.org/10.1631/jzus.2007.A1414
Li ZQ, Wu YK, Hong J, et al., 2018. The study on performance and aerodynamics of micro counter-rotating HAWT., 161:939-954. https://doi.org/10.1016/j.energy.2018.07.049
Manatbayev R, Baizhuma Z, Bolegenova S, et al., 2021. Numerical simulations on static vertical axis wind turbine blade icing., 170:997-1007. https://doi.org/10.1016/j.renene.2021.02.023
Mohanavel V, Ravichandran M, 2022. Optimization of parameters to improve the properties of AA7178/Si3N4composites employing Taguchi approach., 14(4):1381-1394. https://doi.org/10.1007/s12633-020-00917-0
Nimvari ME, Fatahian H, Fatahian E, 2020. Performance improvement of a Savonius vertical axis wind turbine using a porous deflector., 220:113062. https://doi.org/10.1016/j.enconman.2020.113062
Nobile R, Vahdati M, Barlow JF, et al., 2014. Unsteady flow simulation of a vertical axis augmented wind turbine: a two-dimensional study., 125:168-179. https://doi.org/10.1016/j.jweia.2013.12.005
Oliveira TAC, Cocchini U, Scarpello JT, et al., 2001. Pervaporation mass transfer with liquid flow in the transition regime., 183(1):119-133. https://doi.org/10.1016/s0376-7388(00)00576-7
Ostos I, Ruiz I, Gajic M, et al., 2019. A modified novel blade configuration proposal for a more efficient VAWT using CFD tools., 180:733-746. https://doi.org/10.1016/j.enconman.2018.11.025
Pope K, Rodrigues V, Doyle R, et al., 2010. Effects of stator vanes on power coefficients of a Zephyr vertical axis wind turbine., 35(5):1043-1051. https://doi.org/10.1016/j.renene.2009.10.012
Qasemi K, Azadani LN, 2020. Optimization of the power output of a vertical axis wind turbine augmented with a flat plate deflector., 202:117745. https://doi.org/10.1016/j.energy.2020.117745
Saha UK, Thotla S, Maity D, 2008. Optimum design configuration of Savonius rotor through wind tunnel experiments., 96(8-9):1359-1375. https://doi.org/10.1016/j.jweia.2008.03.005
Shaheen M, El-Sayed M, Abdallah S, 2015. Numerical study of two-bucket Savonius wind turbine cluster., 137:78-89. https://doi.org/10.1016/j.jweia.2014.12.002
Sun XJ, Zhou DH, 2022. Review of numerical and experimental studies on flow characteristics around a straight-bladed vertical axis wind turbine and its performance enhancement strategies., 29(3):1839-1874. https://doi.org/10.1007/s11831-021-09640-4
Sun XJ, Zhu JY, Li ZJ, et al., 2021. Rotation improvement of vertical axis wind turbine by offsetting pitching angles and changing blade numbers., 215:119177. https://doi.org/10.1016/j.energy.2020.119177
Takao M, Kuma H, Maeda T, et al., 2009. A straight-bladed vertical axis wind turbine with a directed guide vane row—effect of guide vane geometry on the performance., 18(1):54-57. https://doi.org/10.1007/s11630-009-0054-0
Tjahjana DDDPT , Arifin Z, Suyitno S, et al., 2021. Experimental study of the effect of slotted blades on the Savonius wind turbine performance., 11(3):100249. https://doi.org/10.1016/j.taml.2021.100249
Wang JW, Yuan RY, Dong XQ, et al., 2015. Time resolved particle image velocimetry experimental study of the near wake characteristics of a horizontal axis wind turbine., 16(7):586-595. https://doi.org/10.1631/jzus.a1400332
Yin XX, Lin YG, Li W, 2017. Modeling and loading compensation of a rotary valve-controlled pitch system for wind turbines., 18(9):718-727. https://doi.org/10.1631/jzus.A1500072
Zhao T, Zhang X, Zheng M, et al., 2019. Variation of energy utilization efficiency with respect to inlet wind speed for eight-blade modified Savonius rotor by CFD approach., 16(14):1287-1294. https://doi.org/10.1080/15435075.2019.1671404
Zhu JY, Tian CB, 2019. Effect of rotation friction ratio on the power extraction performance of a passive rotation VAWT., 2019:6580345. https://doi.org/10.1155/2019/6580345
Section S1, Figs. S1–S4, Eqs. (S1)–(S3)
Jianyang ZHU, zhujy@wust.edu.cn
June 7, 2022;
Revision accepted Nov. 25, 2022;
Crosschecked Mar. 14, 2023
© Zhejiang University Press 2023
 Journal of Zhejiang University-Science A(Applied Physics & Engineering)2023年6期
- Journal of Zhejiang University-Science A(Applied Physics & Engineering)的其它文章
- Investigation of flow characteristics in a rotor-stator cavity under crossflow using wall-modelled large-eddy simulation
- A stability locomotion-control strategy for quadruped robots with center-of-mass dynamic planning
- Compressive properties of a novel slurry-infiltrated fiber concrete reinforced with arc-shaped steel fibers
- Two-stage identification of interlayer contact loss for CRTS III prefabricated slab track based on multi-index fusion