
Two-stage identification of interlayer contact loss for CRTS III prefabricated slab track based on multi-index fusion
2023-06-16 06:35:18WeiDUJuanjuanRENKaiyaoZHANGShijieDENGShuyiZHANG
Wei DU, Juanjuan REN, Kaiyao ZHANG, Shijie DENG, Shuyi ZHANG
Research Article
Two-stage identification of interlayer contact loss for CRTS III prefabricated slab track based on multi-index fusion
Wei DU, Juanjuan REN, Kaiyao ZHANG, Shijie DENG, Shuyi ZHANG
MOE Key Laboratory of High-Speed Railway Engineering, School of Civil Engineering, Southwest Jiaotong University, Chengdu 610031, China
To accurately identify the potential contact loss of the China railway track system (CRTS) III prefabricated slab track, a finite element model with contact loss of self-compacting concrete (SCC) under transient impact was established. Then the vertical accelerations near impact points on the track slab surface were extracted to obtain damage-sensitive indices in the time and frequency domains. The indices were initially normalized to obtain independent items of evidence before the Dempster-Shafer (D-S) evidence theory was used to fuse these into one. Finally, a two-stage identification was performed to identify the damaged SCC area, comprising a rough identification (Stage I) and a precise identification (Stage II). The research results show that the damage indices extracted based on the transient impact response change abruptly at the damage location, and that can be used for damage identification. However, the use of a single index to determine the damage of the impact point may be misjudged. In Stage I, five damage indices of acceleration were fused to magnify the difference between the damaged point and undamaged point, thereby improving the accuracy of finding damage. In Stage II, in the area where more impact points were added, a fusion of three indices of acceleration response, that is, the absolute mean of the time domain, the maximum amplitude of the frequency domain, and the power density ratio, further narrowed down the area where damage exists. As a result, when the contact loss of SCC is greater than 50% along the thickness direction, the identification accuracy can be as high as 70% to 80%. The two-stage identification method proposed in this study can greatly improve the efficiency of interlayer damage detection of slab tracks and is expected to provide effective technical support for damage identification of track structures in the future.
Slab track; Contact loss identification; Transient impact response; Index fusion; Dempster-Shafer (D-S) evidence theory
1 Introduction
By the end of 2022, China had possessed over 155000 km of railway lines, including 42000 km of high-speed railway lines (Ye et al., 2023). Slab tracks are characterized by high smoothness, steadiness, and low-frequency maintenance (Ren et al., 2020). They are typically adopted by high-speed railway lines with a design speed of 350 km/h and above (Ren et al., 2021b). In order to break through the technical barriers and meet the Chinese government's 'go global' strategic requirements, the former ministry of railways carried out many research projects of slab tracks on the Chengdu–Dujiangyan intercity railway line and innovatively proposed the China railway track system (CRTS) III prefabricated slab track in Mar., 2009. It is a new type of high-speed railway slab track structure developed from China's independent intellectual property and mainly composed of the track slab, self-compacting concrete (SCC), concrete base, and so on (Fig. 1). Currently, CRTS III prefabricated slab track has been successfully applied to many routes with a total operational mileage of over 4000 km, such as the Panjin–Yingkou high-speed railway, the Shenyang–Dandong railway, and the Harbin–Mudanjiang railway. Despite the good service condition of the CRTS III prefabricated slab track in China, it is affected by multiple factors such as material shrinkage, improper construction and maintenance, ambient temperature change, and train load (Li et al., 2019), which may lead to interlayer debonding between the track slab and the SCC in some service sections (Fig. 2). Over time, debonding can gradually evolve into contact loss that weakens the overall stiffness of the track structure and undermines its stability threatening the safety of train operations. Therefore, it is necessary to carry out research on identifying the contact loss of the SCC for an immediate and accurate understanding of the interlayer quality and of the reasonable maintenance to avoid further damage and ensure driving safety.
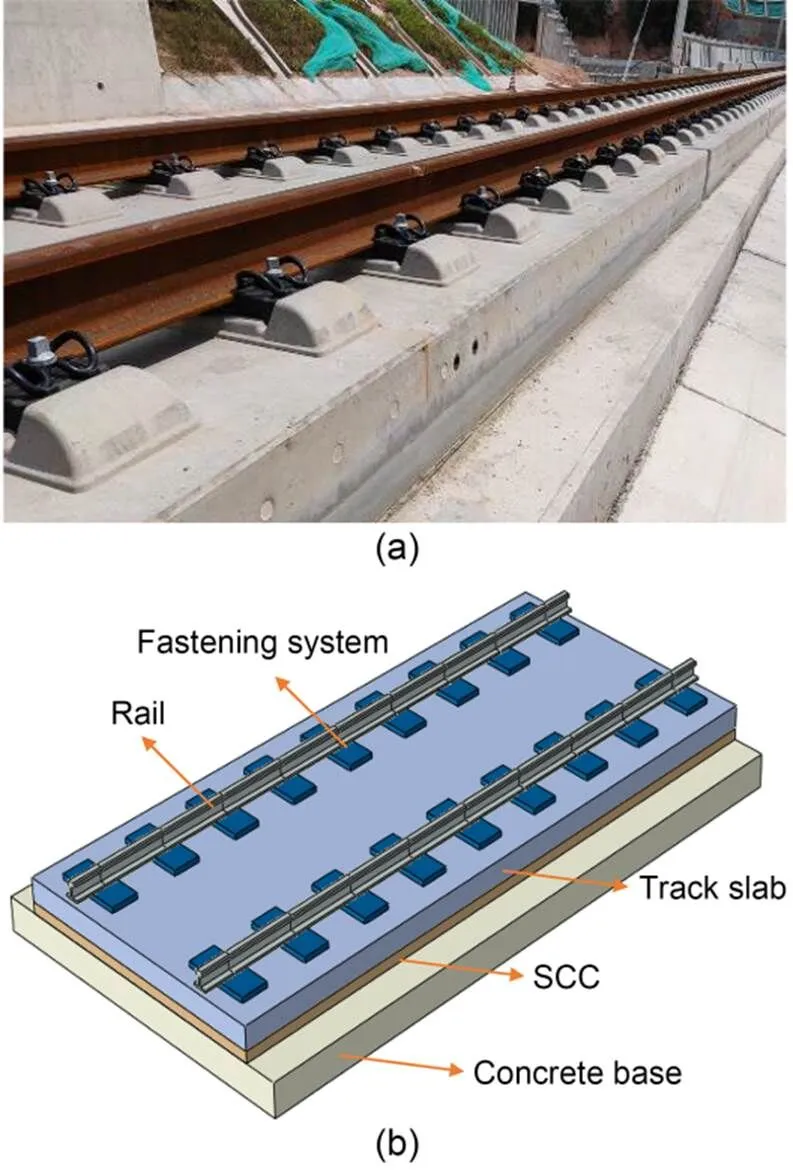
Fig. 1 CRTS III prefabricated slab track: (a) site picture; (b) structure composition
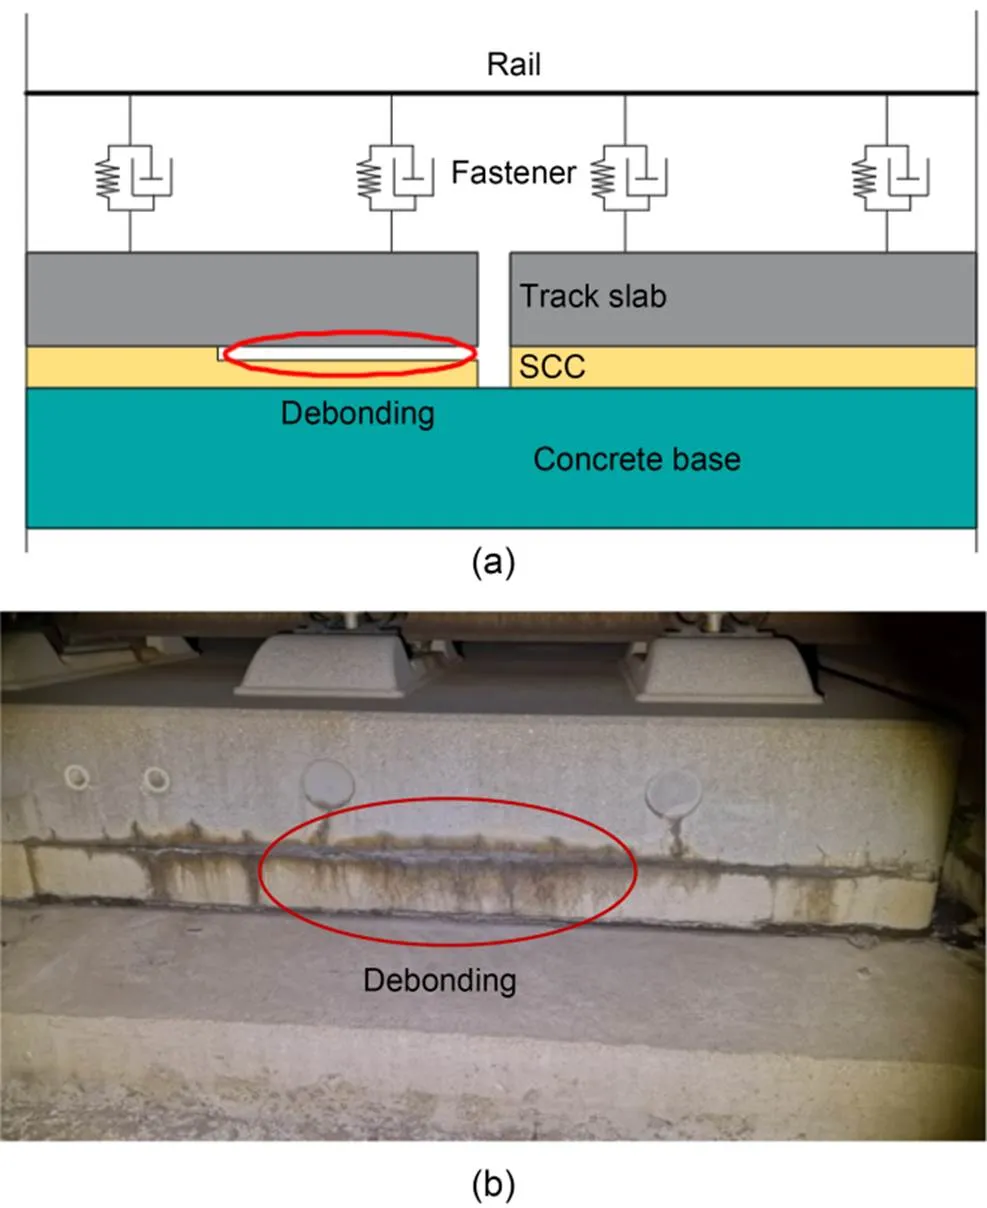
Fig. 2 Debonding between SCC and track slab: (a) schematic diagram; (b) site picture
Researchers have used a variety of detection techniques and identification methods to analyze common damages, such as interlayer debonding (or contact loss) and internal cavities, in slab track and other concrete structures. These methods mainly include ground-penetrating radar (GPR), impact-echo (IE), and transient impact methods.
The GPR detection system is mainly composed of three functions: data acquisition, signal processing, and image interpretation. Based on this method, Ma (2015) detected mortar outflow and contact loss between the support layer and the subgrade surface in the multi-layer substructure of high-speed railways. Varnavina et al. (2015) proposed appropriate GPR acquisition and processing parameters for use of the ground-coupled GPR method for bridge deck assessment. GPR was also used to detect honeycombing of concrete pavement during construction (McCabe et al., 2021) and air-cavities behind concrete tunnel linings (Harseno et al., 2022). Since forward simulation is the theoretical basis for the interpretation and inversion of GPR detection images, it can prove the propagation law of electromagnetic waves in multi-layer structures and improve the accuracy of image interpretation. Researchers adopted 2D forward simulation and test validation to better identify mortar defects and subgrade settlement problems (Liao et al., 2016; Yang and Zhao, 2019). However, despite roughly identifying the depth of damage, GPR signal interpretation based on 2D forward modeling fails to provide accurate information on the shape, size, and spatial location of the damage. Shu et al. (2021) combined 3D forward modeling and physical tests to identify circular cavities in the mortar layer of slab tracks, demonstrating how 3D simulation can effectively identify the basic orientation and approximate shape of mortar failures.
The reflection and scattering of electromagnetic waves in the multi-layer structure, the uneven material distribution, the influence on the echo signal of the reinforcement bar embedded in track structures, plus errors during manual image recognition, make the interpretation of radar images difficult (Cassidy et al., 2011) and lower the accuracy of damage identification.
The IE method typically includes the traditional method of structure vibration and the air-coupled IE method based on a sound signal. The former is widely used in identifying honeycomb damage in the track slab at different depths (Xu et al., 2018) and interlayer debonding (Tian et al., 2018; Bahati et al., 2021) in ballastless tracks. To improve the detection accuracy of traditional IE in identifying filling layer damage in ballastless tracks, multi-channel IE testing equipment (Lee et al., 2021) and synchrosqueezing wavelet transform (SST) (Yang et al., 2022) are also used. Conversely, the air-coupled IE method uses an air-coupled sensor to collect the sound signal near the impact point, replacing the vibration response obtained by the contact sensor in the traditional IE method. Some scholars have adopted the air-coupled IE method to detect surface cracking (Kee and Zhu, 2010) and internal debonding damage (Zhu and Popovics, 2007; Oh et al., 2013) of concrete slab. Although this method is not affected by the surface flatness of the impact point, it is less commonly used in ballastless track damage because it is easily disturbed by environmental noise and has lower stability (Xu et al., 2022).
Although the IE method has the advantages of single-side detectability, intuitive detection results, and low influence by steel bars (Jiang et al., 2020), current practice requires a large number of impact points to be deployed, resulting in low efficiency.
The transient impact method uses a hammer with a low strain rate to strike the structure surface to generate local vibration. From this, structural damage can be determined by analyzing the vibration response obtained by the sensor and data acquisition instrument. This method has been widely used in detecting interlayer damage of ballastless tracks (Wu, 2018; Tian et al., 2019; Zhan et al., 2020; Hu et al., 2021), tunnel lining voids (Davis et al., 2005), concrete pavement cavities (Wang et al., 2010), concrete floor cracks (Hoła et al., 2009; Zoidis et al., 2013) and dynamic stiffness decay in airfield pavements (Khanna et al., 2012), and other scenarios. In respect of interlayer damage identification of ballastless tracks, as the acceleration responses change under different contact loss conditions, Wu (2018) used principal component analysis to reduce the dimensionality of damage indices. The sample data was then input to the support vector machine (SVM)-based identification model to identify the contact loss between the track slab and mortar layer. Since the vibration response of the ballastless track after being excited is only associated with the dynamic features and excitation properties of the structure itself, the dynamic features of the structure can be described by transfer functions. Based on experimental and theoretical analyses, Auersch and Said (2017, 2020) found that the changes in the receptance functions under hammer impacts can be used to detect track damage such as the loss of contact between the sleeper and the track slab, between the track slab and the base plate, and between the base plate and the base layer. Tian et al. (2019) combined the velocity time-history curve, frequency spectrum curve, and mobility change rule of track slab vibration to identify mortar damage. The results showed that the method can identify a contact loss larger than 0.4 m in the mortar layer, but the contact loss range was not explored in detail. When the filling layer of the ballastless track is damaged, the vibration response of the track slab will change abruptly under train loads. This is because the deterioration of the material properties weakens the substructure and further impairs the dynamic stiffness in the damaged area; the dynamic stiffness decrease is proportionate to the degree of damage and the structural quality can be evaluated according to the dynamic stiffness changes. Zhan et al. (2020) explored the mapping relationship between the variability index of dynamic stiffness of the track slab (the change ratio of the dynamic stiffness before and after damage) and the damage location and degree of the cement asphalt (CA) mortar. They established damage evaluation guidelines for mortar pulverization and local contact loss. Hu et al. (2021) proposed a Bayesian-based identification method for the mortar damage of the CRTS I prefabricated slab track by comparing the stiffness distribution of each area of the mortar layer. That method was verified via a transient impact test on an indoor scale model of the ballastless track.
The transient impact method is minimally affected by steel bars and, through reasonable deployment, the number of impact points can be reduced and the detection speed can be improved. Therefore, this study proposes a two-stage damage identification method based on the fusion of response indices under transient impact loading. The study aims to better identify the contact loss between the SCC and track slab of the CRTS III prefabricated slab track. It comprises two stages. In Stage I, by analyzing the vibration response of the impact points evenly distributed on the track slab surface, we found the approximate area of contact loss; in Stage II, we added more impact points in the approximate area and took the same analytic method as in Stage I to narrow the damage range for more accurate identification of the contact loss area. In so doing, the accurate identification of interlayer damage in slab track structure is achieved.
2 Transient impact model of CRTS III prefabricated slab track
When the CRTS III prefabricated slab track has contact loss, the stiffness of the track structure in the damaged area decreases, and the vibration responses under the excitation of external loads differ in different locations on the track slab surface. To obtain the vibration response of the structure, a numerical simulation model of the slab track with SCC damage under transient impact load is established in this section.
2.1 Calculation model
A transient impact finite element model of CRTS III prefabricated slab track with SCC contact loss was established using the ABAQUS finite element software. Compared with track components under the rail, the mass of the rails and fasteners is relatively small, and their effect on the vibration response of the track structure is also small. Therefore, to simplify the model and improve calculation efficiency, rails and fasteners are not considered (Tian et al., 2019; Hu et al., 2021). The model is mainly composed of the track slab, SCC, concrete base, and other components. In the model, tie constraints were adopted between the track slab and SCC, and contact definition was used between the concrete base and SCC. The stiffness of the subgrade foundation was taken as 76 MPa/m, and the support was converted to fully-restrained grounding springs based on the area of the concrete base. The transverse and longitudinal displacements at the two longitudinal ends of the track slab were constrained. To eliminate the influence of boundary conditions, three track slabs were established, and the middle one was taken as the research object. A contact loss area of 1.0 m×1.0 m is set in the center of the middle SCC layer, and it was assumed that the SCC is completely damaged along the thickness direction. The track components were all simulated by C3D8R elements, with mesh sizes of 0.02, 0.02, and 0.10 m for the track slab, SCC, and concrete base, respectively. The calculation model and relevant parameters are shown in Fig. 3 and Table 1, respectively.
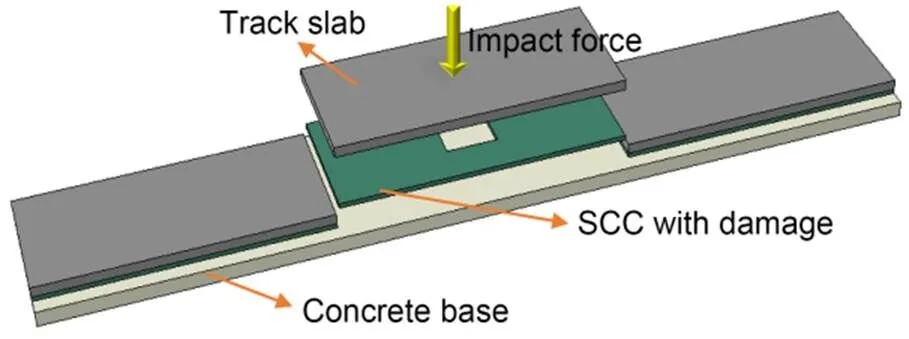
Fig. 3 Calculation model of CRTS III prefabricated slab track
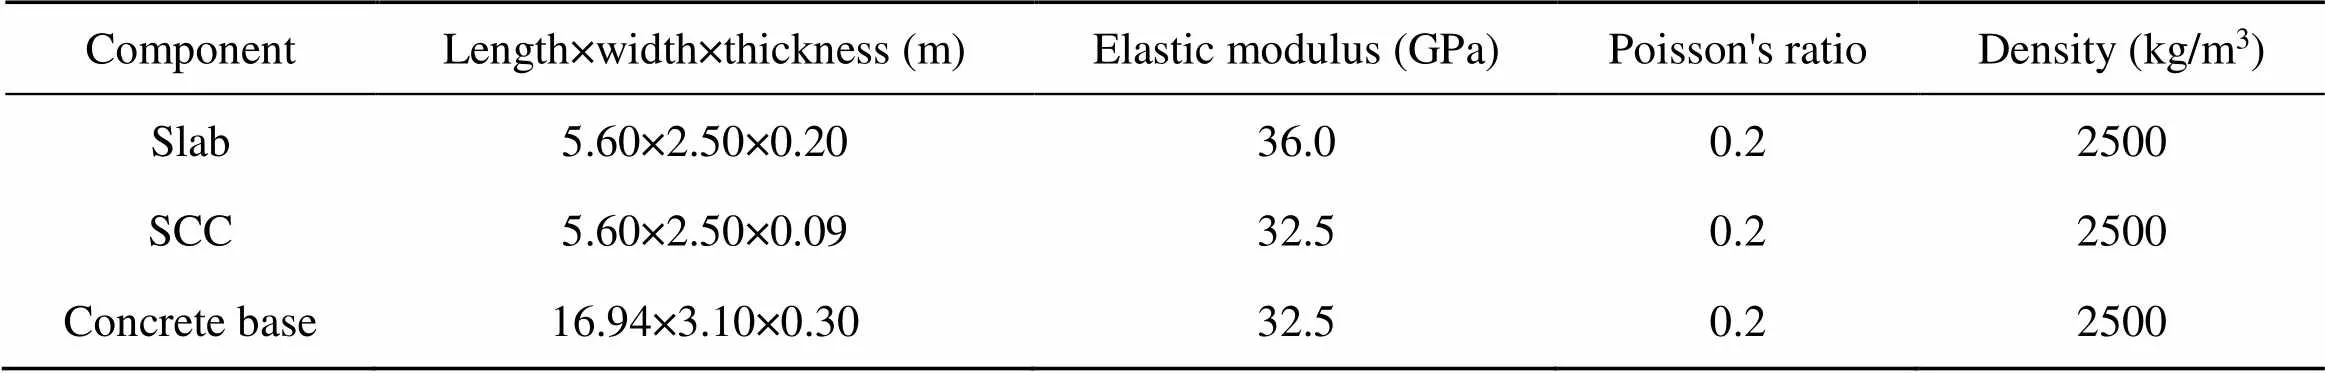
Table 1 Model parameters of CRTS III prefabricated slab track
Using the structural vibration response to identify track damage can only be carried out during the maintenance time window, when there are no trains running. Hence, hammer loads, rather than train loads, are simulated by exciting transient impact loads in the model. The range of load frequency excited by the impact hammer varies with the different materials of the buffer head (e.g. steel, nylon, and rubber). It is noted that the frequency of the excitation force is inversely proportional to the contact time (Lin et al., 1990). Compared with the other hammers, the contact time is the shortest and the load frequency is the highest for the steel hammer. Therefore, the concentrated force used in the finite element model simulates the impact effect of a steel hammer. The transient impact load() applied in the finite element model can be simulated by a half-sine pulse, as shown in Eq. (1):
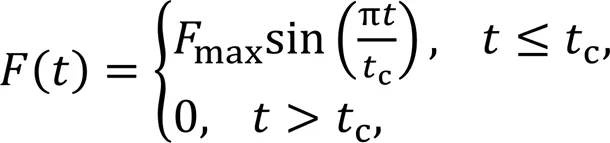
where is the maximum amplitude of the excitation force, t is the time, and is the contact time of the excitation force. Following Tian et al. (2019), we took as 40 kN and as 0.001 s. The load curve is shown in Fig. 4.
2.2 Load case and impact point arrangement
To analyze the vibration response features at different locations on the surface of the damaged track slab, and to avoid overlapping of impact points with the rail bearing platform and rail areas, the impact points were arranged in the center between two rail bearing platforms at every 0.63 m (longitudinal) and every 0.25 m (lateral), as shown in Fig. 5. The rails and rail bearing platforms in the figure are only used for reference and are not considered in the model calculation. Due to the symmetry of the model, this study only analyzes the vibration response of the impact points in a quarter area of the track slab surface. In the actual test process, obtaining acceleration signals is easier than other signals. To identify whether there is damage at the impact points, we collected the acceleration response to transient impact load at a longitudinal distance of 0.05 m from the impact point (Ke et al., 2020) with the sampling time interval being 10-6s, and then extracted damage indices.
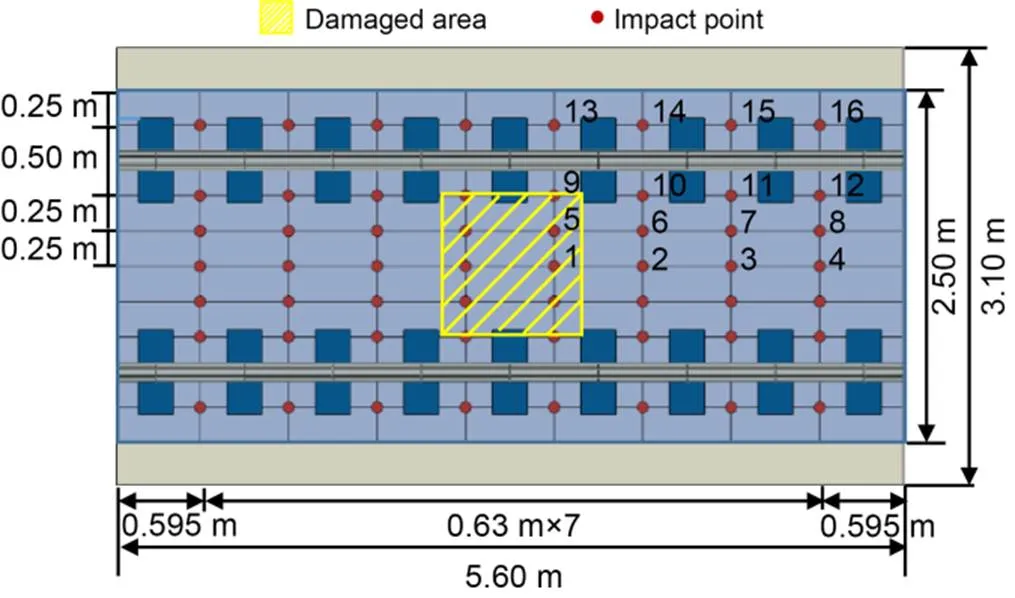
Fig. 5 Schematic diagram of impact point layout
2.3 Model validation
To verify the accuracy of the above finite element model, a transient impact model with three track slabs that did not have contact loss in the SCC was established. The impact point and response extraction point are arranged according to Wu (2018), as shown in Fig. 6a. The mass of the impact object is 10 kg and, from the literature, the height of free fall is 0.5 m. The load amplitude can be obtained as 62 kN using the momentum theorem. The simulation results of the six response extraction points were compared with the test results in Fig. 6b. The variation trend of acceleration responses obtained from the simulation model is in good agreement with the existing test results. The research object in the peer literature was the CRTS II prefabricated slab track, whose structural composition and material's mechanical properties differ from the CRTS III prefabricated slab track used in our model, so the dynamic responses of the track slab obtained there are slightly inconsistent with ours.
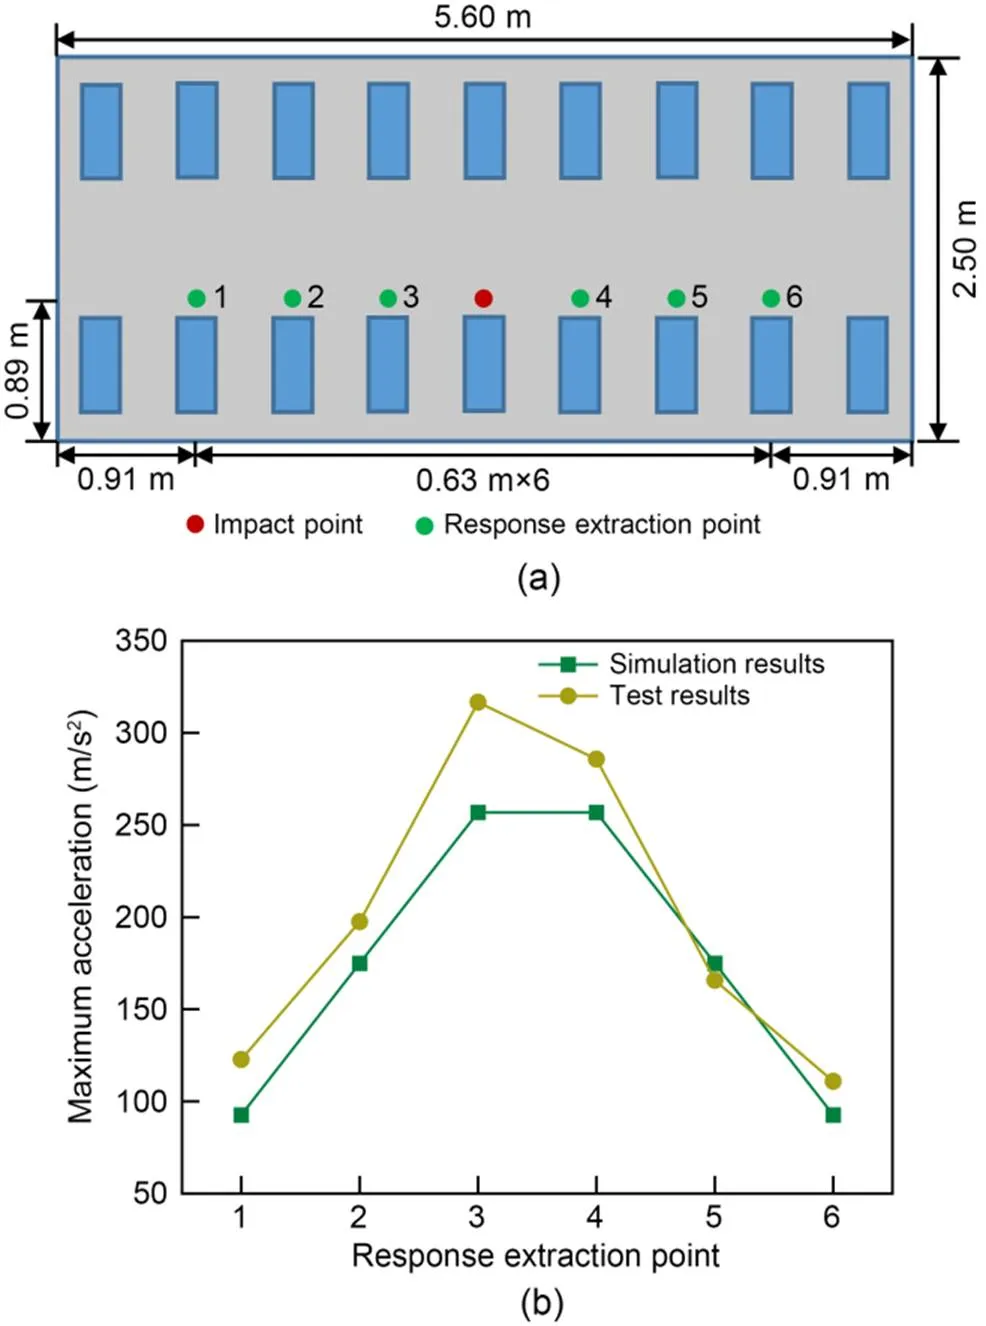
Fig. 6 Comparison of simulation results in this study with test results from other literature (Wu, 2018): (a) arrangement of test points; (b) comparison of results
To further validate the finite element model, we conducted a laboratory test on CRTS III prefabricated slab track using hammer impacts, as shown in Fig. 7. The main instruments are listed in Table 2.
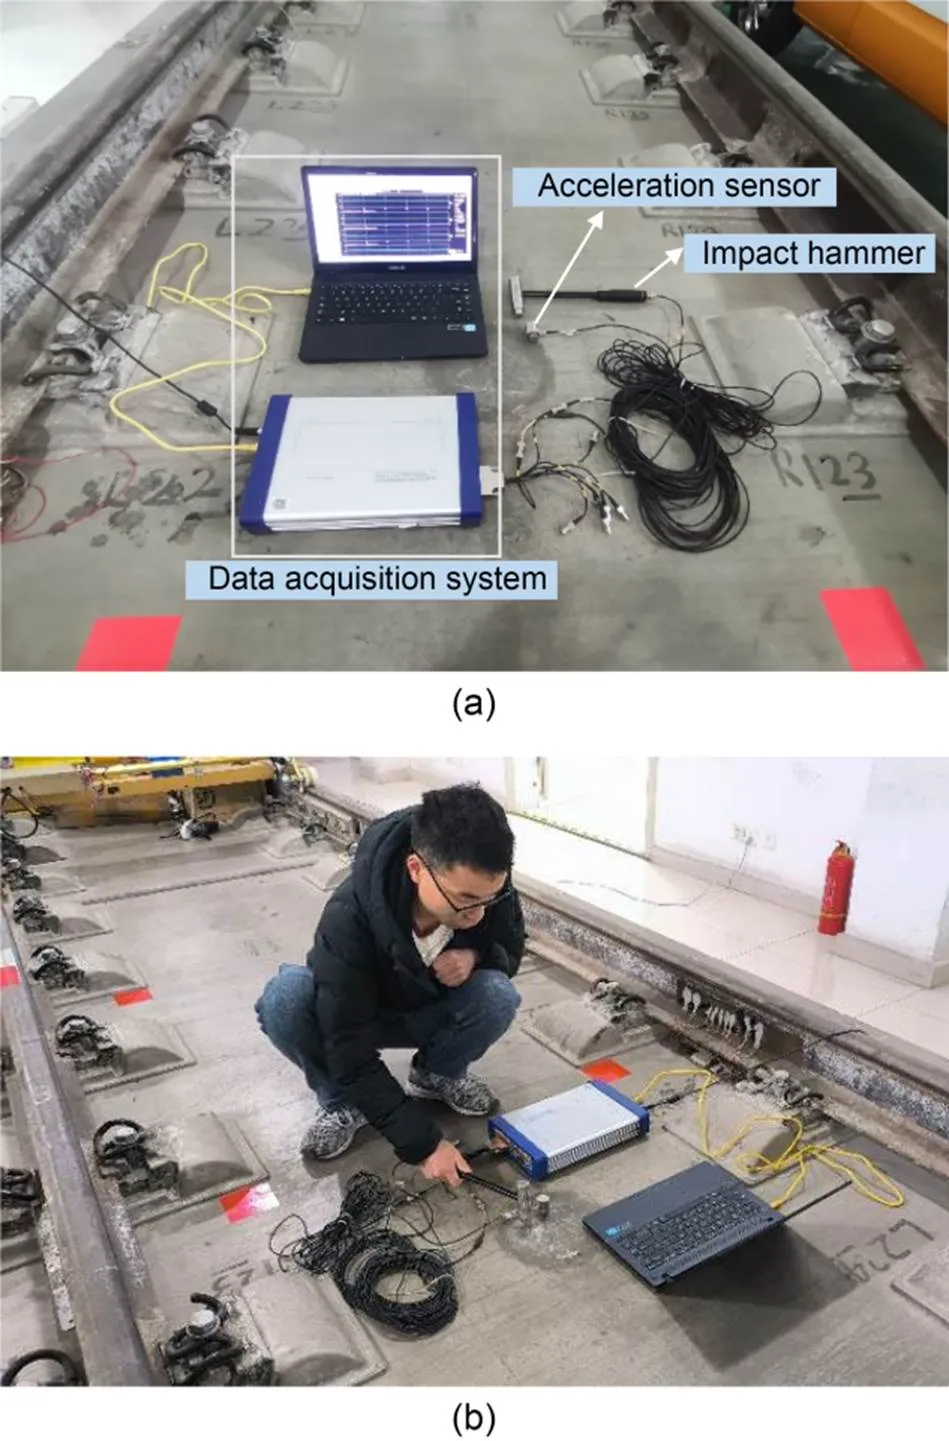
Fig. 7 Hammer impact test on CRTS III prefabricated slab track in the laboratory: (a) instruments for test; (b) test site
Since there is no interlayer damage in the indoor full-scale slab track model, no interlayer damage is set in the simulation model either. The hammer with steel buffer head is applied three times at the center of the track slab surface, and the difference of each impact force is as small as possible to extract the acceleration at 5 cm from the impact point. Then the mean values of the impact forces (Fig. 8a) and responses were obtained. Meanwhile, the mean measured impact load was applied at the center of the upper surface of the track slab in the calculation model of slab track in Fig. 3. The comparison between the simulation responses and test results is shown in Fig. 8b. As can be seen from Fig. 8b, simulation results show a good agreement with the test results, and the difference in the amplitude is small. The above comparisons between the model simulations and the test results of the existing literature and indoor experiments indicate that the finite element model established in this study is correct and can be used for the subsequent analysis of SCC damage identification.
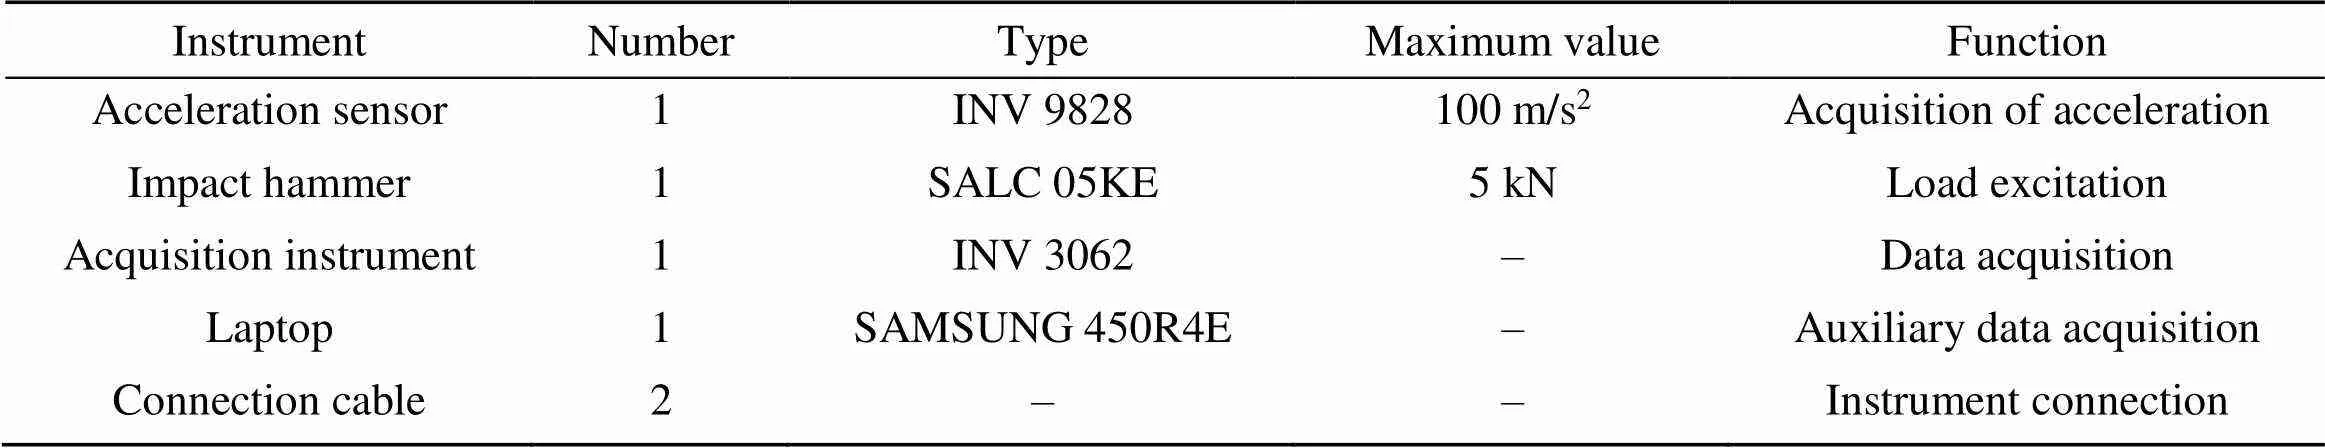
Table 2 Main instruments of test
3 Analysis of damage indices
This section analyzes the variation law of the vibration acceleration for the impact points, extracts the damage indices in the time and frequency domains, and prepares for the rough identification of the damaged area in the next step.
3.1 Vibration analysis in the time domain
Based on the arrangement of impact points in Fig. 5, the impact load was applied to each impact point in turn, and the acceleration of each point was extracted. The time-history curve of different impact points along the longitudinal and lateral directions of the track slab is shown in Fig. 9.
It can be seen from Fig. 9 that, in the longitudinal direction of the track slab, the vertical acceleration of impact point 1, which is in the contact loss area, is significantly higher than that of impact points 2–4, which are in the undamaged area. Similarly, in the lateral direction, the vertical acceleration of impact points 1 and 5, which are in the contact loss area, is significantly higher than that of impact points 9 and 13, which are in the undamaged area. The results agree with the phenomenon observed in the literature (Auersch and Said, 2017, 2020) that the vibration amplitude of track elements changes when interlayer damage occurs for slab track under hammer impact or train load.
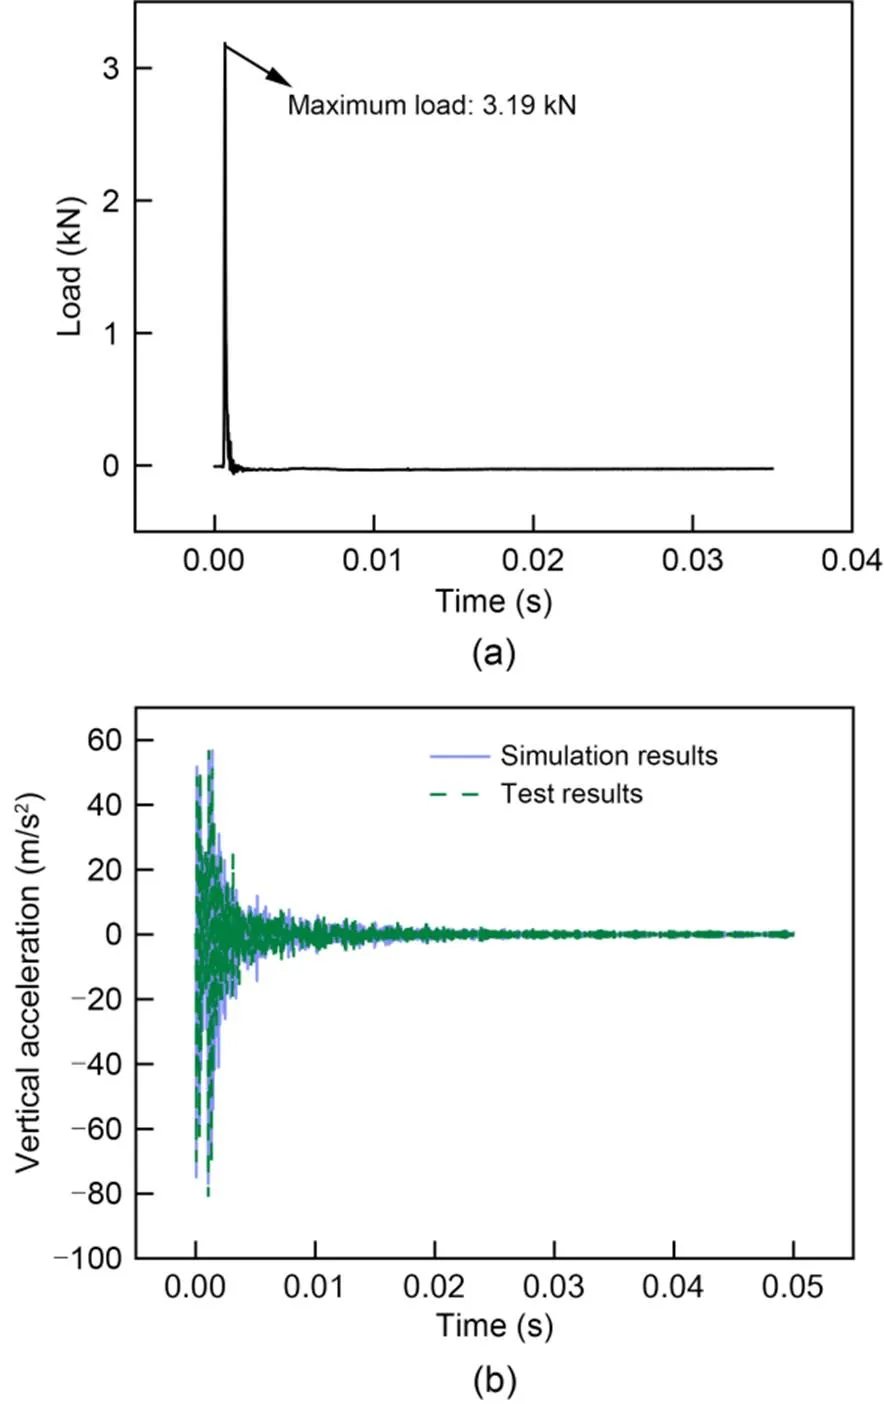
Fig. 8 Comparison of hammer impact test results: (a) measured load curve of hammer impact; (b) comparison of results
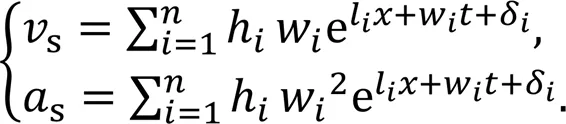
Liu et al. (2011) expressed the differential equation of elastic vibration of the slab as Eq. (2):
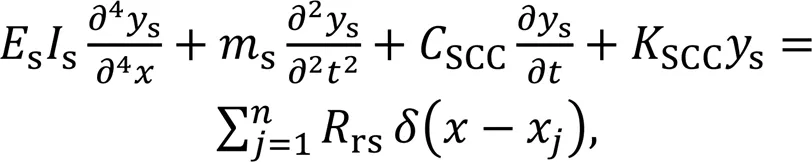
Assuming the right side of Eq. (2) is 0, the general solution is:

By calculating the first-order derivative and the second-order derivative of Eq. (3) with respect to time, the velocitysand accelerationsof the track slab can be obtained as follows:

After performing a sensitivity analysis of the damage indices of the acceleration response, the peak-to-peak and the absolute mean values, which are more sensitive to the SCC damage, were selected for normalization. The results are shown in Fig. 10.
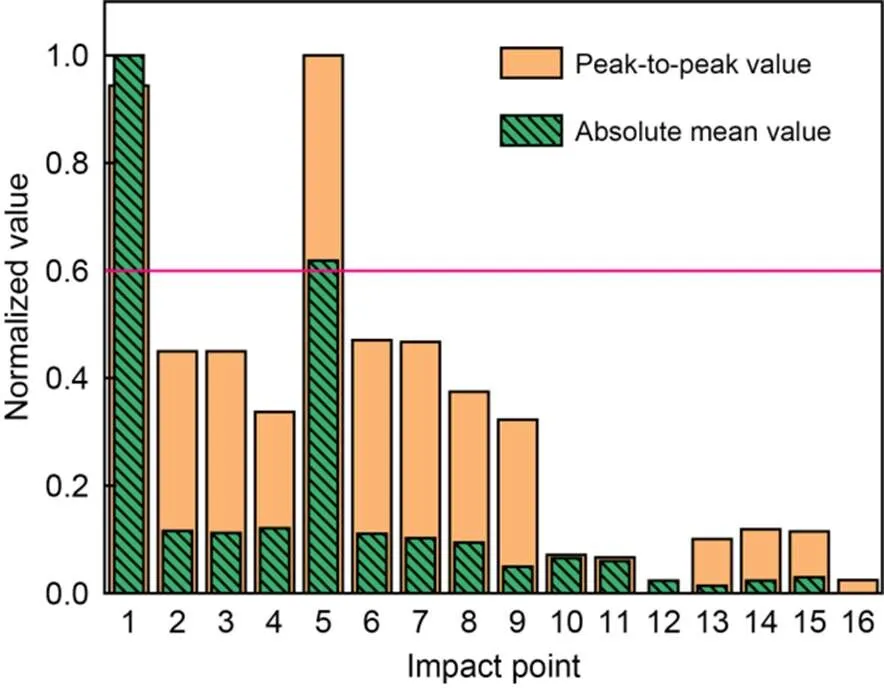
Fig. 10 Damage indices in the time domain
As can be seen from Fig. 10, after the normalization of the acceleration indices in the time domain for the 16 impact points, the values corresponding to points 1 and 5 in the damaged area are significantly higher than those of the other points. For the peak-to-peak value, points 1 and 5 are close to 1.0, and the normalized values of the other points are all lower than 0.5; the normalized absolute mean values of points 1 and 5 are 1.00 and 0.62, respectively, and the normalized values of the other points are all lower than 0.2. When the threshold for determining damage is set to 0.6 (Ren et al., 2021a), both the peak-to-peak value and absolute mean value of acceleration can be used to accurately identify points 1 and 5 in the damaged area. However, there may be inaccuracies because the normalized absolute mean value for point 5 is close to the threshold value.
3.2 Vibration analysis in the frequency domain
Since certain information about structural vibration signals is difficult to obtain in the time domain, this study uses Fourier transform to convert the signals from the time domain to the frequency domain and thus obtains the hidden damage information of vibration signals. The distribution law of the frequency spectrum of the vibration response in the range of 0 to 10000 Hz is shown in Fig. 11.
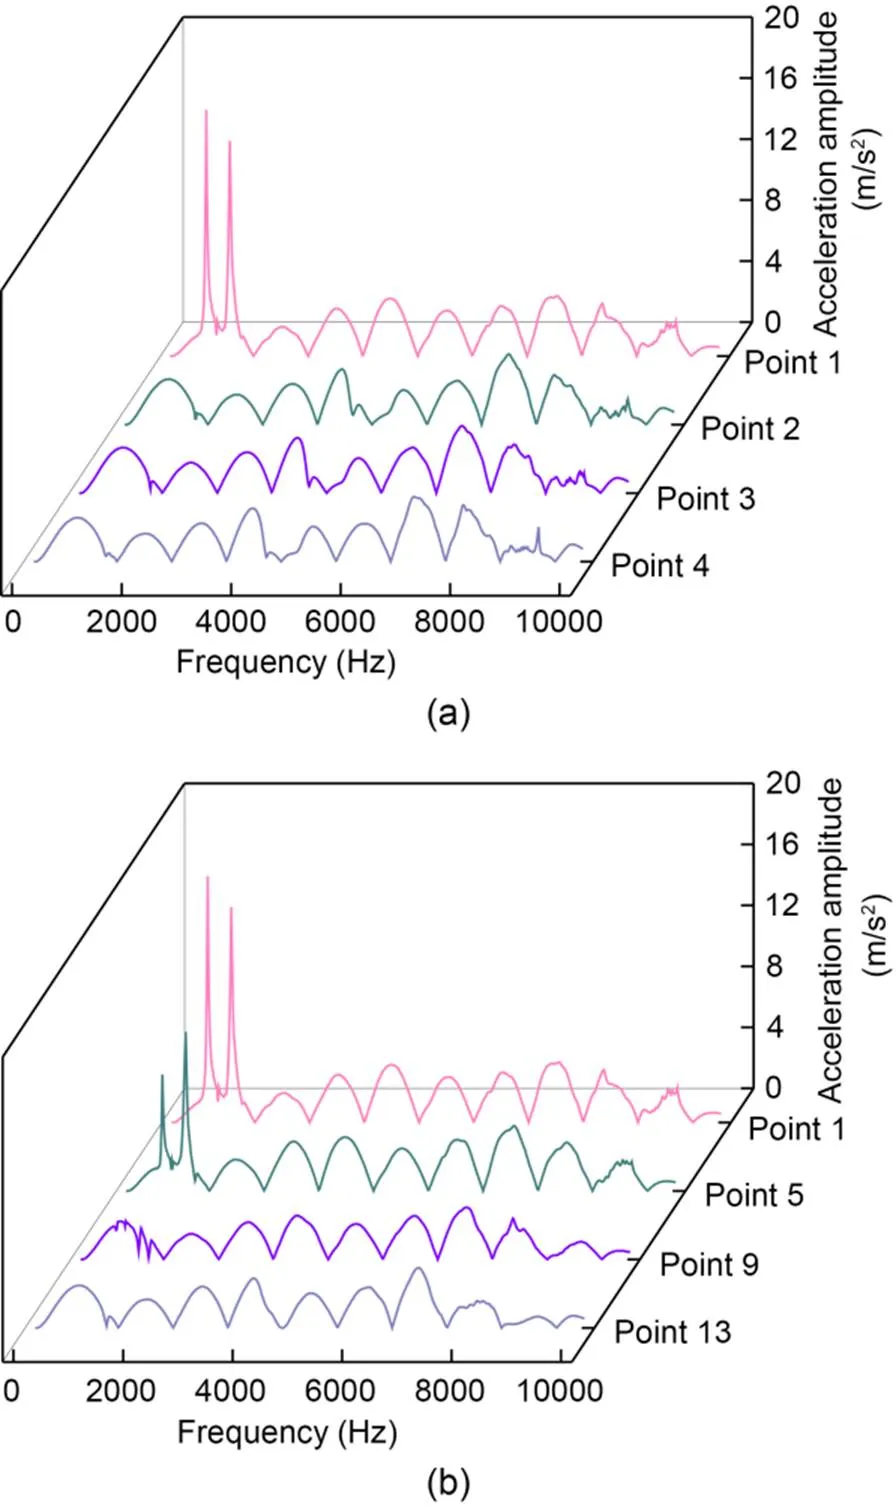
Fig. 11 Acceleration spectra of different impact points: (a) longitudinal direction; (b) lateral direction
It can be seen from Fig. 11 that the acceleration amplitudes of points 1 and 5 (in the damaged area) reach the peak at a frequency of around 1000 Hz, and the other points (in the undamaged area) have multiple peaks of acceleration amplitude which are significantly smaller than those of points 1 and 5 when the frequency is within 1000 to 8000 Hz. This is because the SCC contact loss has impacted the original conditions of the track slab, increasing its vibration acceleration. The mean and maximum amplitudes in the frequency domain of the acceleration response for each impact point were normalized, and the results are shown in Fig. 12.
In Fig. 12, after the normalization of the acceleration indices in the frequency domain for the 16 impact points, the values corresponding to points 1 and 5 in the damaged area are significantly higher than those in the undamaged area. The mean amplitudes of points 1 and 5 are 1.00 and 0.88, respectively, and the normalized values of the remaining points are all lower than 0.55. Meanwhile, the maximum amplitudes of points 1 and 5 are 1.00 and 0.55, respectively, while those of the other points are all below 0.1. When the threshold for damage indices is set to 0.6, the mean amplitude can be used to accurately identify points 1 and 5 in the damaged area. However, the maximum amplitude can only accurately identify point 1 and will misjudge the damaged point 5 as an undamaged point.
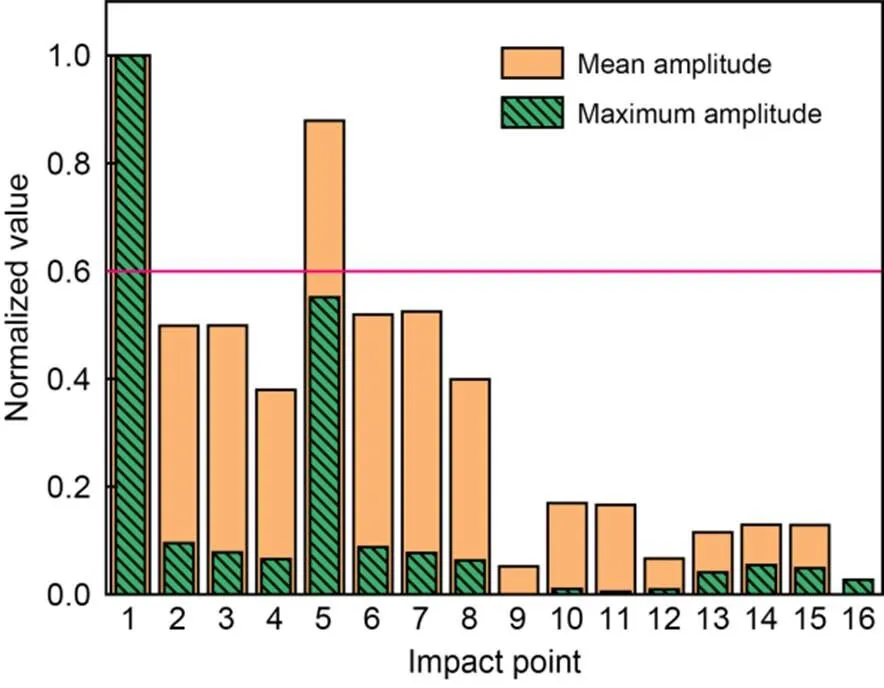
Fig. 12 Damage indices in frequency domain
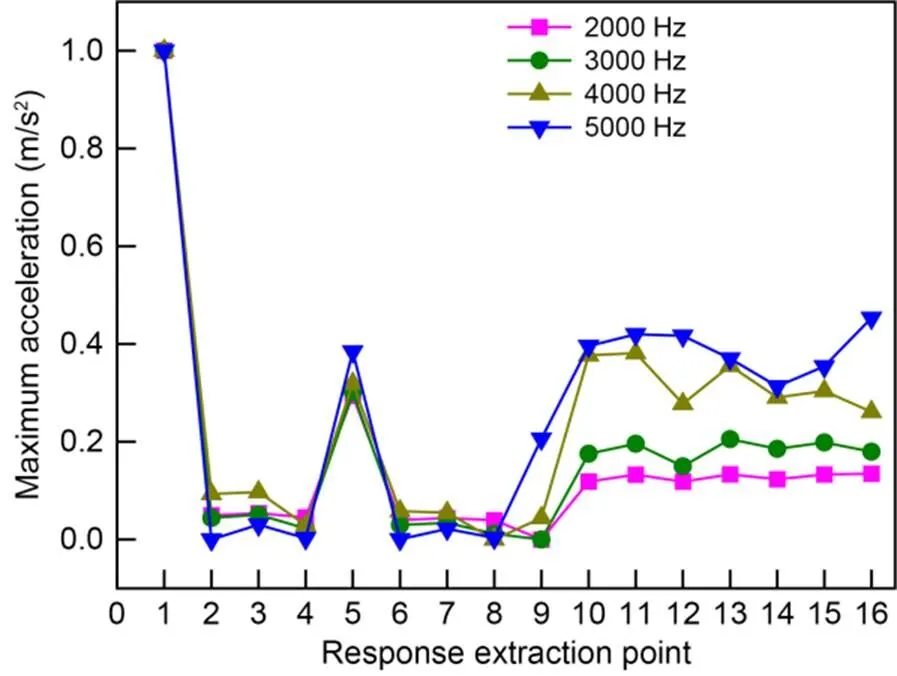
Fig. 13 Power density ratios of different impact points
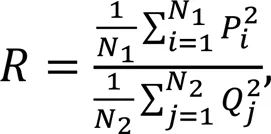
To quantitatively determine whether an impact point is in the damaged area, we referred to the method proposed by Zhang et al. (2020) and calculated the power density ratio of different impact points based on the spectrum analysis of acceleration, as shown in Eq. (5):

When frequencywas taken as 2000, 3000, 4000, and 5000 Hz, the power density ratio of the acceleration response of each impact point was calculated and normalized. The results are shown in Fig. 13.
As can be seen from Fig. 13, the variation law of the normalized value of the power density ratio is basically the same. Whenis 2000 Hz, the difference between the values of the impact points in the damaged and undamaged areas is large, which is beneficial to damage identification. However, when the damage threshold is set to 0.6, only point 1 can be accurately identified using the power density ratio, while point 5 will be misjudged as undamaged.
3.3 Accelerance analysis
Damage to the track structure can cause a change in its vibration characteristics. Based on structural vibration transfer functions, receptance, mobility, and accelerance (acceleration divided by force) were used as indicators for track structure damage identification and vibration performance evaluation in numerical simulations (Thompson et al., 1999; Auersch and Said, 2020; Sun et al., 2020). Therefore, the accelerance of the track slab is selected to investigate whether this index can be used for the SCC damage identification in the simulation analysis. It could provide some theoretical basis for the next field application of the proposed identification method. To further explore the effect of contact loss on the vibration responses of the impact point, when the impact load is specified and the vibration response in the time domain of the impact point is got, the accelerance can be calculated by Eq. (6):
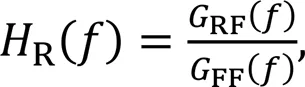
where is the accelerance, is the cross-power spectrum of the acceleration response and the excitation force, and is the self-power spectrum of the excitation force. The accelerance curves of different impact points along the length and width of the track slab in the ranges between 0 to 10000 Hz are shown in Fig. 14, and the average accelerance values of each impact point are normalized, as shown in Fig. 15.
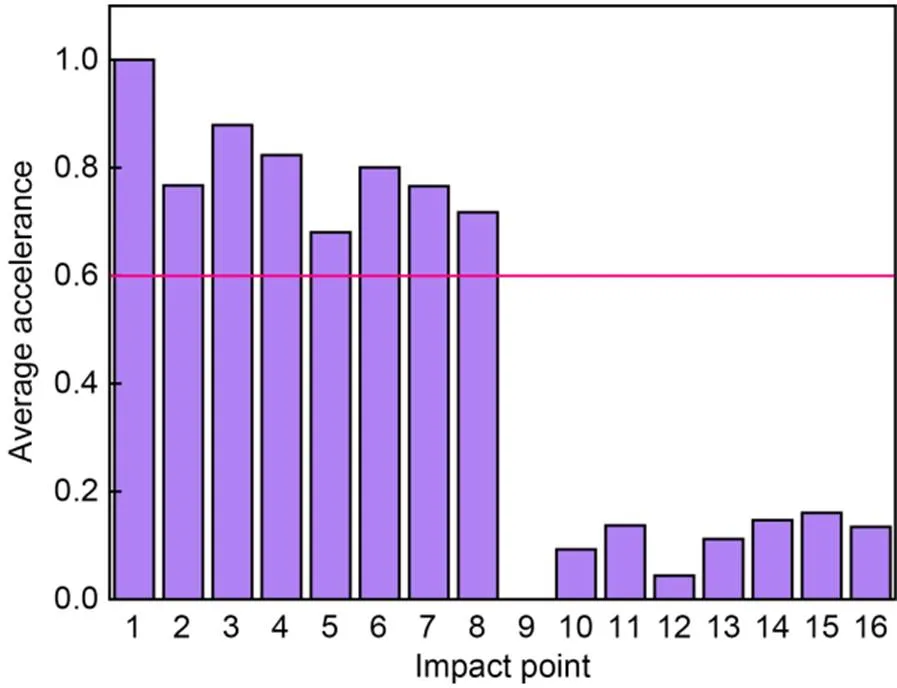
Fig. 15 Average accelerance for different impact points
In Fig. 14, the variation law of the accelerance of different impact points is similar, and the accelerance amplitude of the high frequency is higher than that of the low frequency. Fig. 15 shows that when the average accelerance is selected as the damage index and the damage threshold is taken as 0.6, many undamaged impact points will be misjudged as damaged impact points (such as impact points 2–4 and 6–8). Therefore, accelerance is not considered as a damage index for damage identification in the following sections.
4 Two-stage identification of damaged area
It can be seen from the above analysis that using a single vibration response index may incorrectly determine the damage of the impact point. To improve the stability and accuracy of identification, a two-stage identification method is proposed in this section. In Stage I, based on the Dempster-Shafer (D-S) evidence theory, the damage indices extracted from the time and frequency domains were fused to select the damaged points from many impact points uniformly distributed on the track slab surface. That is, the approximate identification of the contact loss area of the SCC was performed. In Stage II, to further narrow the damage scope, more impact points were added in a small area consisting of damaged points and nearby undamaged points according to the identification results obtained from Stage I. The same index fusion theory was used to identify the damaged impact points from the added points. Finally, the damaged area was clearly visualized using an interpolation method and the identification accuracy was calculated.
The steps of evidence fusion in Stage I are as follows: normalize the peak-to-peak value and absolute mean value in the time domain, the mean amplitude and the maximum amplitude in the frequency domain, and the power density ratio to construct the basic probability assignment and form the five evidences; fuse the evidences based on the fusion rules of the D-S evidence theory; accurately determine whether there is damage at the impact point based on the fusion results. The fusion process is shown in Fig. 16.
4.1 D-S evidence theory
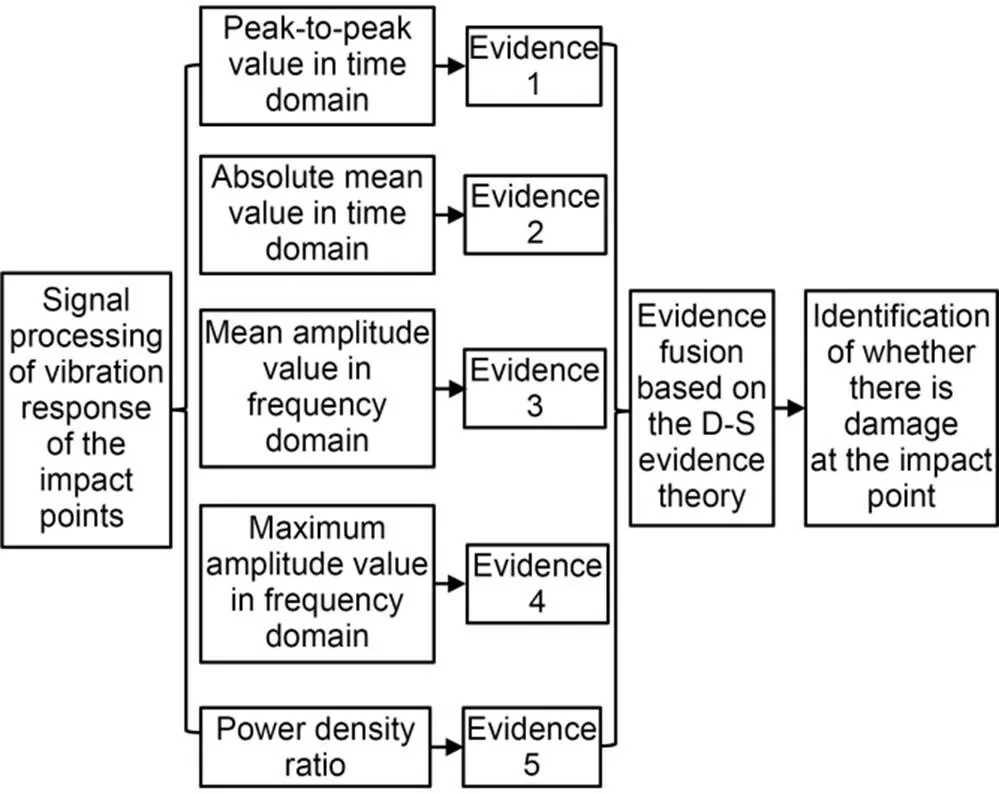
Fig. 16 Fusion process of damage indices
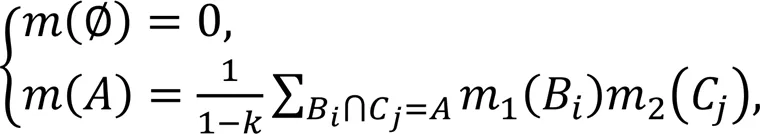
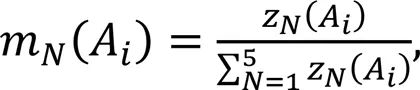
According to the interlayer contact loss of slab tracks, the basic probability of each focal element in the evidence is constructed by normalizing the damage indices of the vibration response for the impact point. This avoids subjective and complex issues of constructing basic probability assignment functions in evidence theory (Suranthiran and Jayasuriya, 2003). The calculation formula is as follows:
4.2 Stage I: approximate identification of the damaged area
In this section, the acceleration of the 16 impact points in Section 2.2 is used, and the D-S fusion theory is used to fuse certain values to check whether the impact point belongs to the damaged area. These values include the peak-to-peak value, absolute mean value in the time domain, mean and maximum amplitudes in the frequency domain, and power density ratio. This approximate identification was performed to prepare for accurate identification.
The fusion results of longitudinal impact points 1–4 and lateral impact points 1, 5, 9, and 13 were obtained by calculation, as shown in Fig. 17.(1) and(2) represent the basic probability of impact points being damaged and undamaged, respectively. When(1) is between the threshold and 1.0, it indicates that the impact point is damaged. When(2) is between the threshold and 1.0, it indicates that the impact point is undamaged. The index serial numbers 1–6 correspond to the peak-to-peak value in the time domain, absolute mean value in the time domain, mean amplitude in the frequency domain, maximum amplitude in the frequency domain, power density ratio, and fusion index of point 1. Likewise, the index serial numbers 7–12, 13–18, and 19–24 correspond to those indices of impact points 2, 3, and 4, respectively.
It can be seen from Fig. 17a that for point 1, the basic probability of the first five damage indices fluctuates around 1.0. After evidence fusion,(1) of the fusion index increases to 1.0, indicating the impact point 1 is damaged. For points 2–4,(1) of the first five damage indices fluctuates between 0.0 and 0.5. After evidence fusion, the fusion indices are all reduced to about 0, indicating that the three impact points are undamaged. From Fig. 17b,(1) and(2) of the absolute mean value in the time domain, the mean amplitude in the frequency domain, and the power density ratio of point 5 are all around 0.5, but for other points, the first five damage indices show drastic difference in their(1) and(2). Based on the basic probability of being damaged, namely(1), after evidence fusion, it can be identified that points 1 and 5 are damaged, and the points 9 and 13 are not damaged.
The damage index fusion results of 16 impact points were obtained by further calculation (Fig. 18).
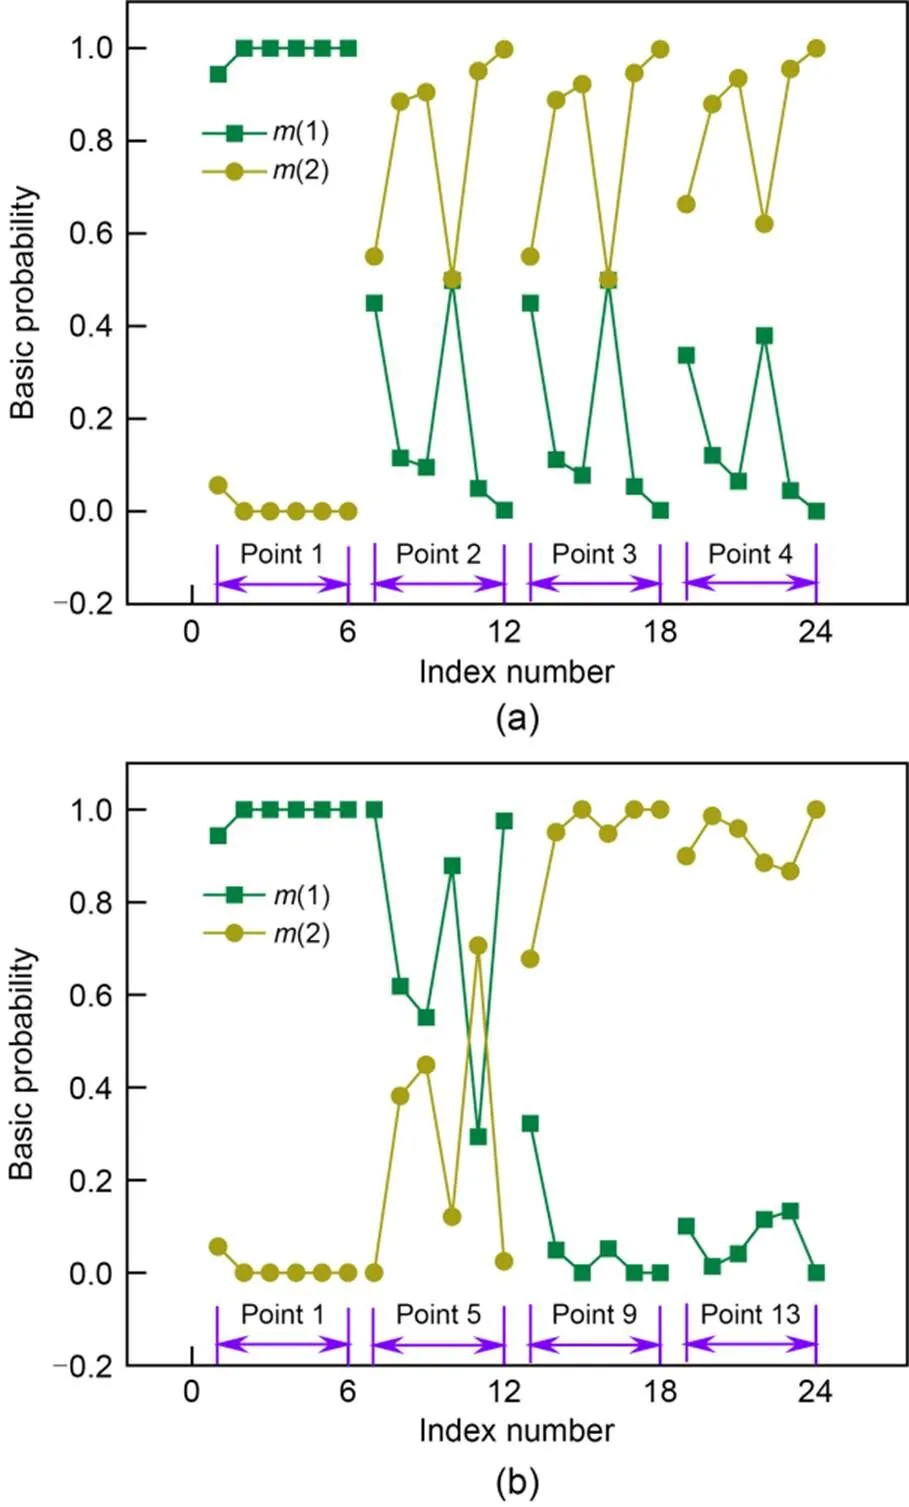
Fig. 17 Fusion results of damage indices at different impact points: (a) longitudinal direction; (b) lateral direction
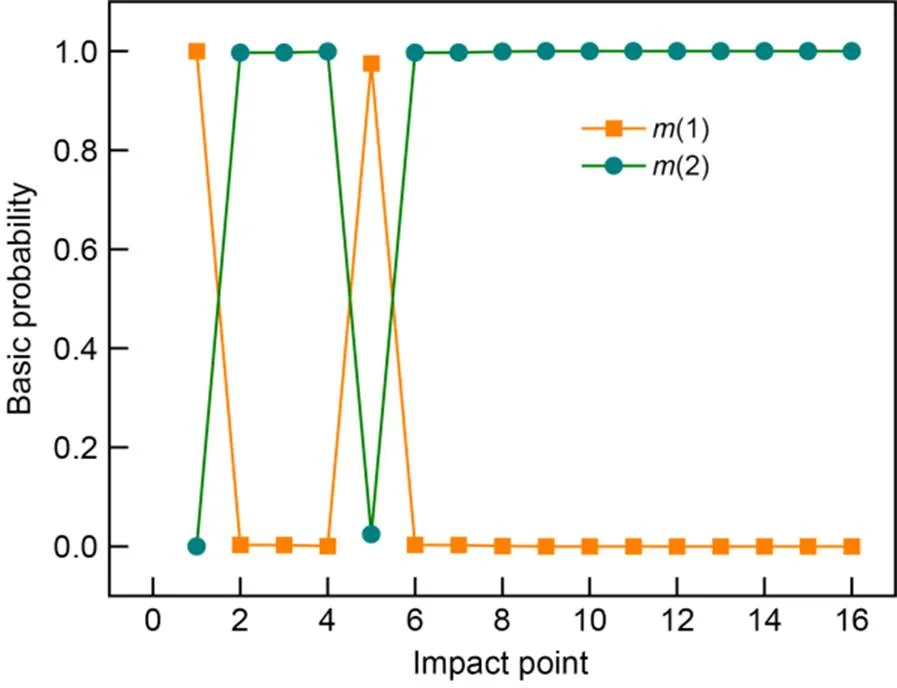
Fig. 18 Index fusion results based on the acceleration response of impact points
In Fig. 18, after the evidence fusion of the five damage indices, for points 1 and 5 in the damaged area,(1) is about 1.0, and(2) is about 0; for the undamaged area, the fusion result is opposite to that in the damaged area, with(1) about 0 and(2) close to 1.0. When the threshold is set to 0.6, the presence or absence of damage at all impact points can be accurately identified. Compared with the use of a single damage index, the fused index makes full use of the complementary information of different damage indices, which can amplify the difference of basic probability of damage and help improve damage identification.
4.3 Stage II: precise identification of the damaged area
The analysis results in Section 4.2 show that only impact points 1 and 5 are damaged. To further locate the damaged area, more impact points were deployed in the area surrounded by impact points 1, 2, 9, and 10. There are a total of 42 impact points (Fig. 19), where impact points A1–A7 are in the first row, and the other impact points are laid out in the same way in the second to sixth rows. The accelerations at a longitudinal distance of 0.05 m from the impact point were obtained, and the damage of the added impact points was judged based on the vibration responses.
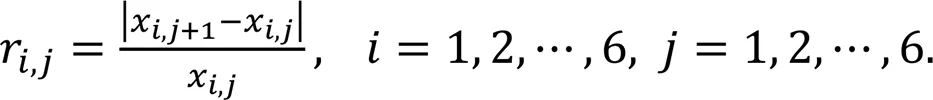
After analyzing the damage indices of the vibration acceleration of 42 impact points, we found that the peak-to-peak value of the acceleration in the time domain and the mean amplitude in the frequency domain are insensitive to the damage of the added impact points. This section analyzed three indices, namely, the absolute mean in the time domain, maximum amplitude in the frequency domain, and power density ratio. In addition, considering the small spacing of the added points, no major difference in the values of various damage indices was found. Hence, the change rate of the indices between two points was selected as the evaluation index, and the calculation formula is
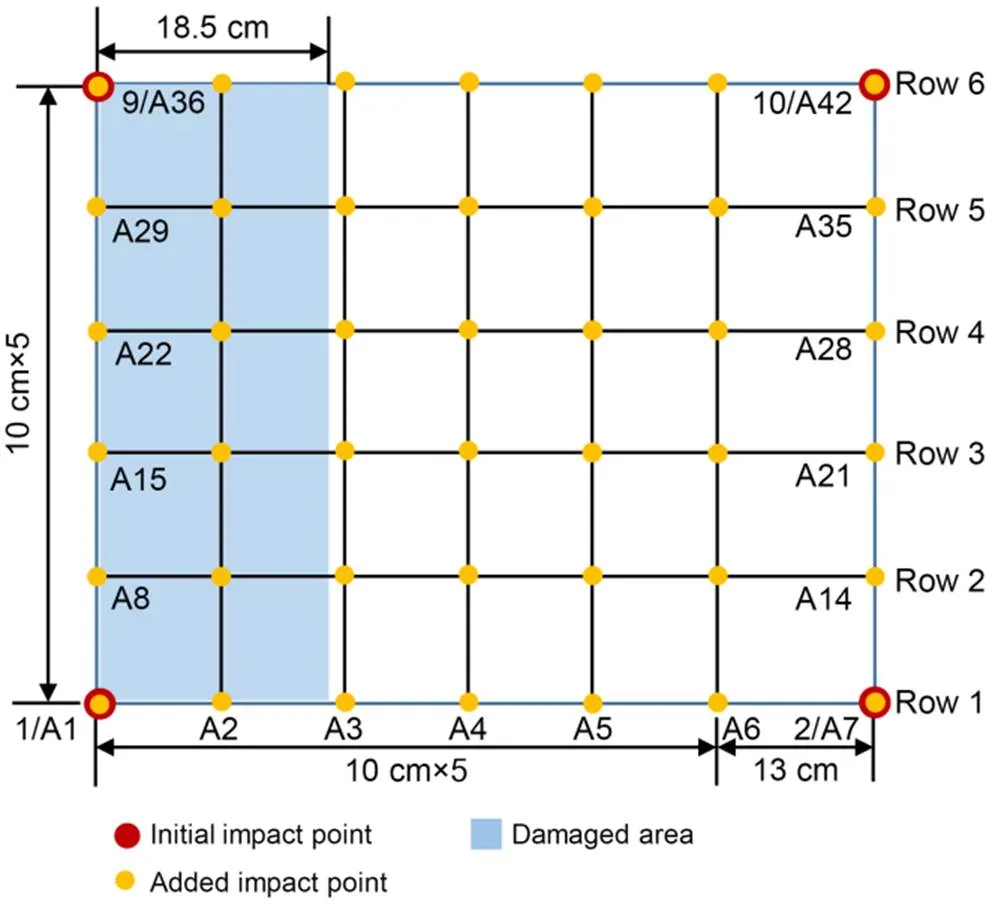
Fig. 19 Layout of added impact points
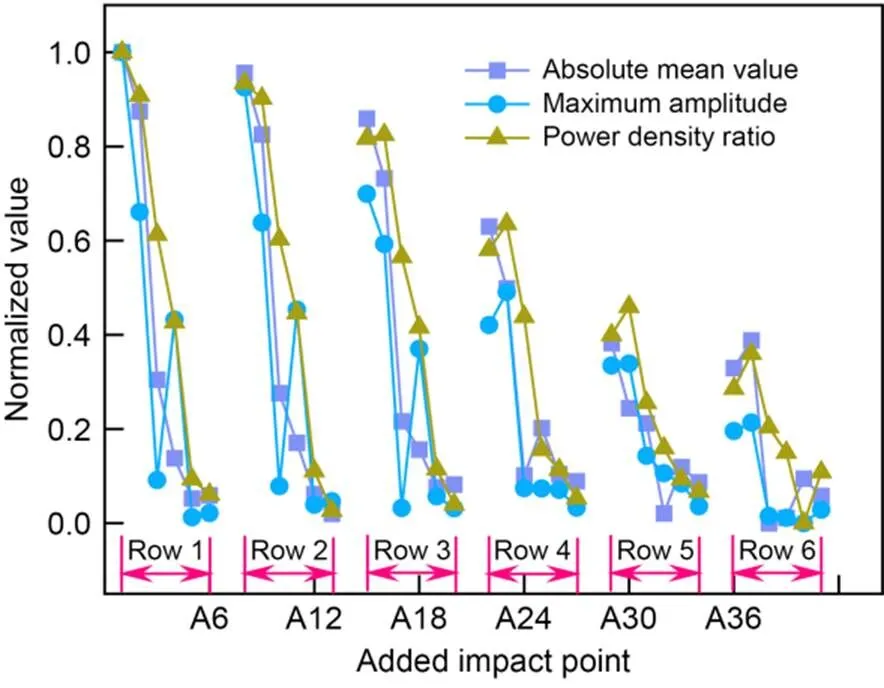
Fig. 20 Normalized values of damage indices
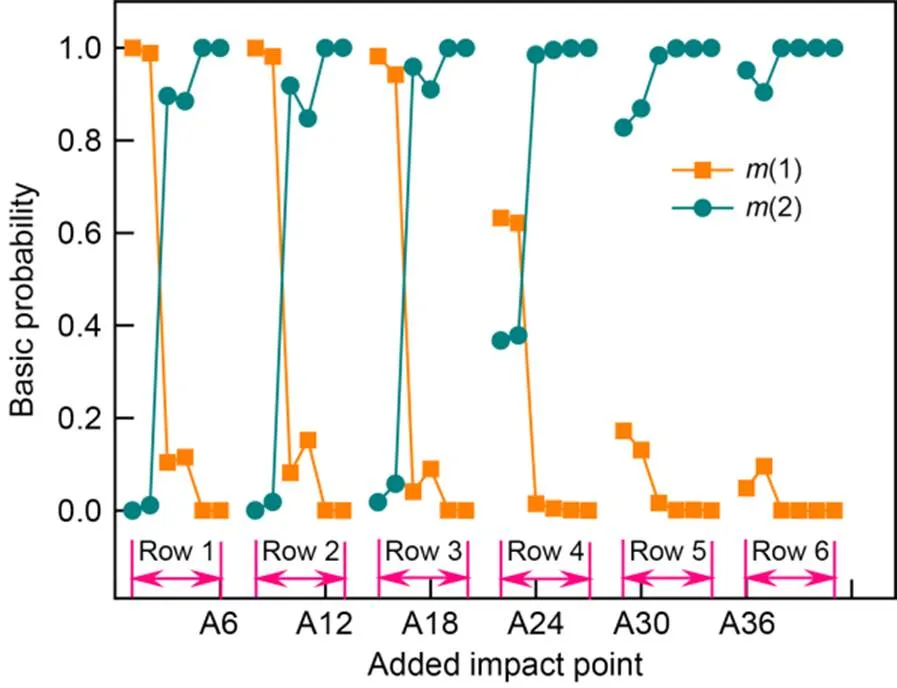
Fig. 21 Fusion results of damage indices
First, we normalized the change rate of damage indices of all impact points in the area (Fig. 20) before using the D-S evidence theory in Section 4.1 to fuse the three damage indices and obtain the fusion result. The results are shown in Fig. 21.
From Fig. 20, we can see that, for different damage indices, each row of impact points exhibits a similar variation trend in the normalized values. When the impact point is far from the contact loss center, its normalized value is smaller. Specifically, in the longitudinal direction, the value of the left impact point is greater than that of the right impact point. In the lateral direction, a larger serial row number of the impact point corresponds to a smaller normalized value of its index. When the damage judgment threshold is taken as 0.6, all the impact points in the 5th and 6th rows are wrongly identified as not damaged.
In Fig. 21, after the three indices are fused,(1) of the first two impact points in the 1st to 4th rows is greater than the threshold of 0.6, indicating there is damage. However, because all the impact points in the 5th and 6th rows have a damage probability of less than 0.2, they are judged as undamaged, which is an incorrect assessment.
The above analysis indicates that different distances from the impact points in the densified area to the damage center influence the normalization of the damage indices, resulting in inaccurate damage identification at some impact points. Therefore, we normalized the change rate of the damage indices corresponding to the vibration acceleration of each row of impact points, and then fused the three damage indices of each row. The normalized damage indices for each row are shown in Fig. 22, and the fusion results are shown in Fig. 23.
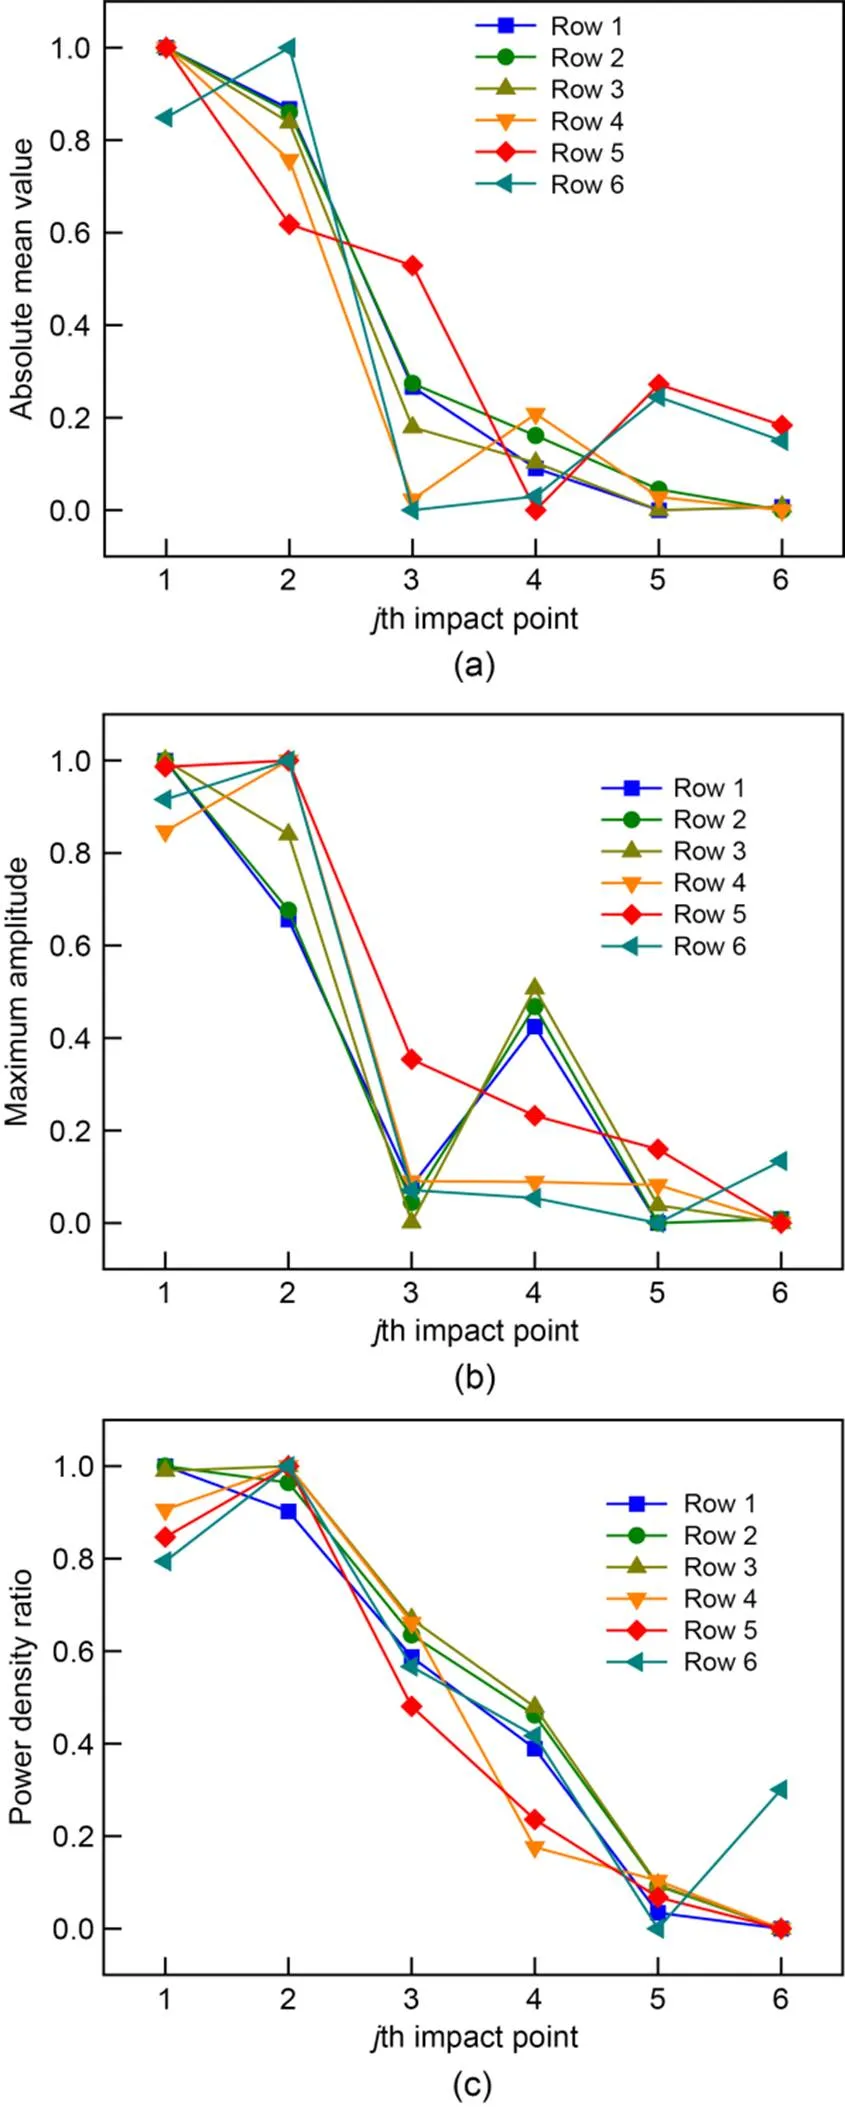
Fig. 22 Normalized values of the change rate of the damage indices: (a) absolute mean value; (b) maximum amplitude; (c) power density ratio
It can be seen from Fig. 22 that the normalized values of the change rate of the damage indices in each row follow a similar trend. The first two damaged impact points in each row can be identified if the normalized value of a single damage index is known. In Fig. 23, after index fusion,(1) of the first two impact points in each row is about 1.0, which is greater than the threshold of 0.6, indicating that the impact points are damaged. The(1) of almost all the remaining points is less than 0.2, which is less than the threshold value, indicating that the points are not damaged.
Fig. 23 Index fusion results
To further clarify the size of the damaged area, taking the plane position information of the impact points as theandaxes, and the probability of damage as theaxis, the Kriging interpolation method (Martin and Simpson, 2005) was used to image the contact loss. The result is shown in Fig. 24a. Then, the 3D distribution in the densified area was projected in two dimensions, as shown in Fig. 24b.

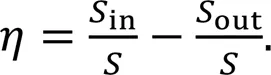
In Eq. (10), S is the area of the actual damaged area, which is taken as 0.0925 m2; Sin is the area where the predicted probability of damage is greater than 0.6 within the actual damaged area; Sout is the area where the predicted probability of damage is greater than 0.6 outside the actual damaged area.
5 Effect of different damage degrees on identification
The above analysis aims to identify the complete damage in the whole thickness direction of the SCC. To explore the effect of different damage degrees on the damage identification, the contact loss thicknesses of SCC were taken as 18, 36, 54, and 72 mm. Correspondingly, their contact loss degrees are 20%, 40%, 60%, and 80%, respectively. Other settings are the same as in Section 2.2. The analysis shows that in the identification of Stage I, points 1 and 5 can be identified regardless of the degrees of SCC damage. Then, according to the layout scheme of the densified impact points in Fig. 19, the accelerations of the densified impact points under different damage degrees were calculated. According to the identification steps of Stage II introduced in Section 4.3, the 2D defect images under different damage conditions were obtained as shown in Fig. 25. Then, the damage identification accuracy can be obtained according to Eq. (10), as shown in Table 3.
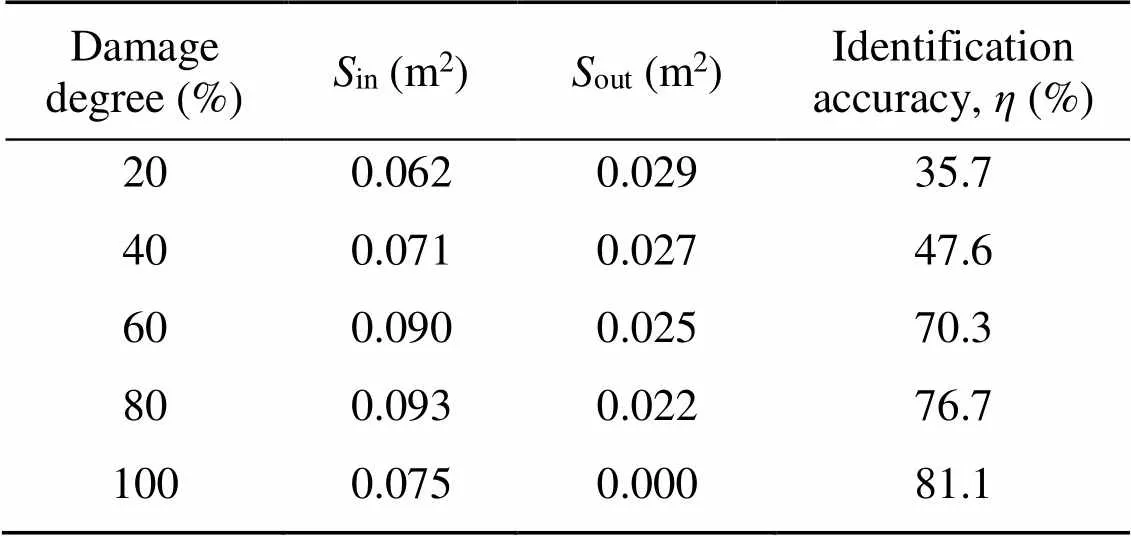
Table 3 Identification accuracy under different damage degrees
Fig. 25 and Table 3 show that when the degree of SCC contact loss is small (20% and 40%), the preset contact loss is not easily identified at a position relatively far from the damage center in the lateral direction. In addition, there is a large area of predicted damage in the area where damage was not set, resulting in low damage identification accuracy below 50%. When the degree of contact loss gradually increases (60% and 80%), contact loss at a position far from the damage center in the lateral direction can also be accurately identified. Further, in the area where damage is not set, the predicted damage gradually decreases, which improves the damage identification accuracy to 70.3% and 76.7%, respectively.
It is worth noting that the focus of this study is to investigate theoretically the effectiveness of the two-stage identification method for SCC damage identification. The random positions and irregular shapes are somewhat simplified by assuming that the contact loss is square and possesses different damage degrees. Based on the above analysis results, it can be seen that the identification accuracy is high when the damage degree is greater than 50%, and is greater than 70%. The reason is that larger damage can cause significant changes in the vibration response of the structures. Hence, it can be concluded that the proposed method is more suitable for the identification of a larger degree of interlayer damage. In addition, the proposed identification method is mainly based on the vibration response changes of the impact points on the track slab surface, so the method is also theoretically suitable for damage of other shapes and positions but further analysis is required.
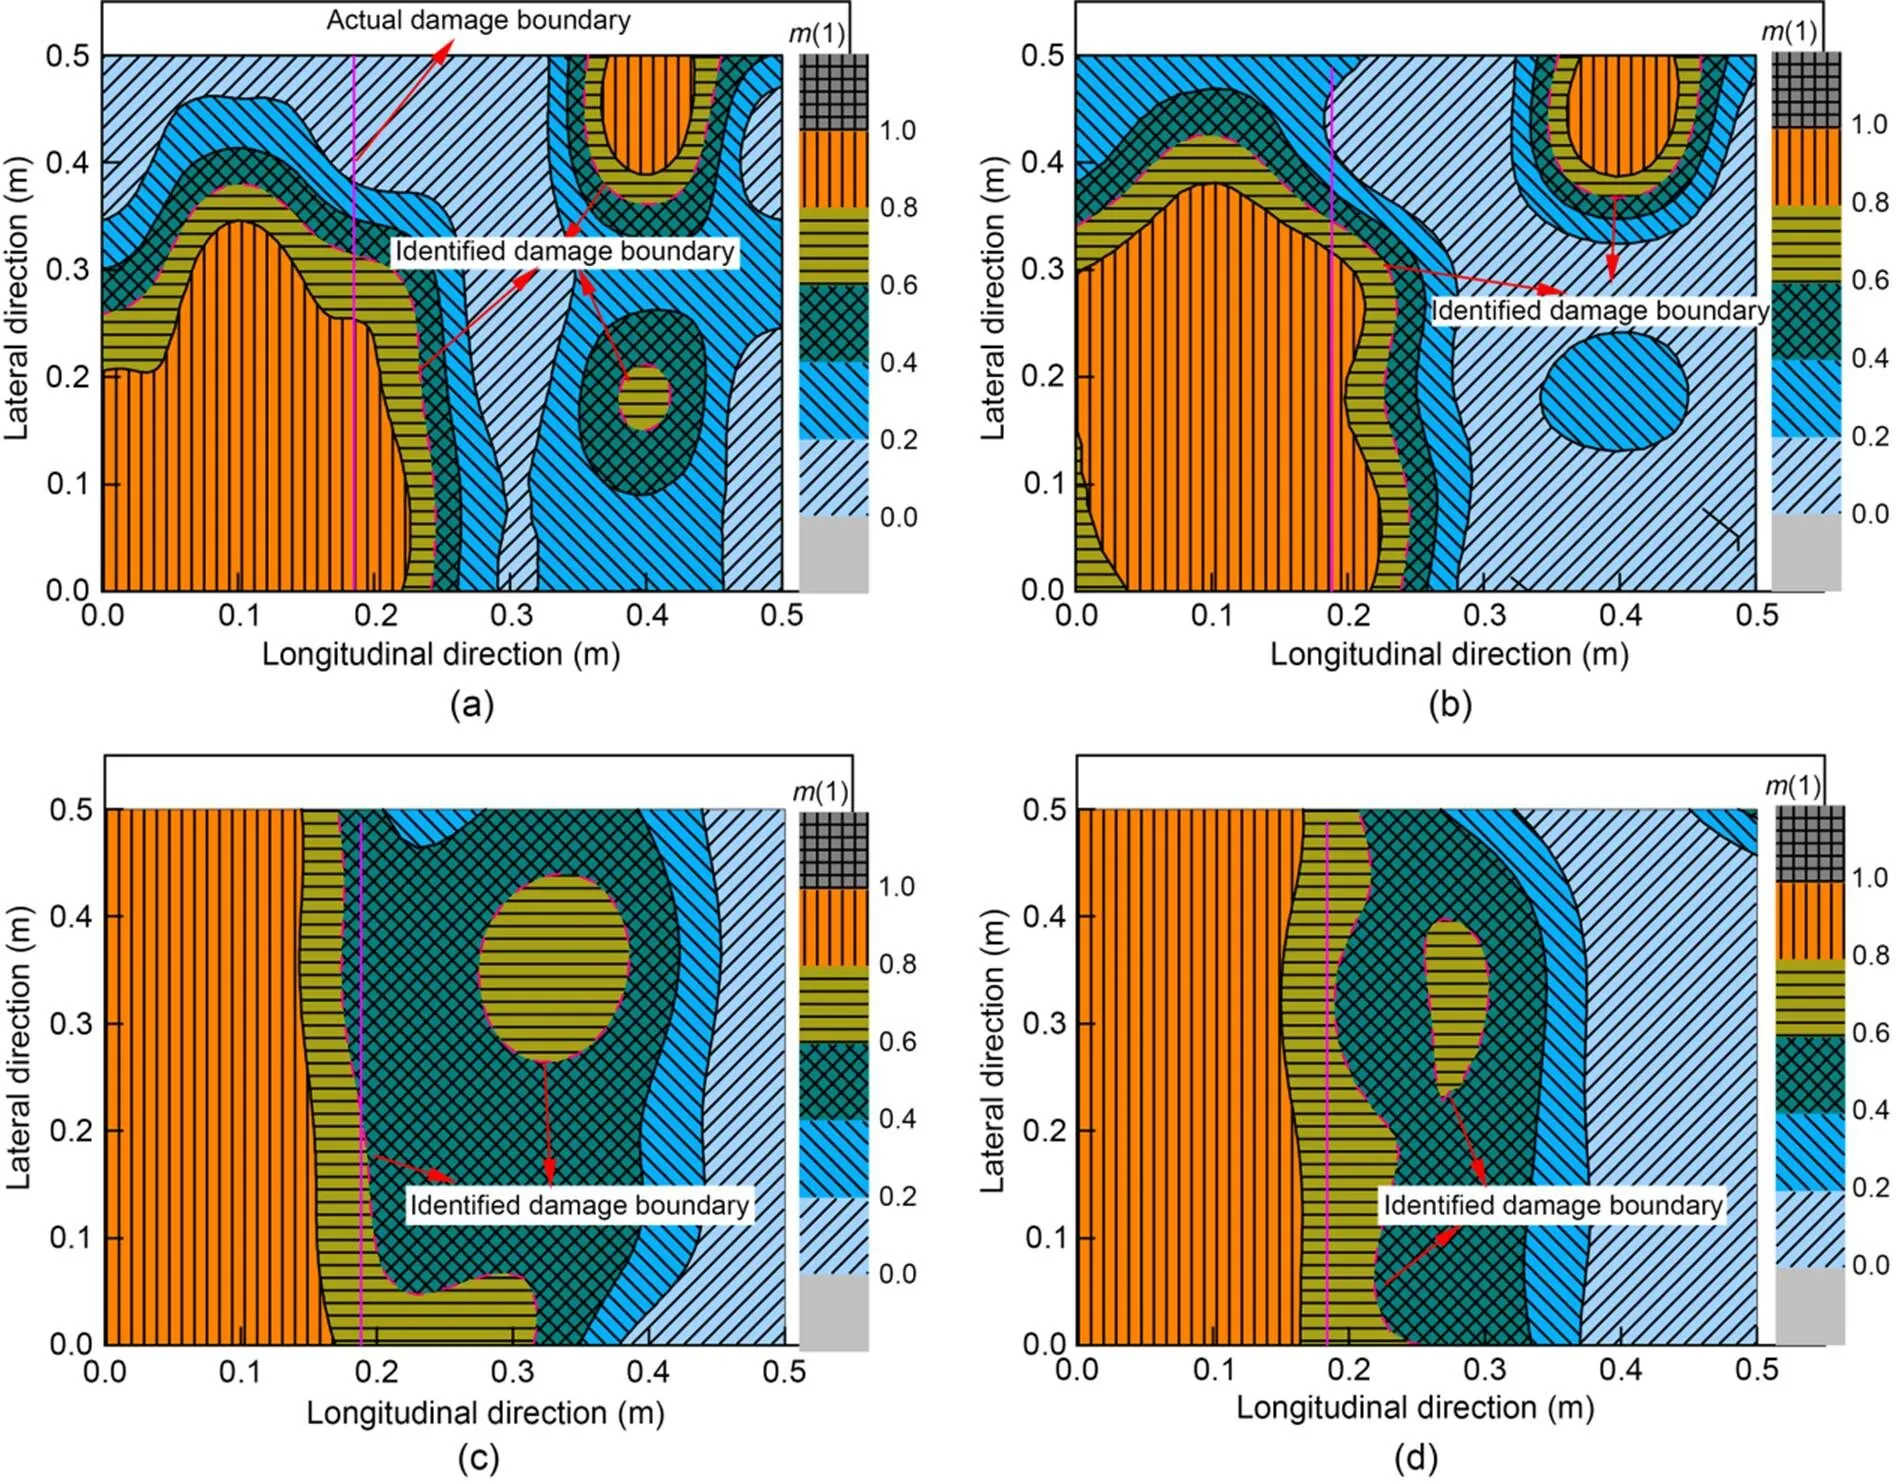
Fig. 25 Two-dimensional images of defect under different damage degrees: (a) 20%; (b) 40%; (c) 60%; (d) 80%
6 Conclusions
This study focuses on the contact loss between SCC and the track slab of the CRTS III prefabricated slab track. First, we extracted the vibration accelerations of the impact points on the track slab surface under transient impact load. Then according to the variation law of the responses in the time and frequency domains, we obtained damage indices that are sensitive to contact loss. These indices were fused by the D-S evidence theory and, finally, a more accurate identification of the interlayer contact loss in the slab track could be achieved using the two-stage identification method. The main conclusions are as follows:
(1) Based on the accelerations corresponding to the impact points in the damaged area, the five damage indices extracted from the time and frequency domains can comprehensively represent the damage information hidden in the vibration signals. However, it is difficult to guarantee the identification accuracy by using only a single damage index.
(2) The application of evidence theory can make full use of complementary information between multiple damage indices and reduce the uncertainty of identification. For Stage I, the location of the damaged area can be roughly identified by fusing five damage indices under different degrees of contact loss.
(3) The accuracy of damage identification is positively correlated with the damage degree. For Stage II, the identification accuracy can reach 70% to 80% when the contact loss degree of SCC is greater than 50%. The two-stage method proposed in this study offers theoretical support for the maintenance and repair of slab tracks.
This work is supported by the National Key R&D Program of China (Nos. 2021YFF0502100 and 2021YFB2600900), the National Natural Science Foundation of China (Nos. 52022085 and 52278461), and the Sichuan Provincial Youth Science and Technology Innovation Team (No. 2022JDTD0015), China.
Wei DU: conceptualization, methodology, and writing-original draft. Juanjuan REN: conceptualization and funding acquisition. Kaiyao ZHANG: data processing. Shijie DENG: assistance in manuscript organization. Shuyi ZHANG: assistance in manuscript organization.
Wei DU, Juanjuan REN, Kaiyao ZHANG, Shijie DENG, and Shuyi ZHANG declare that they have no conflict of interest.
Auersch L, Said S, 2017. Track-soil dynamics–calculation and measurement of damaged and repaired slab tracks., 12:1-14. https://doi.org/10.1016/j.trgeo.2017.06.003
Auersch L, Said S, 2020. Slab track behaviour under train passage and hammer impact-measurements at different sites and calculated track interaction with continuous soils., 25(3):341-354. https://doi.org/10.20855/ijav.2020.25.31622
Bahati PA, Le VD, Lim Y, 2021. An impact echo method to detect cavities between railway track slabs and soil foundation., 68(1):7. https://doi.org/10.1186/s44147-021-00008-w
Cassidy NJ, Eddies R, Dods S, 2011. Void detection beneath reinforced concrete sections: the practical application of ground-penetrating radar and ultrasonic techniques., 74(4):263-276. https://doi.org/10.1016/j.jappgeo.2011.06.003
Davis AG, Lim MK, Petersen CG, 2005. Rapid and economical evaluation of concrete tunnel linings with impulse response and impulse radar non-destructive methods., 38(3):181-186. https://doi.org/10.1016/j.ndteint.2004.03.011
Grande E, Imbimbo M, 2014. A multi-stage data-fusion procedure for damage detection of linear systems based on modal strain energy., 4(2):107-118. https://doi.org/10.1007/s13349-013-0070-3
Harseno RW, Lee SJ, Kee SH, et al., 2022. Evaluation of air-cavities behind concrete tunnel linings using GPR measurements., 14(21):5348. https://doi.org/10.3390/rs14215348
Hoła J, Sadowski Ł, Schabowicz K, 2009. Nondestructive evaluation of the concrete floor quality using impulse response method and impact-echo method., 14(3):55-62.
Hu Q, Shen YJ, Zhu HP, et al., 2021. A feasibility study on void detection of cement-emulsified asphalt mortar for slab track system utilizing measured vibration data., 245:112349. https://doi.org/10.1016/j.engstruct.2021.112349
Jiang W, Wei BY, Xie CH, et al., 2016. An evidential sensor fusion method in fault diagnosis., 8(3):1-7. https://doi.org/10.1177/1687814016641820
Jiang W, Xie YJ, Wu JX, et al., 2020. Influence of age on the detection of defects at the bonding interface in the CRTS III slab ballastless track structure via the impact-echo method., 265:120787. https://doi.org/10.1016/j.conbuildmat.2020.120787
Ke YT, Cheng CC, Lin YC, et al., 2020. Preliminary study on assessing delaminated cracks in cement asphalt mortar layer of high-speed rail track using traditional and normalized impact-echo methods., 20(11):3022. https://doi.org/10.3390/s20113022
Kee SH, Zhu JY, 2010. Using air-coupled sensors to determine the depth of a surface-breaking crack in concrete., 127(3):1279-1287. https://doi.org/10.1121/1.3298431
Khanna V, Mooney MA, Miller GA, 2012. Impulse response dynamic stiffness decay in aging general aviation airfield pavements., 2304(1):119-129. https://doi.org/10.3141/2304-14
Lee JW, Lee SJ, Kee SH, 2021. Evaluation of a concrete slab track with debonding at the interface between track concrete layer and hydraulically stabilized base course using multi-channel impact-echo testing., 21(21):7091. https://doi.org/10.3390/s21217091
Li N, Long GC, Fu Q, et al., 2019. Effects of freeze and cyclic flexural load on mechanical evolution of filling layer self-compacting concrete., 200:198-208. https://doi.org/10.1016/j.conbuildmat.2018.11.177
Liao HJ, Zhu QN, Zan YW, et al., 2016. Detection of ballastless track diseases in high-speed railway based on ground penetrating radar., 51(1):8-13 (in Chinese). https://doi.org/10.3969/j.issn.0258-2724.2016.01.002
Lin YC, Sansalone M, Carino NJ, 1990. Finite element studies of the impact-echo response of plates containing thin layers and voids., 9(1):27-47. https://doi.org/10.1007/BF00566980
Liu LY, Lv R, Liu HL, 2011. Vertical high frequency vibration response analysis of ballastless track., 8(6):1-6 (in Chinese). https://doi.org/10.19713/j.cnki.43-1423/u.2011.06.001
Ma DD, 2015. Study on Ground Penetrating Radar Detection Method Used in Under Line Layered Structure of High-Speed Railway. MS Thesis, Harbin Institute of Technology, Harbin, China (in Chinese).
Martin JD, Simpson TW, 2005. Use of Kriging models to approximate deterministic computer models., 43(4):853-863. https://doi.org/10.2514/1.8650
McCabe T, Erdogmus E, Kodsy A, et al., 2021. Early detection of honeycombs in concrete pavement using GPR., 35(1):04020138. https://doi.org/10.1061/(ASCE)CF.1943-5509.0001547
Oh T, Popovics JS, Ham S, et al., 2013. Improved interpretation of vibration responses from concrete delamination defects using air-coupled impact resonance tests., 139(3):315-324. https://doi.org/10.1061/(ASCE)EM.1943-7889.0000491
Ren JJ, Li HL, Cai XP, et al., 2020. Viscoelastic deformation behavior of cement and emulsified asphalt mortar in China railway track system I prefabricated slab track., 21(4):304-316. https://doi.org/10.1631/jzus.A1900525
Ren JJ, Du W, Liu J, et al., 2021a. Damage identification of steel spring for floating slab track based on index fusion., 49(11):95-100 (in Chinese). https://doi.org/10.13245/j.hust.211116
Ren JJ, Deng SJ, Zhang KY, et al., 2021b. Design theories and maintenance technologies of slab tracks for high-speed railways in China: a review., 3(4):tdab024. https://doi.org/10.1093/tse/tdab024
Shu ZL, Zhu SY, Zhang HJ, 2021. Ground penetrating radar detection and three-dimensional forward modeling of CA mortar layer disease on ballastless track., 18(7):1679-1685 (in Chinese). https://doi.org/10.19713/j.cnki.43-1423/u.T20200819
Sun WJ, Thompson D, Toward M, et al., 2020. Modelling of vibration and noise behaviour of embedded tram tracks using a wavenumber domain method., 481:115446. https://doi.org/10.1016/j.jsv.2020.115446
Suranthiran S, Jayasuriya S, 2003. Effective fusion of distorted multi-sensor data. Proceedings of the IEEE International Symposium on Intelligent Control, p.444-449. https://doi.org/10.1109/ISIC.2003.1254676
Thompson DJ, Jones CJC, Wu TX, et al., 1999. The influence of the non-linear stiffness behaviour of rail pads on the track component of rolling noise., 213(4):233-241. https://doi.org/10.1243/0954409991531173
Tian XS, Zhao WG, Du YL, et al., 2018. Detection of mortar defects in ballastless tracks of high-speed railway using transient elastic wave method., 8(1):151-160. https://doi.org/10.1007/s13349-017-0265-0
Tian XS, Du YL, Zhao WG, 2019. Detection and identification of mortar void in the ballastless track of high-speed railway based on transient impact characteristics., 38(18):148-153 (in Chinese). https://doi.org/10.13465/j.cnki.jvs.2019.18.021
Varnavina AV, Khamzin AK, Torgashov EV, et al., 2015. Data acquisition and processing parameters for concrete bridge deck condition assessment using ground-coupled ground penetrating radar: some considerations., 114:123-133. https://doi.org/10.1016/j.jappgeo.2015.01.011
Wang Q, Han X, Yi ZJ, 2010. Study on identification of cavity area under concrete pavement using transient impulse-response method., 27(11):26-32 (in Chinese). https://doi.org/10.1061/JHTRCQ.0000083
Wu SS, 2018. Research on Void Detection Method of CRTS II Slab Track Based on Transient Impulse Response. MS Thesis, Shijiazhuang Tiedao University, Shijiazhuang, China (in Chinese).
Xu JM, Wang P, An BY, et al., 2018. Damage detection of ballastless railway tracks by the impact-echo method., 171(2):106-114. https://doi.org/10.1680/jtran.16.00146
Xu YD, Hu M, Xu GY, et al., 2022. Applicability of air-coupled impact echo method for detecting interlayer void of ballastless track., 53(5):1918-1929 (in Chinese). https://doi.org/10.11817/j.issn.1672-7207.2022.05.035
Yang Y, Zhao WG, 2019. Curvelet transform-based identification of void diseases in ballastless track by ground-penetrating radar., 26(4):e2322. https://doi.org/10.1002/stc.2322
Yang Y, Tian XS, Zhao WG, et al., 2022. Analysis on identification of seam separation defect of ballastless track based on SST., 44(7):117-124 (in Chinese). https://doi.org/10.3969/j.issn.1001-8360.2022.07.014
Ye WL, Ren JJ, Zhang AA, et al., 2023. Automatic pixel-level crack detection with multi-scale feature fusion for slab tracks., in press. https://doi.org/10.1111/mice.12984
Zhan JW, Shi Z, Pan LJ, et al., 2020. Disease assessment method for CA mortar layer of CRTS I slab ballastless track based on dynamic stiffness., 41(4):21-28 (in Chinese). https://doi.org/10.3969/j.issn.1001-4632.2020.04.03
Zhang GY, Wang Z, Wang BX, et al., 2020. Method of ballastless track mortar layer void disease detection based on multi-source feature fusion., 43(22):62-66 (in Chinese). https://doi.org/10.16652/j.issn.1004-373x.2020.22.015
Zhu JY, Popovics JS, 2007. Imaging concrete structures using air-coupled impact-echo., 133(6):628-640. https://doi.org/10.1061/(asce)0733-9399(2007)133:6(628)
Zoidis N, Tatsis E, Vlachopoulos C, et al., 2013. Inspection, evaluation and repair monitoring of cracked concrete floor using NDT methods., 48:1302-1308. https://doi.org/10.1016/j.conbuildmat.2013.06.082
Kaiyao ZHANG, zhangky96@my.swjtu.edu.cn
Shijie DENG, https://orcid.org/0009-0006-4883-6888
Shuyi ZHANG, https://orcid.org/0009-0007-0979-2402
Jan. 7, 2023;
Revision accepted Mar. 13, 2023;
Crosschecked Apr. 20, 2023
© Zhejiang University Press 2023
 Journal of Zhejiang University-Science A(Applied Physics & Engineering)2023年6期
- Journal of Zhejiang University-Science A(Applied Physics & Engineering)的其它文章
- Investigation of flow characteristics in a rotor-stator cavity under crossflow using wall-modelled large-eddy simulation
- Effect of additional cylinders on power-extraction performance of a Savonius vertical-axis wind turbine
- A stability locomotion-control strategy for quadruped robots with center-of-mass dynamic planning
- Compressive properties of a novel slurry-infiltrated fiber concrete reinforced with arc-shaped steel fibers